Statistics for Business: Football Player Age Report Analysis
VerifiedAdded on 2022/09/26
|5
|727
|23
Report
AI Summary
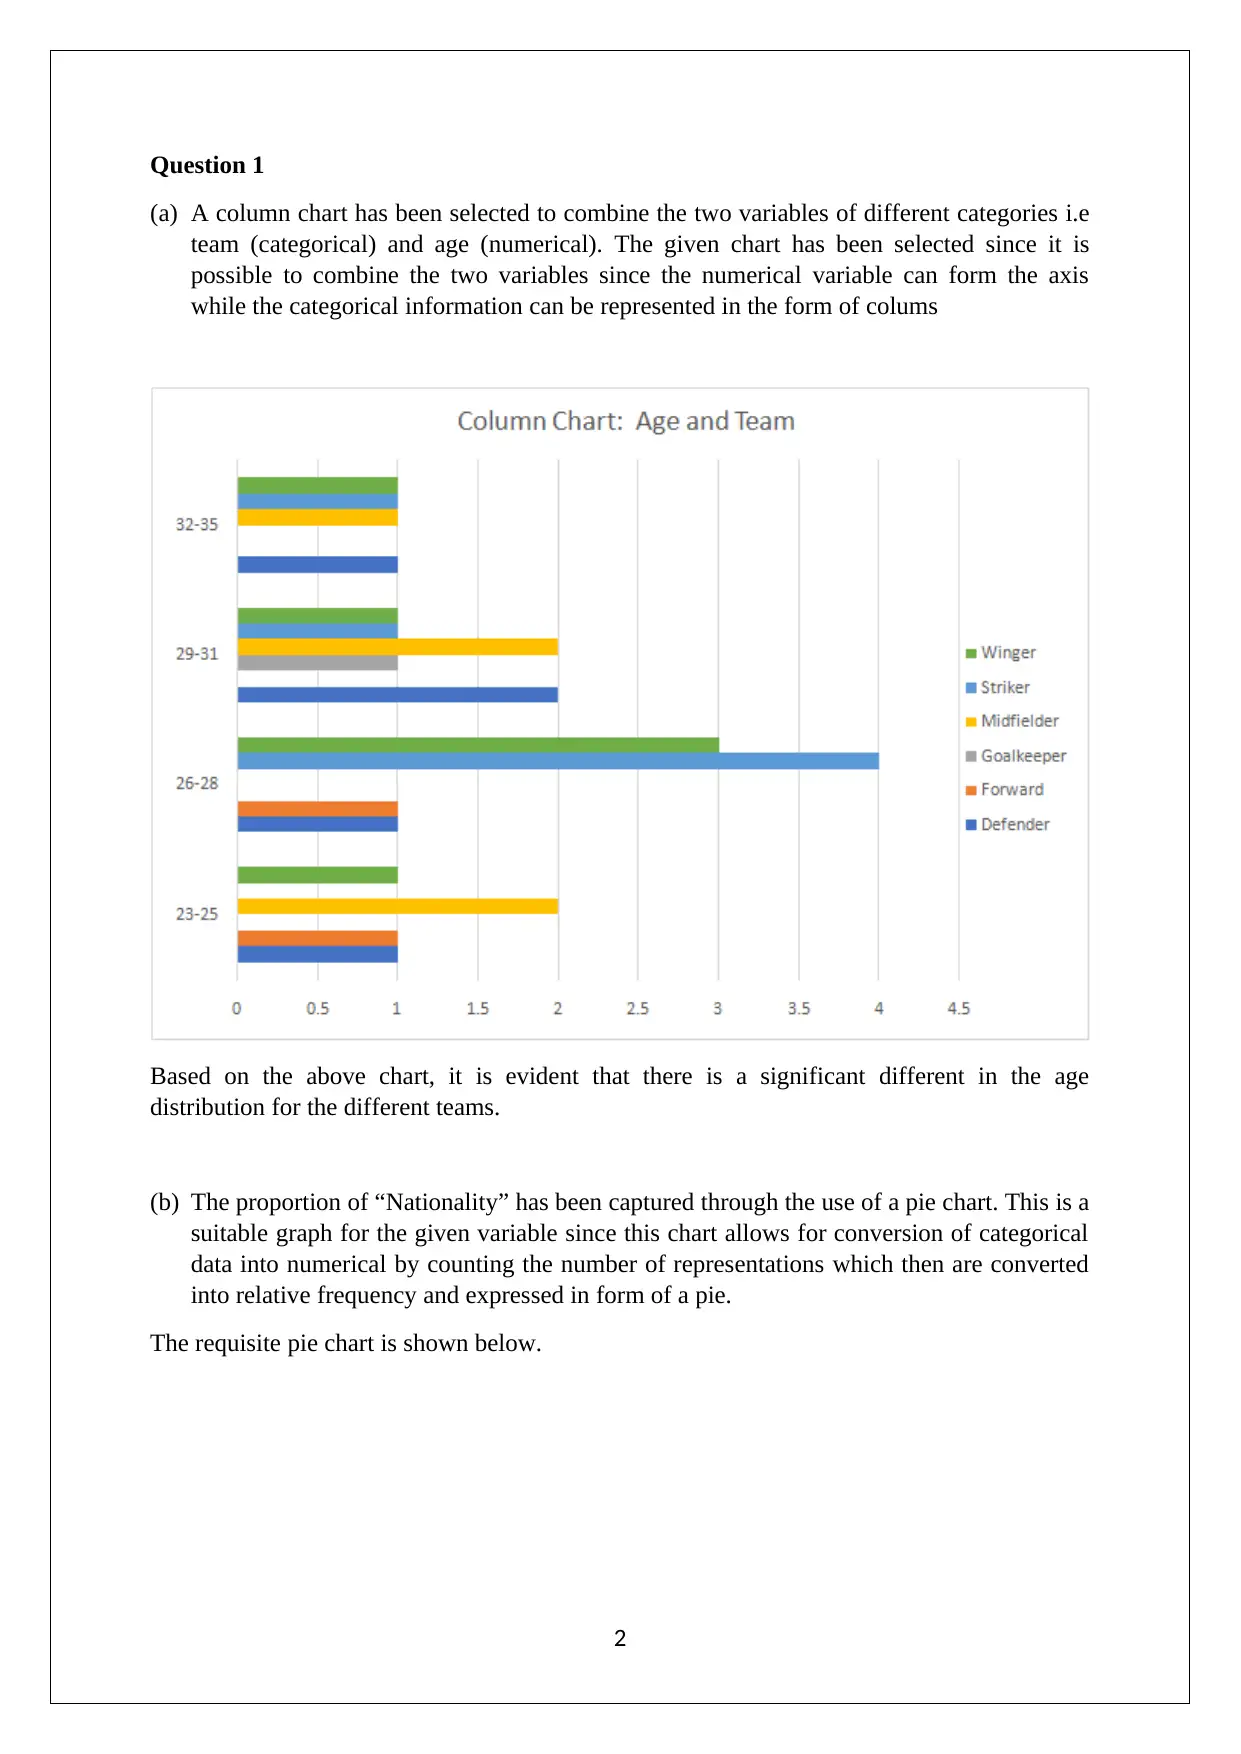
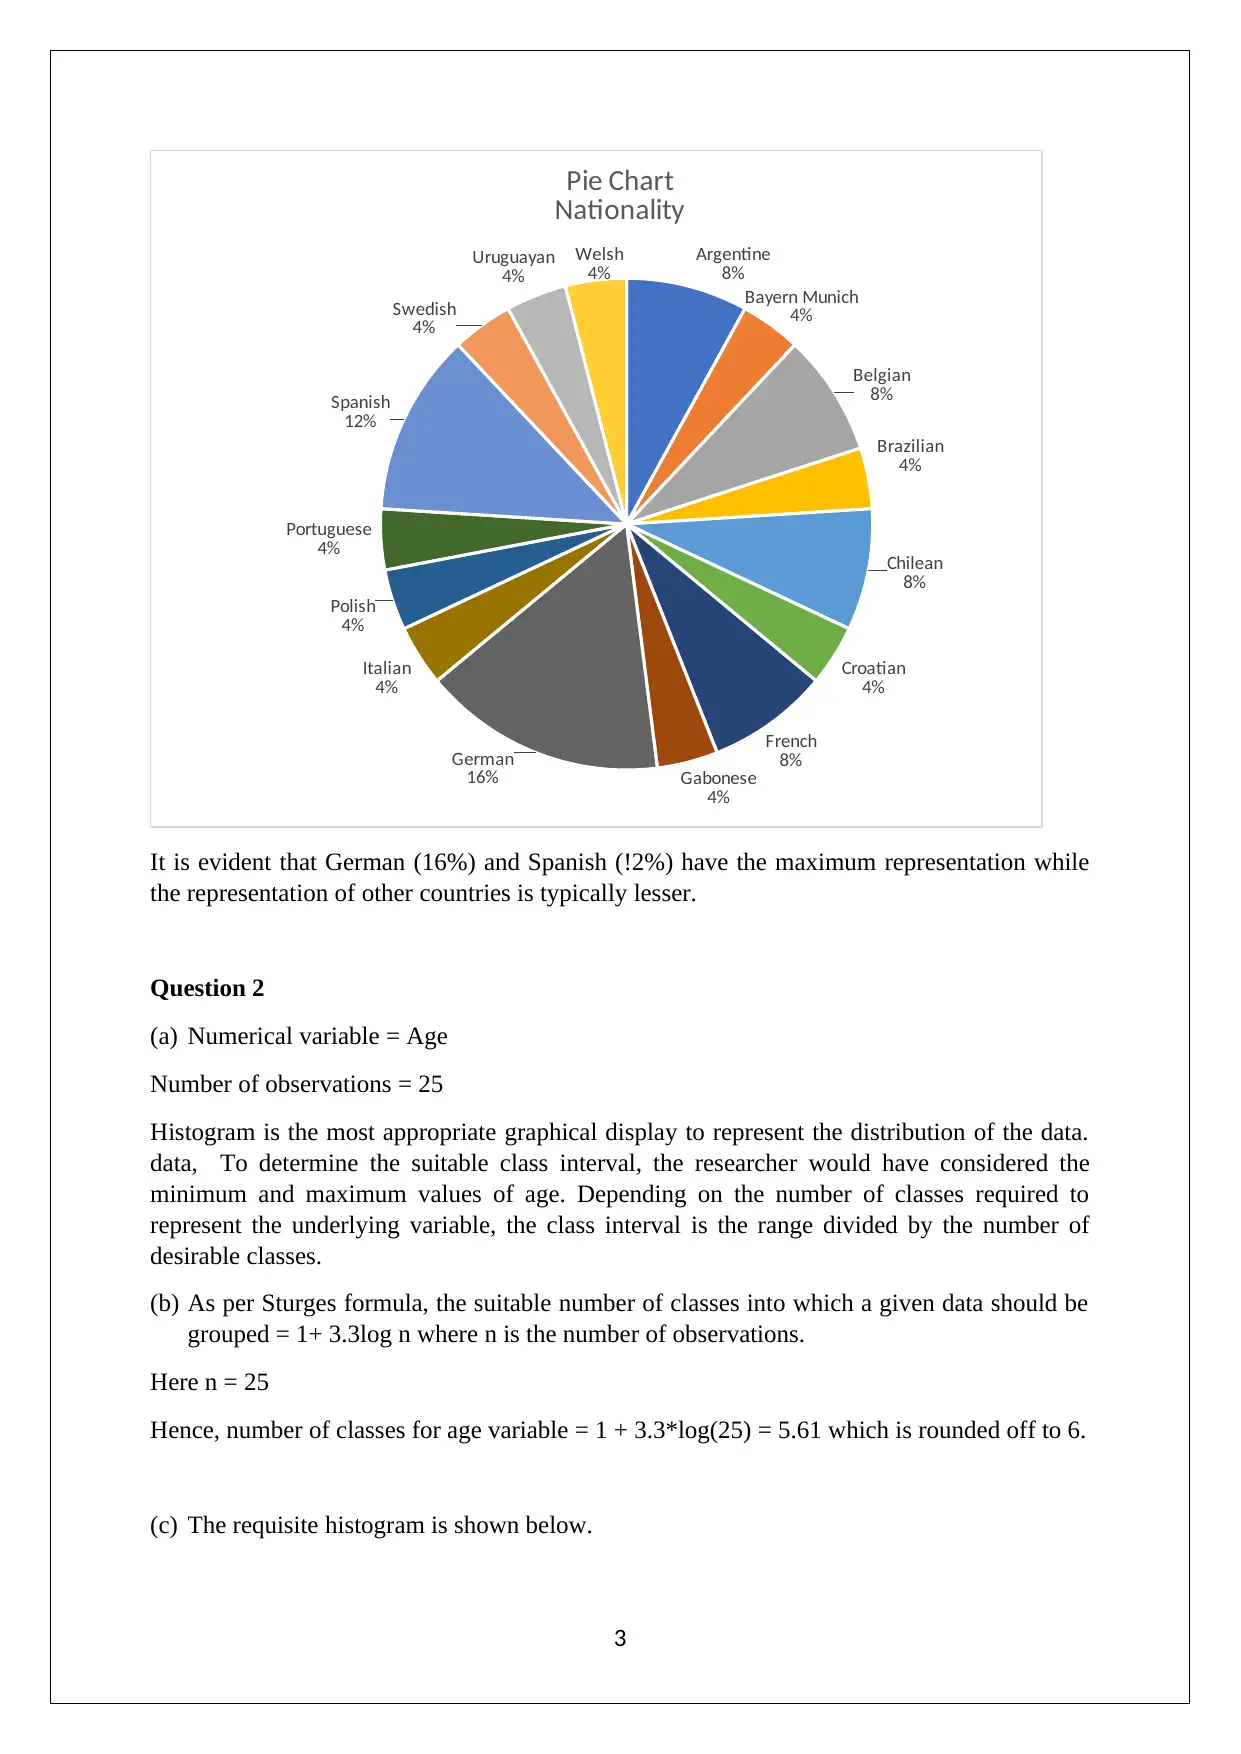
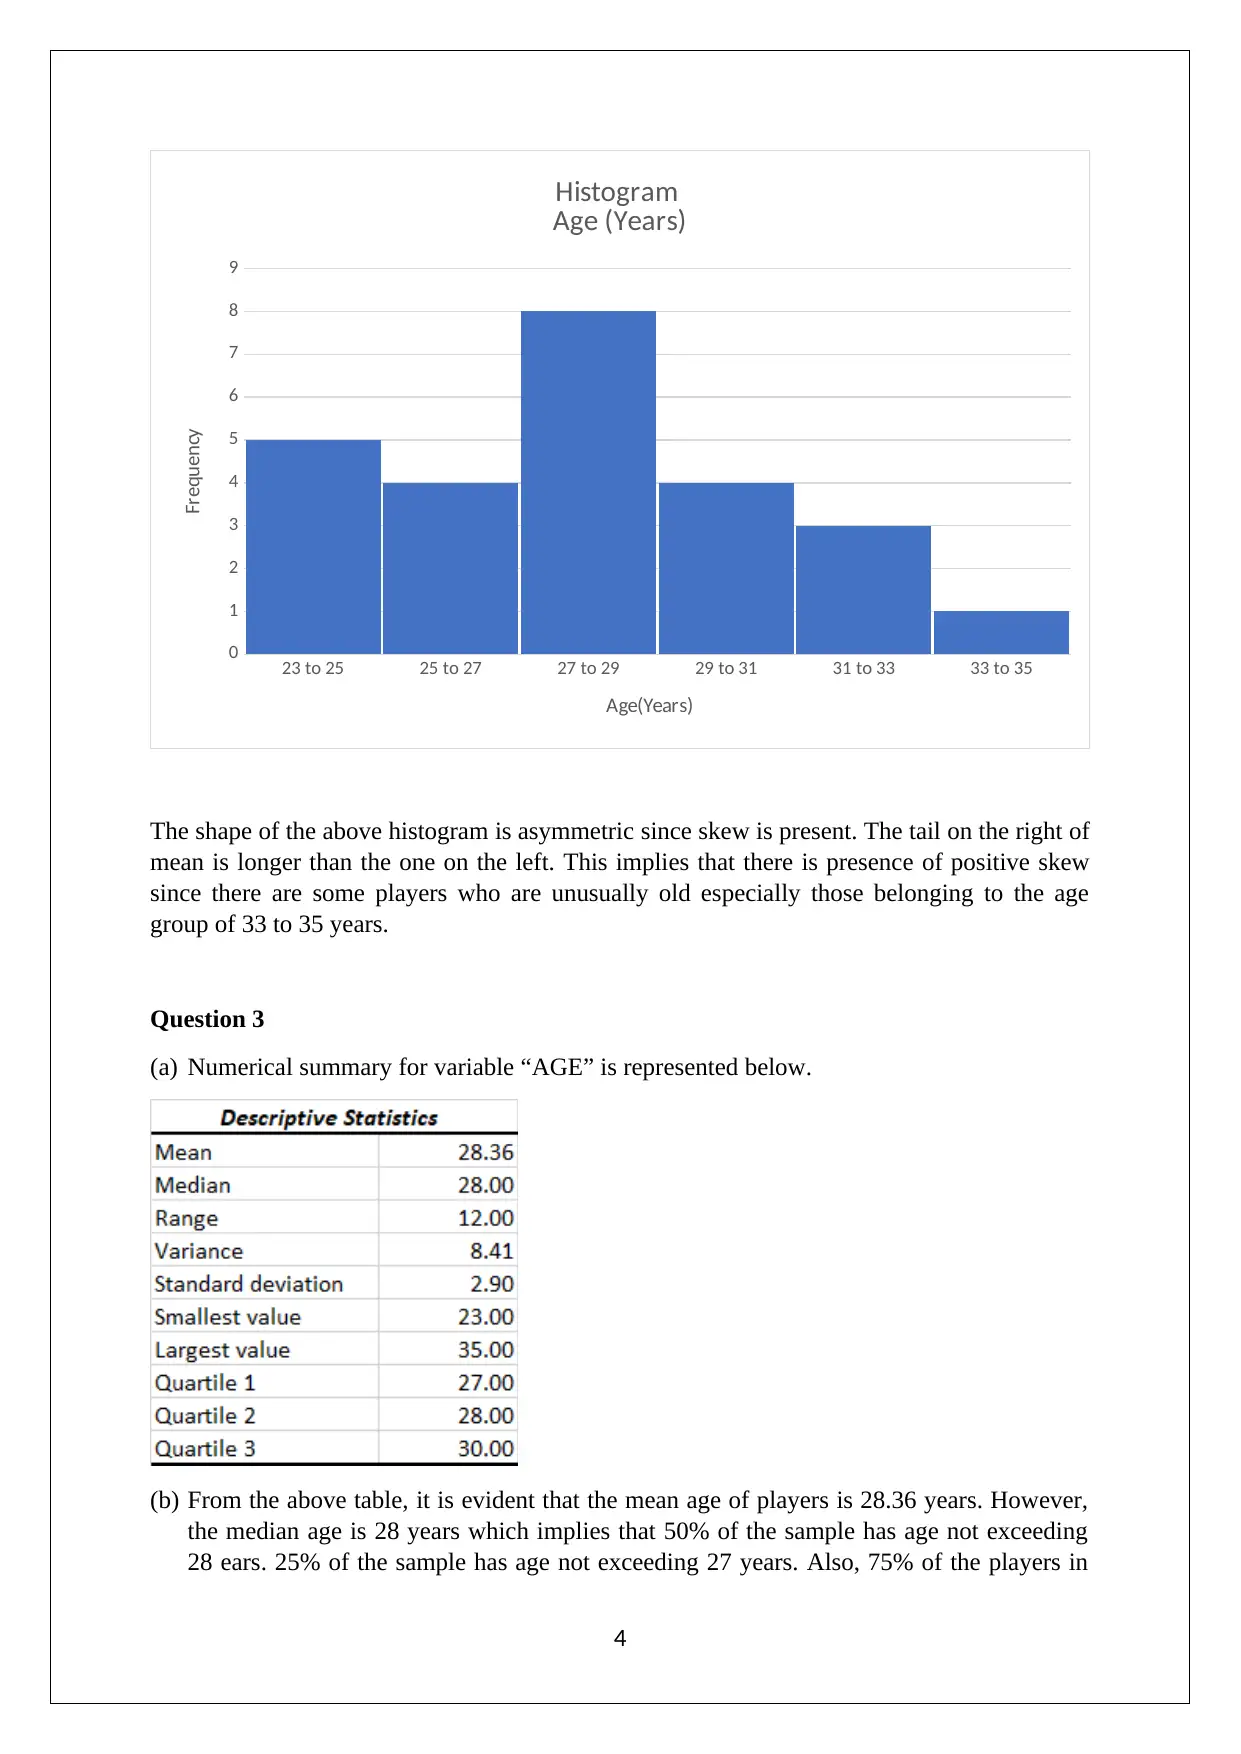
This report presents a statistical analysis of football player age data. It begins by selecting appropriate graphical displays, such as column charts and pie charts, to represent categorical and numerical variables like team and age, as well as nationality. The report then delves into the analysis of the ...

STATISTICS FOR BUSINESS
STUDENT ID:
[Pick the date]
STUDENT ID:
[Pick the date]
Paraphrase This Document
Need a fresh take? Get an instant paraphrase of this document with our AI Paraphraser

Question 1
(a) A column chart has been selected to combine the two variables of different categories i.e
team (categorical) and age (numerical). The given chart has been selected since it is
possible to combine the two variables since the numerical variable can form the axis
while the categorical information can be represented in the form of colums
Based on the above chart, it is evident that there is a significant different in the age
distribution for the different teams.
(b) The proportion of “Nationality” has been captured through the use of a pie chart. This is a
suitable graph for the given variable since this chart allows for conversion of categorical
data into numerical by counting the number of representations which then are converted
into relative frequency and expressed in form of a pie.
The requisite pie chart is shown below.
2

Argentine
8%
Bayern Munich
4%
Belgian
8%
Brazilian
4%
Chilean
8%
Croatian
4%
French
8%
Gabonese
4%
German
16%
Italian
4%
Polish
4%
Portuguese
4%
Spanish
12%
Swedish
4%
Uruguayan
4%
Welsh
4%
Pie Chart
Nationality
It is evident that German (16%) and Spanish (!2%) have the maximum representation while
the representation of other countries is typically lesser.
Question 2
(a) Numerical variable = Age
Number of observations = 25
Histogram is the most appropriate graphical display to represent the distribution of the data.
data, To determine the suitable class interval, the researcher would have considered the
minimum and maximum values of age. Depending on the number of classes required to
represent the underlying variable, the class interval is the range divided by the number of
desirable classes.
(b) As per Sturges formula, the suitable number of classes into which a given data should be
grouped = 1+ 3.3log n where n is the number of observations.
Here n = 25
Hence, number of classes for age variable = 1 + 3.3*log(25) = 5.61 which is rounded off to 6.
(c) The requisite histogram is shown below.
3
8%
Bayern Munich
4%
Belgian
8%
Brazilian
4%
Chilean
8%
Croatian
4%
French
8%
Gabonese
4%
German
16%
Italian
4%
Polish
4%
Portuguese
4%
Spanish
12%
Swedish
4%
Uruguayan
4%
Welsh
4%
Pie Chart
Nationality
It is evident that German (16%) and Spanish (!2%) have the maximum representation while
the representation of other countries is typically lesser.
Question 2
(a) Numerical variable = Age
Number of observations = 25
Histogram is the most appropriate graphical display to represent the distribution of the data.
data, To determine the suitable class interval, the researcher would have considered the
minimum and maximum values of age. Depending on the number of classes required to
represent the underlying variable, the class interval is the range divided by the number of
desirable classes.
(b) As per Sturges formula, the suitable number of classes into which a given data should be
grouped = 1+ 3.3log n where n is the number of observations.
Here n = 25
Hence, number of classes for age variable = 1 + 3.3*log(25) = 5.61 which is rounded off to 6.
(c) The requisite histogram is shown below.
3
⊘ This is a preview!⊘
Do you want full access?
Subscribe today to unlock all pages.

Trusted by 1+ million students worldwide

23 to 25 25 to 27 27 to 29 29 to 31 31 to 33 33 to 35
0
1
2
3
4
5
6
7
8
9
Histogram
Age (Years)
Age(Years)
Frequency
The shape of the above histogram is asymmetric since skew is present. The tail on the right of
mean is longer than the one on the left. This implies that there is presence of positive skew
since there are some players who are unusually old especially those belonging to the age
group of 33 to 35 years.
Question 3
(a) Numerical summary for variable “AGE” is represented below.
(b) From the above table, it is evident that the mean age of players is 28.36 years. However,
the median age is 28 years which implies that 50% of the sample has age not exceeding
28 ears. 25% of the sample has age not exceeding 27 years. Also, 75% of the players in
4
Paraphrase This Document
Need a fresh take? Get an instant paraphrase of this document with our AI Paraphraser

the sample are not over 30 years in age. The variation in the age variable is medium
considering the values of range, variance and Interquartile Range (Quartile 3 – Quartile
1).
Question 4
Research Question
The research question that I wish to answer based on the given data is as follows.
“Is the average age of football players less than 30 years?”
Data Set Description
The given dataset comprises of information about 25 football players and comprises of four
variables namely age, nationality, team and position. In order to answer the research question,
the primary focus of the statistical analysis was the numerical variable age. The other three
variables were categorical variables which have been represented by non-numerical values.
Statistical Results
Based on the histogram and summary statistics for the age variable, it is evident that average
age of players is 28.36 years which is lesser than 30 years. Also, there are only 25% players
whose age exceeds 30 years. Also, from the histogram, there is a general downward trend in
frequency of respective classes as we move beyond 29 years. This clearly indicates that only
limited players above 30 years exist at this level which may be on account of physical
requirements.
Conclusion
Based on the given sample data and the requisite statistical analysis, it may be concluded that
the average age of football players is less than 30 years.
5
1 out of 5
Related Documents

Your All-in-One AI-Powered Toolkit for Academic Success.
+13062052269
info@desklib.com
Available 24*7 on WhatsApp / Email
Unlock your academic potential
© 2024 | Zucol Services PVT LTD | All rights reserved.