Using Data to Build Business Practice Report: Region Analysis
VerifiedAdded on 2023/01/11
|18
|3261
|72
Report
AI Summary
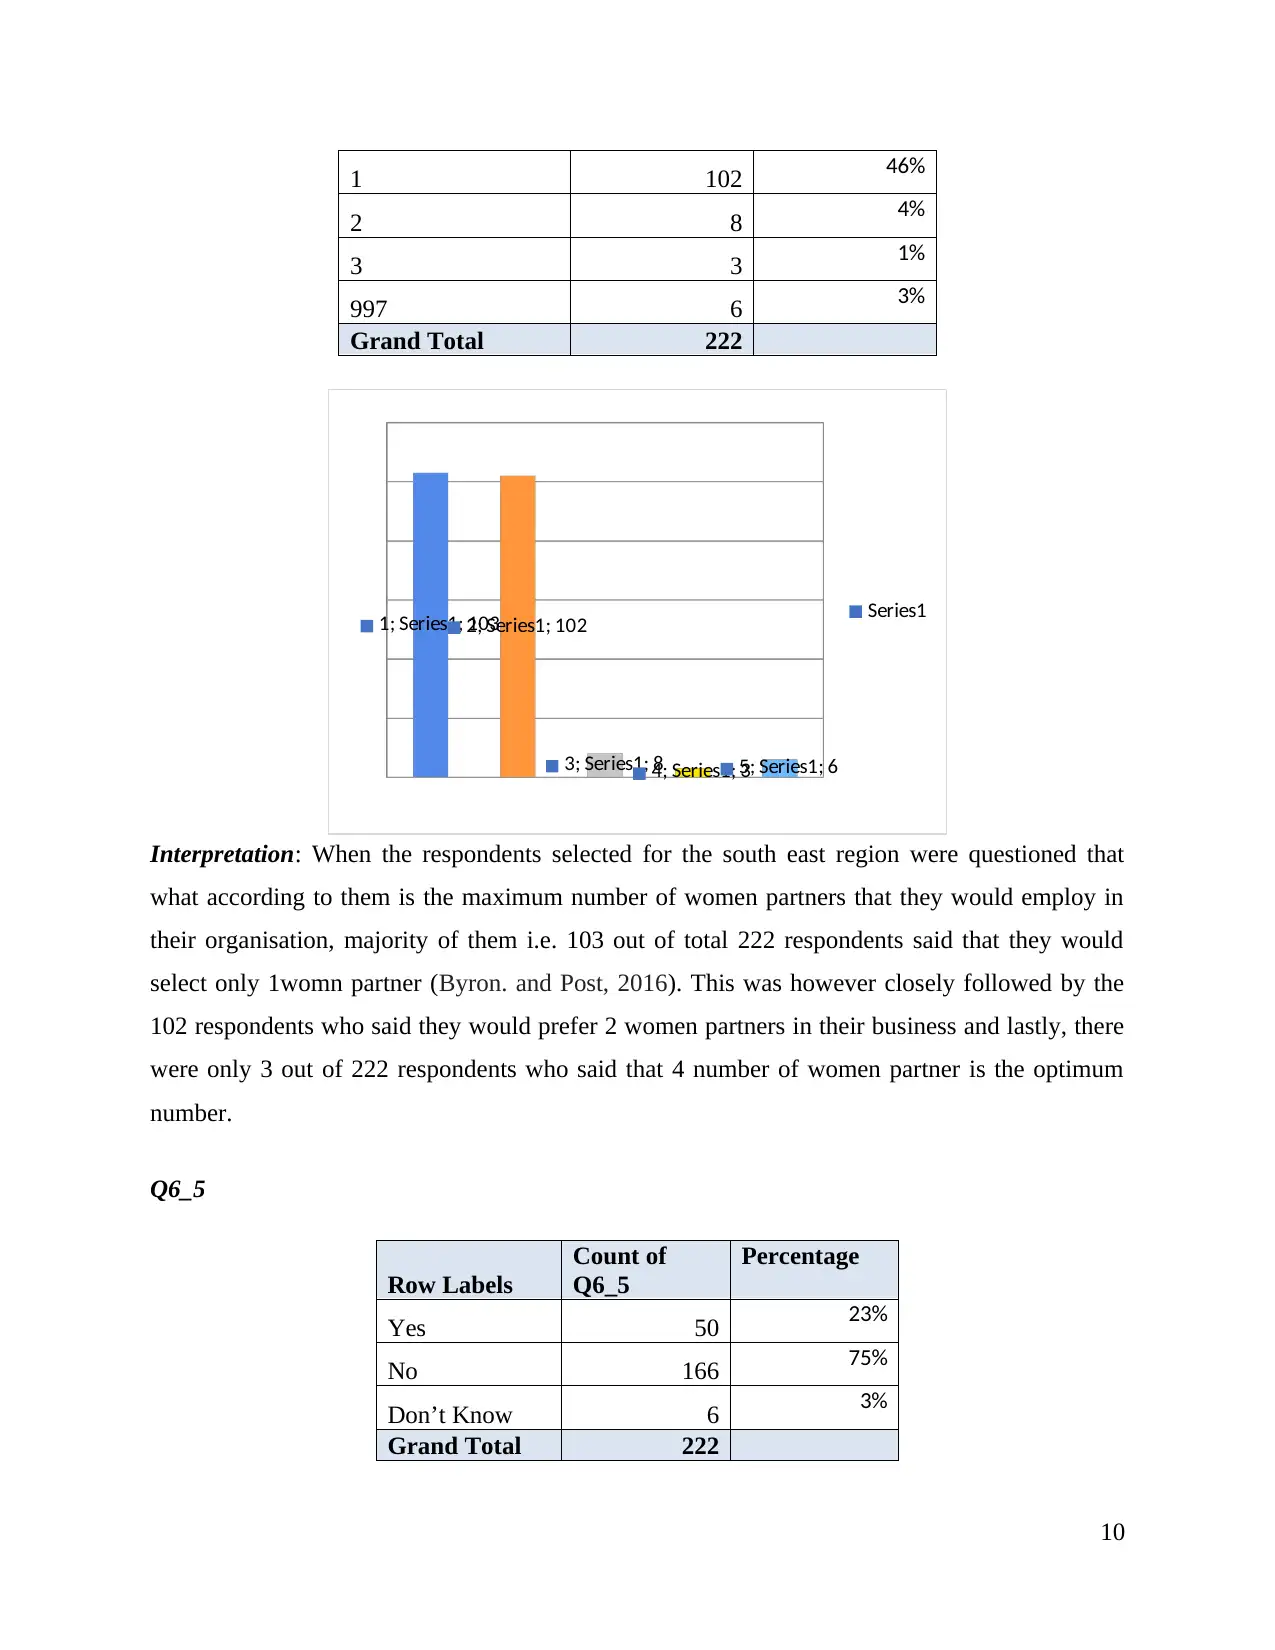
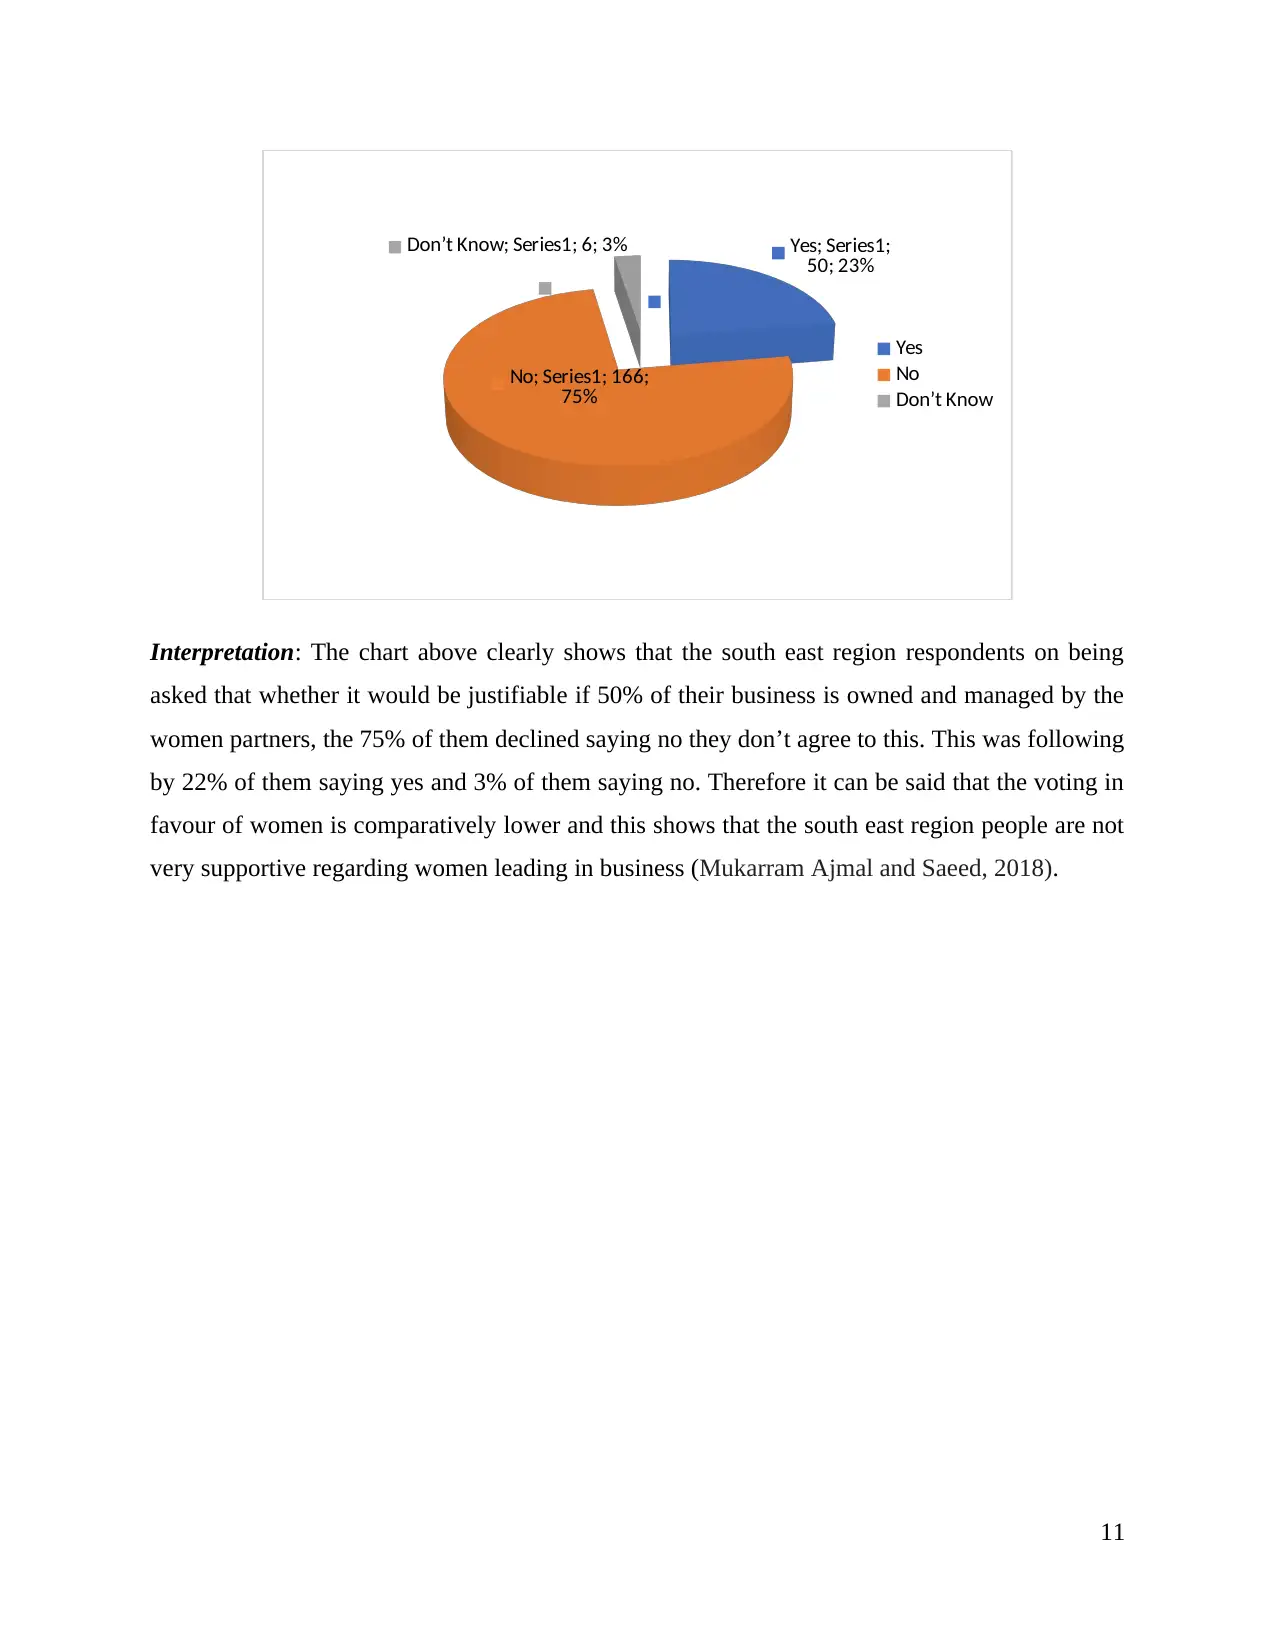
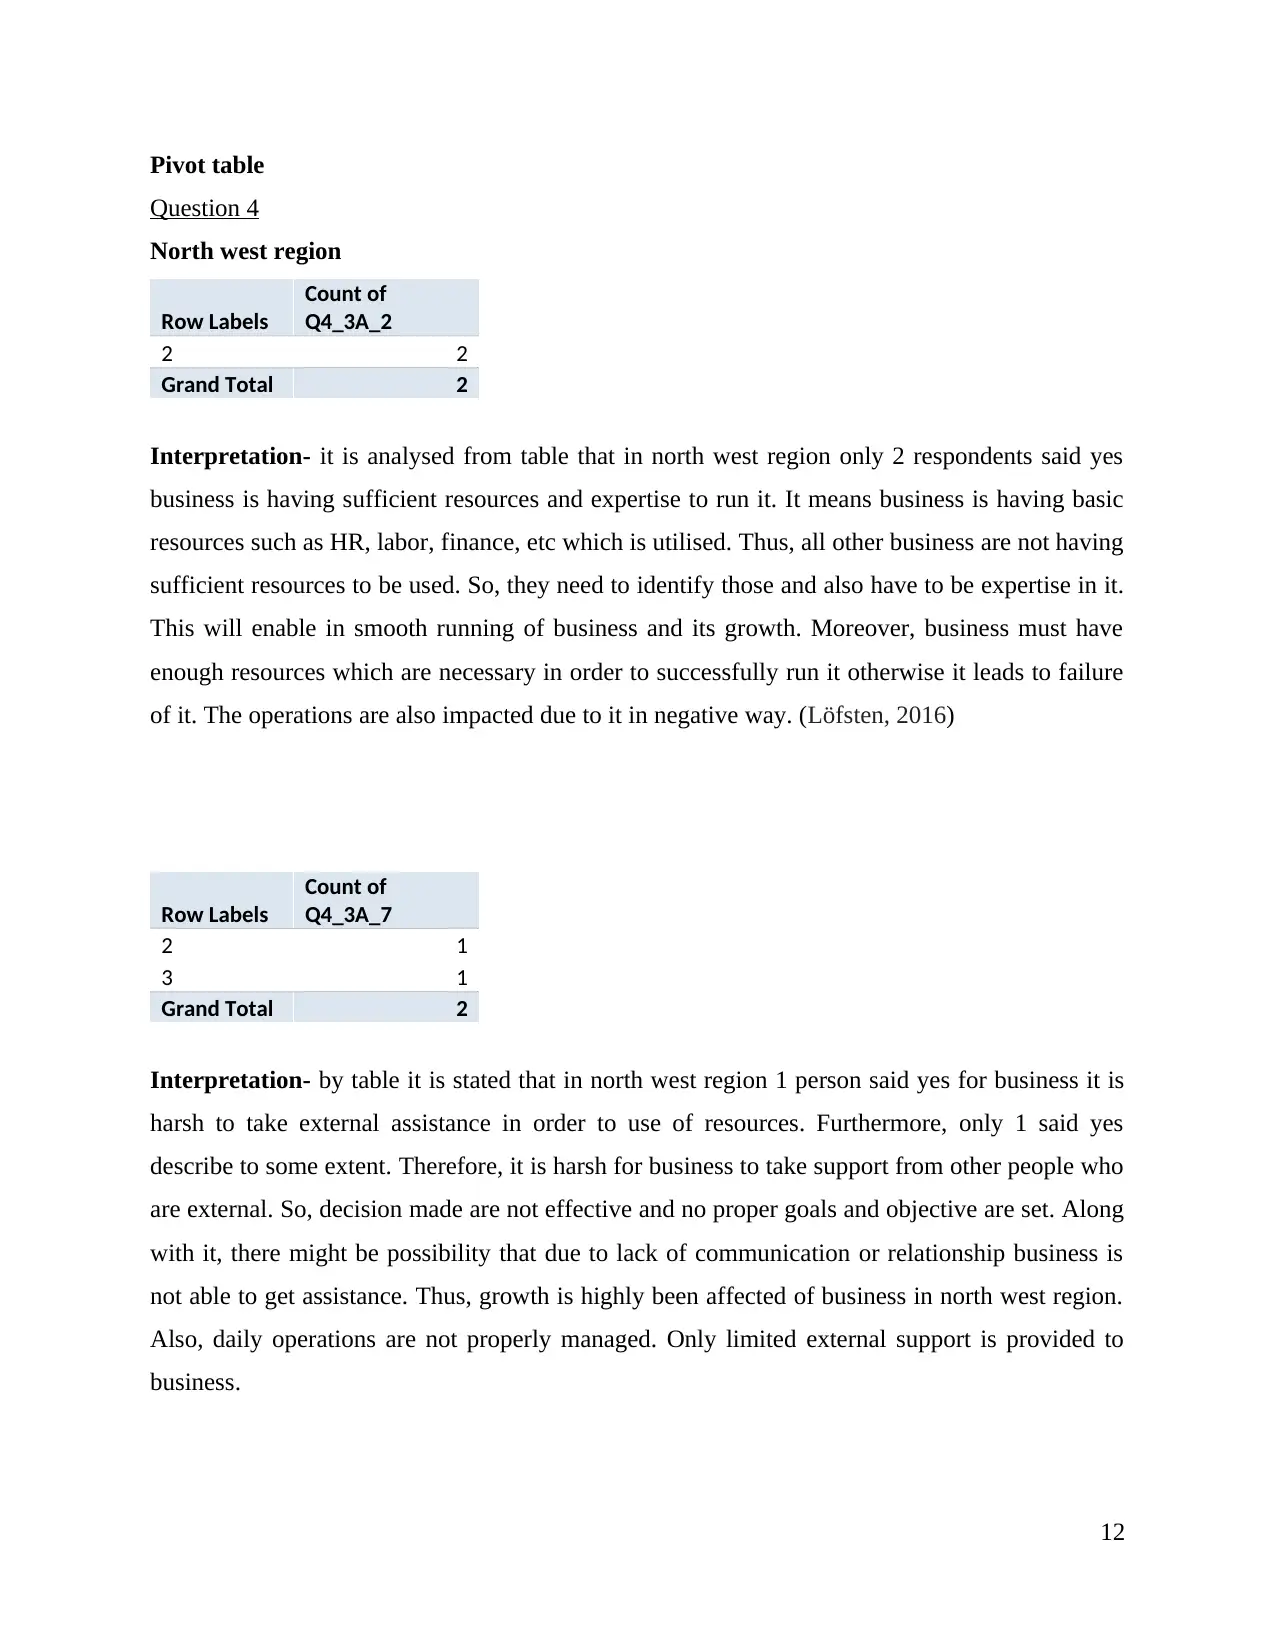
This report presents a data analysis of business practices, focusing on the South East and North West regions. The analysis utilizes pivot tables to examine various aspects, including the utilization of internal resources, factors influencing business growth (such as profits, market share, and diversification), and preferences regarding partnerships and the role of women in leadership. The report analyzes respondent data, providing interpretations of the findings and drawing conclusions about the factors driving business decisions and regional differences. Specifically, the South East region analysis reveals insights into resource availability, the importance of profits and market share, and preferences for the number of partners. The North West region analysis provides insights into the same factors, highlighting regional variations and the impact of different variables on business performance.

USING DATA TO BUILD
BUSINESS PRACTICE
BUSINESS PRACTICE
Paraphrase This Document
Need a fresh take? Get an instant paraphrase of this document with our AI Paraphraser

TABLE OF CONTENTS
Pivot table formulation and analysis for the South East Region.................................................3
Question 4..................................................................................................................................12
Question5..................................................................................................................................13
Question 6..................................................................................................................................15
REFERENCES..............................................................................................................................17

Pivot table formulation and analysis for the South East Region
Question 4
Q4_3A_2
Row Labels
Count of
Q4_3A_2
Percentage
Yes, definitely describes 11 55%
Yes, describes to some
extent 5 25%
No, does not describe 4 20%
(blank)
Grand Total 20
Interpretation: The question basically addresses the efficiency and reliability of the internal
resources that were available in the company and the manner in which they can be utilised
sufficiently to complete the different organisational functions. The chart above clearly depicts
that the majority of the respondent in the South East region stated that they had adequately
availability of the internal resources and this was the basic reason why they did not took
assistance from the external business resources (Ransbotham and et.al., 2017). It was
additionally concluded that there were 25% of respondents who agreed that this was true but
only to an extent i.e. the availability internal resources was only a part of reason why the
businesses are not taking external support. There were 20% who said that this is not the exact
3
⊘ This is a preview!⊘
Do you want full access?
Subscribe today to unlock all pages.

Trusted by 1+ million students worldwide

reason and none of them said that they were not aware of the reason why they did not seek help
from external sources.
Q4_3A_7
Row Labels
Count of
Q4_3A_7
Percentage
Yes, definitely describes 6 30%
Yes, describes to some
extent 6 30%
No, does not describe 8 40%
(blank)
Grand Total 20
Interpretation: The chart above depicts that the total number of respondent in the south east
region who agreed that the reason that they did not seek external advice was not due to the
unavailability of adequate time constitute the major ratio of 40%. However, almost equivalent
percentage of respondents i.e. 30% and 30% agreed that the lack of time was the major resins for
them to not seek the external services and another 30% agreed that the lack of time was a reason
but only to an extent i.e. they did not completely assume that this was the sole reason (Grover
and et.al., 2018).
Q4_3A_12
4
Paraphrase This Document
Need a fresh take? Get an instant paraphrase of this document with our AI Paraphraser

Row Labels
Count of
Q4_3A_12
Percentage
No other reasons 20 100%
(blank)
Grand Total 20
1; No other
reasons; 20
No other reasons
No other reasons
Interpretation: The chart above clearly depicts that the complete population i.e. all 20 of the
respondents who were selected for the purpose of research agreed that the reasons that have been
accumulated and analysed in the research above. There were no remaining reasons for
incorporating any more factors. The respondents form the south east region found that the
reasons that have been included are adequate and multi faceted addressing all the potential
aspects that can occur in a research (Ghauri, Grønhaug and Strange, 2020). Therefore this chart
shows that the research undertaken was extremely comprehensive and ensured that all the
possible factors are taken under purview of analysis while conducting the research.
Question 5
Q5_2B
Row Labels Count of Q5_2B Percentage
Profits 66 100%
(blank)
Grand Total 66
5

1; Profits; 66; 100%
Profits
1
Interpretation: The entire population of south east region represented by their respondents
agrees that the decision of growing their business and further expanding on it is related to the
profits that their business is earning. 100% of the respondents i.e. all 66 of them agreed that
profits was the major objective that they had behind the development and overall growth of the
business (Kowalkowski, Gebauer and Oliva, 2017). It was further stated that this is a justifiable
graph as it shows that the profit is the very reasons with which every business operates and hence
it is necessary to incorporate this factors as a major factor behind growth of business.
Q5_2C
Row Labels
Count of
Q5_2C
Percentage
Market Share 23 100%
(blank)
Grand Total 23
6
⊘ This is a preview!⊘
Do you want full access?
Subscribe today to unlock all pages.

Trusted by 1+ million students worldwide

1; Market Share;
23
Market Share
Market Share
Interpretation: The chart above again depicts the 100% agreeableness that exists amongst the
respondents of the south east region where all of them collectively stated that the market share is
the major reason or measures on the basis of which they think about expansions and growth of
the business collectively (Akcigit and Kerr, 2018). This helps in ascertaining that the majority of
the respondents of the south east region find that the best way to decide the growth and
expansion of the business and take decisions accordingly is by evaluating the market share that
the company has been able to capture in their company.
Q5_2G
Row Labels
Count of
Q5_2G
Percentage
Diversify / new
products / range /
services 1
100%
(blank)
Grand Total 1
7
Paraphrase This Document
Need a fresh take? Get an instant paraphrase of this document with our AI Paraphraser

Interpretation: In the pie chart above, it can be ascertained that all the respondents of the south
east region have responded that the sole basis which they consider before taking the growth
decisions of the business is based on the diversifications that the company have entered into, the
new products that have been launched by the company, the wider or limited range of products
that they are selling and the services that are provided by them (Löfsten, 2016). The
organisations analyse the further potential for growth using these indicators and then collectively
takes the decision related to it. This helps in formulating growth strategies on reasonable and
practical ground.
Q5_2I
Row Labels Count of Q5_2I Percentage
(blank) 0%
Grand Total
Interpretation: Since there was no data available regarding the respondents who were include in
the research, no significant interpretation can be made regarding the viability of growth as a
factor. Therefore, there was nil number i.e. not a single respondents who thought that the growth
of the business is a relevant feature that can be used for the purpose of taking decisions related to
the growth and expansion of the business (Lee and Shin, 2018).
Question 6
Q6_3
8

Row Labels
Count of
Q6_3
Percentage
1 70 32%
2 102 46%
3 26 12%
4 10 5%
5 4 2%
6 2 1%
15 1 0%
997 7 3%
Grand Total 222
Interpretation: The south east region respondents were asked that what the maximum number of
partners that they think is should be kept in an organisation in order to develop better
organisation and management (Tejedo-Romero, Rodrigues and Craig, 2017). Most of the
respondents said that the maximum limit of directors should be 2 followed by people voting for 1
director and the least chosen number was 15 as number of directors where almost 0% of
respondents i.e. just 2 out of 222 stated that this should be the selected number.
Q6_4
Row Labels Count of Q6_4 Percentage
0 103 46%
9
⊘ This is a preview!⊘
Do you want full access?
Subscribe today to unlock all pages.

Trusted by 1+ million students worldwide

1 102 46%
2 8 4%
3 3 1%
997 6 3%
Grand Total 222
1; Series1; 1032; Series1; 102
3; Series1; 84; Series1; 35; Series1; 6
Series1
Interpretation: When the respondents selected for the south east region were questioned that
what according to them is the maximum number of women partners that they would employ in
their organisation, majority of them i.e. 103 out of total 222 respondents said that they would
select only 1womn partner (Byron. and Post, 2016). This was however closely followed by the
102 respondents who said they would prefer 2 women partners in their business and lastly, there
were only 3 out of 222 respondents who said that 4 number of women partner is the optimum
number.
Q6_5
Row Labels
Count of
Q6_5
Percentage
Yes 50 23%
No 166 75%
Don’t Know 6 3%
Grand Total 222
10
Paraphrase This Document
Need a fresh take? Get an instant paraphrase of this document with our AI Paraphraser

Yes; Series1;
50; 23%
No; Series1; 166;
75%
Don’t Know; Series1; 6; 3%
Yes
No
Don’t Know
Interpretation: The chart above clearly shows that the south east region respondents on being
asked that whether it would be justifiable if 50% of their business is owned and managed by the
women partners, the 75% of them declined saying no they don’t agree to this. This was following
by 22% of them saying yes and 3% of them saying no. Therefore it can be said that the voting in
favour of women is comparatively lower and this shows that the south east region people are not
very supportive regarding women leading in business (Mukarram Ajmal and Saeed, 2018).
11

Pivot table
Question 4
North west region
Row Labels
Count of
Q4_3A_2
2 2
Grand Total 2
Interpretation- it is analysed from table that in north west region only 2 respondents said yes
business is having sufficient resources and expertise to run it. It means business is having basic
resources such as HR, labor, finance, etc which is utilised. Thus, all other business are not having
sufficient resources to be used. So, they need to identify those and also have to be expertise in it.
This will enable in smooth running of business and its growth. Moreover, business must have
enough resources which are necessary in order to successfully run it otherwise it leads to failure
of it. The operations are also impacted due to it in negative way. (Löfsten, 2016)
Row Labels
Count of
Q4_3A_7
2 1
3 1
Grand Total 2
Interpretation- by table it is stated that in north west region 1 person said yes for business it is
harsh to take external assistance in order to use of resources. Furthermore, only 1 said yes
describe to some extent. Therefore, it is harsh for business to take support from other people who
are external. So, decision made are not effective and no proper goals and objective are set. Along
with it, there might be possibility that due to lack of communication or relationship business is
not able to get assistance. Thus, growth is highly been affected of business in north west region.
Also, daily operations are not properly managed. Only limited external support is provided to
business.
12
⊘ This is a preview!⊘
Do you want full access?
Subscribe today to unlock all pages.

Trusted by 1+ million students worldwide
1 out of 18
Related Documents
Your All-in-One AI-Powered Toolkit for Academic Success.
+13062052269
info@desklib.com
Available 24*7 on WhatsApp / Email
Unlock your academic potential
Copyright © 2020–2026 A2Z Services. All Rights Reserved. Developed and managed by ZUCOL.


