Report on Flowchart Diagram Analysis: Business Process Optimization

Verified

Added on  2022/08/27

|7
|771
|30
Report
AI Summary
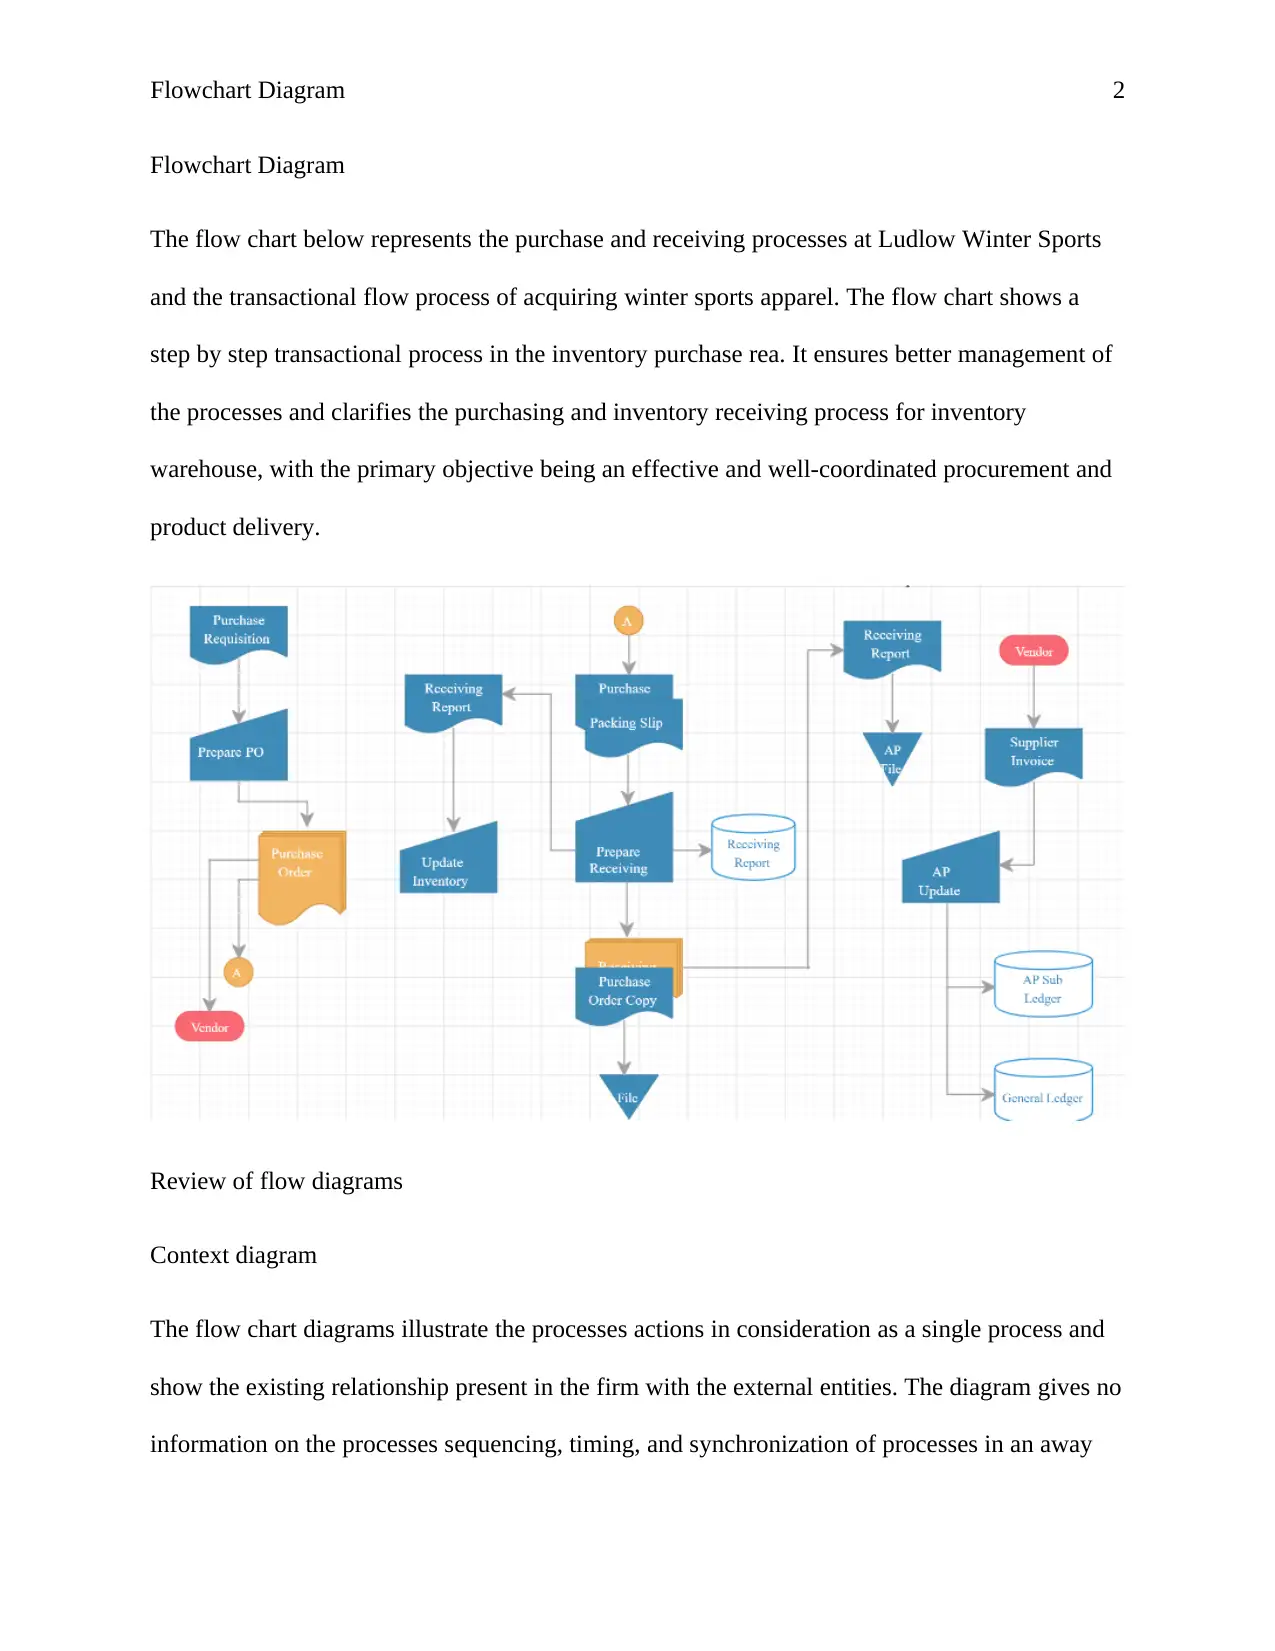
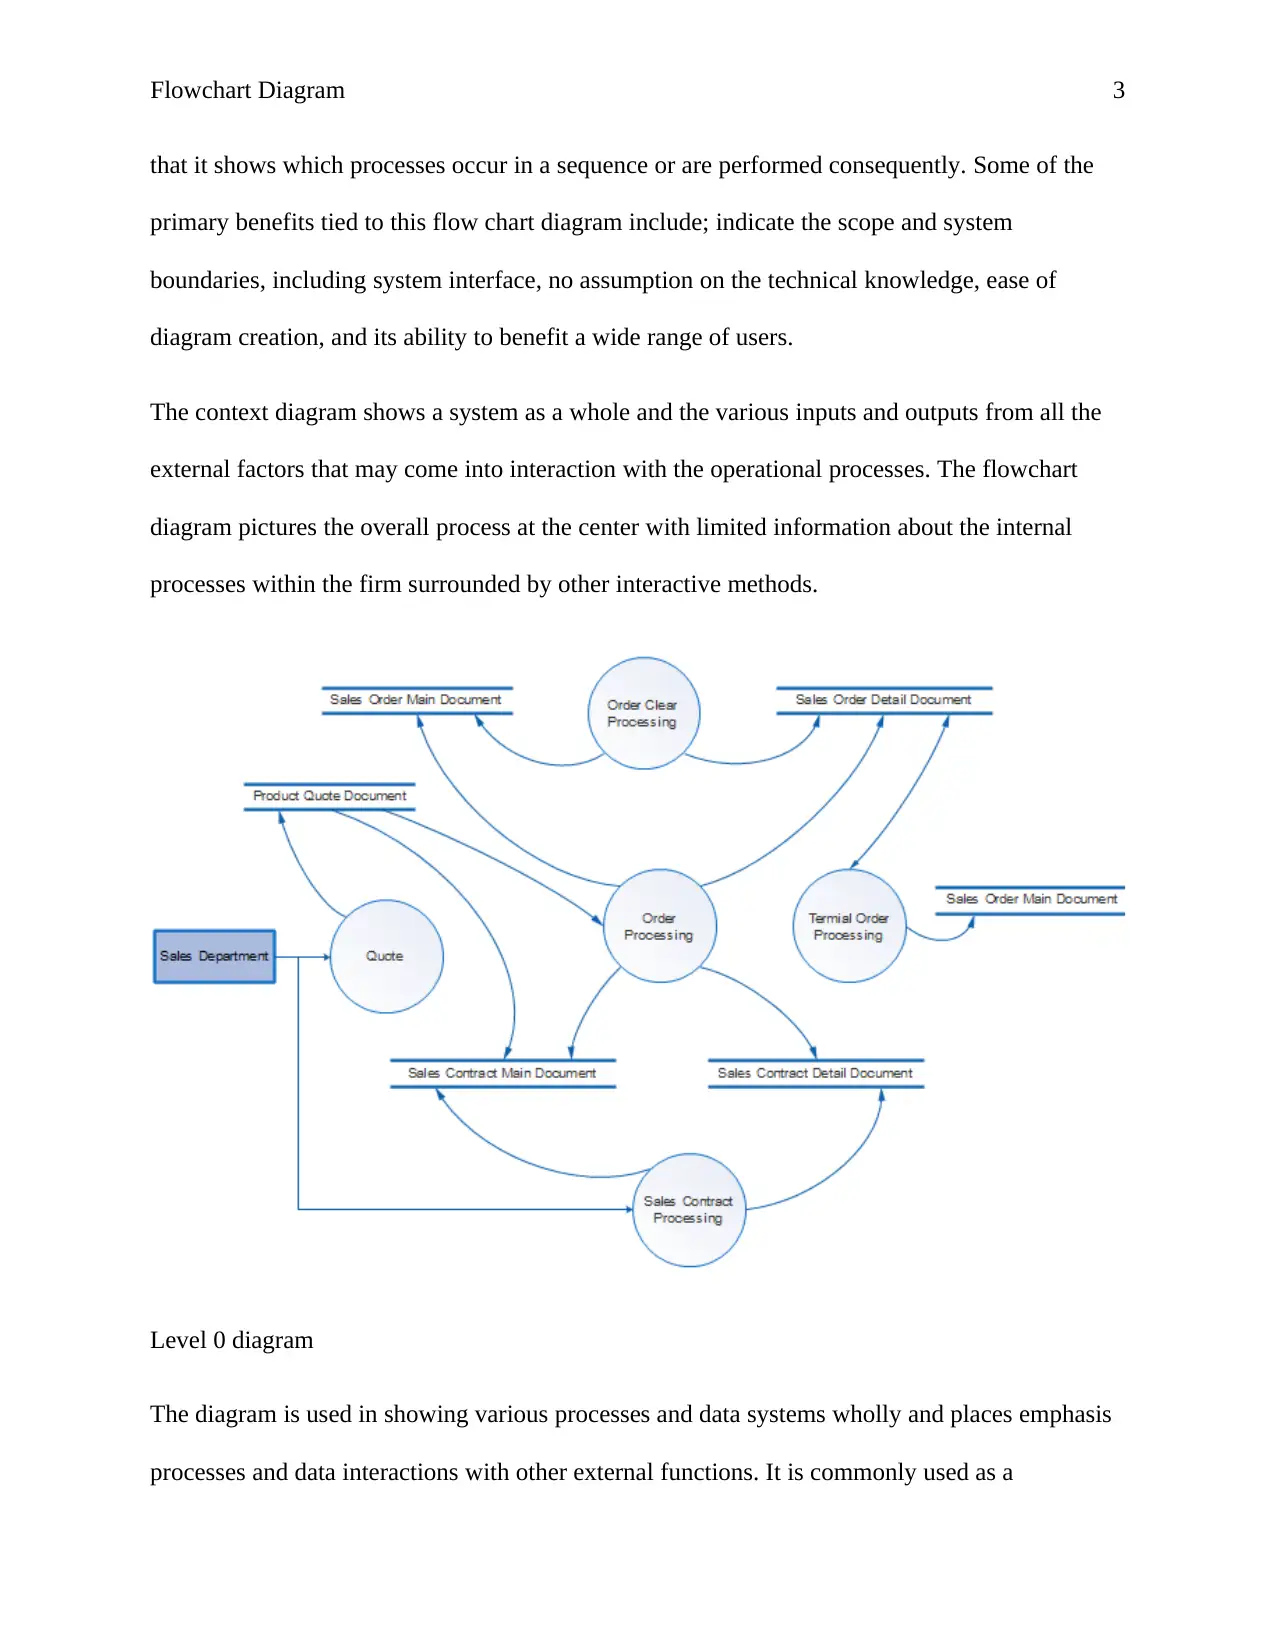
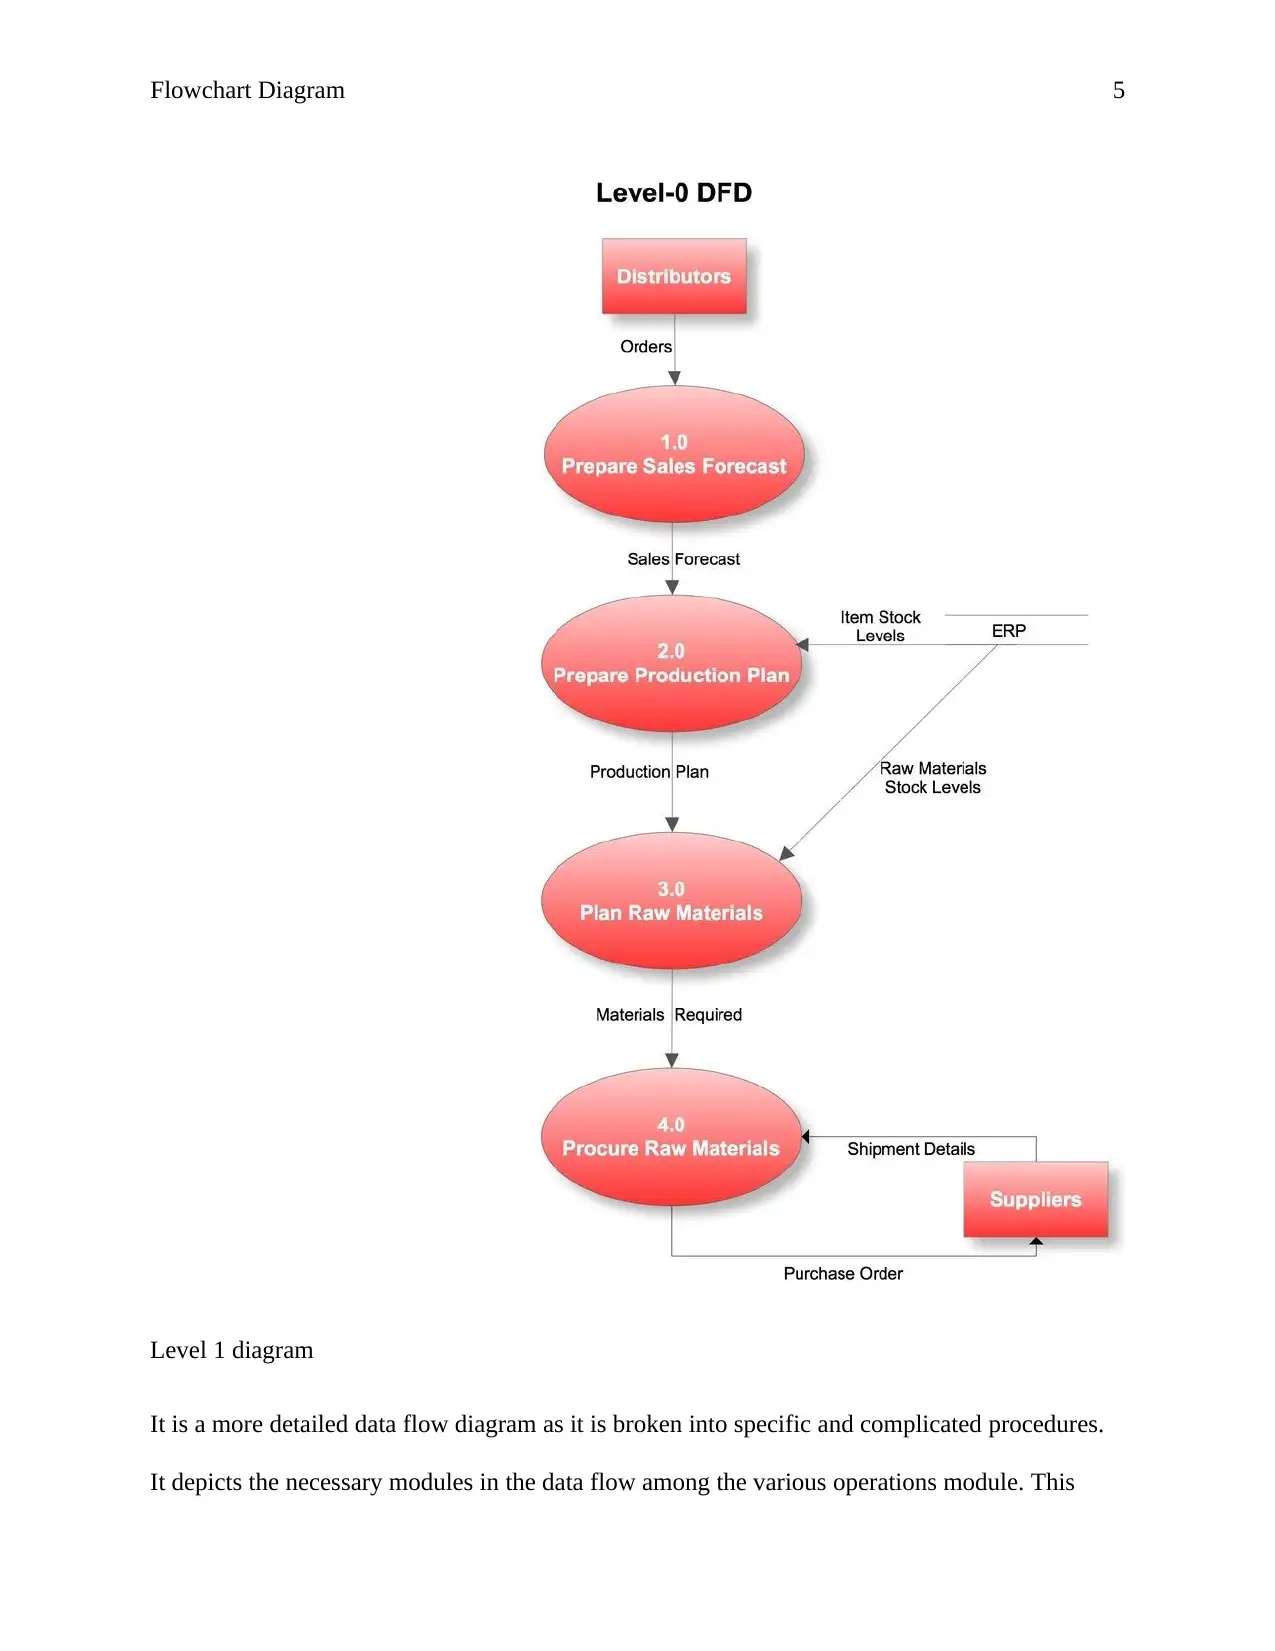
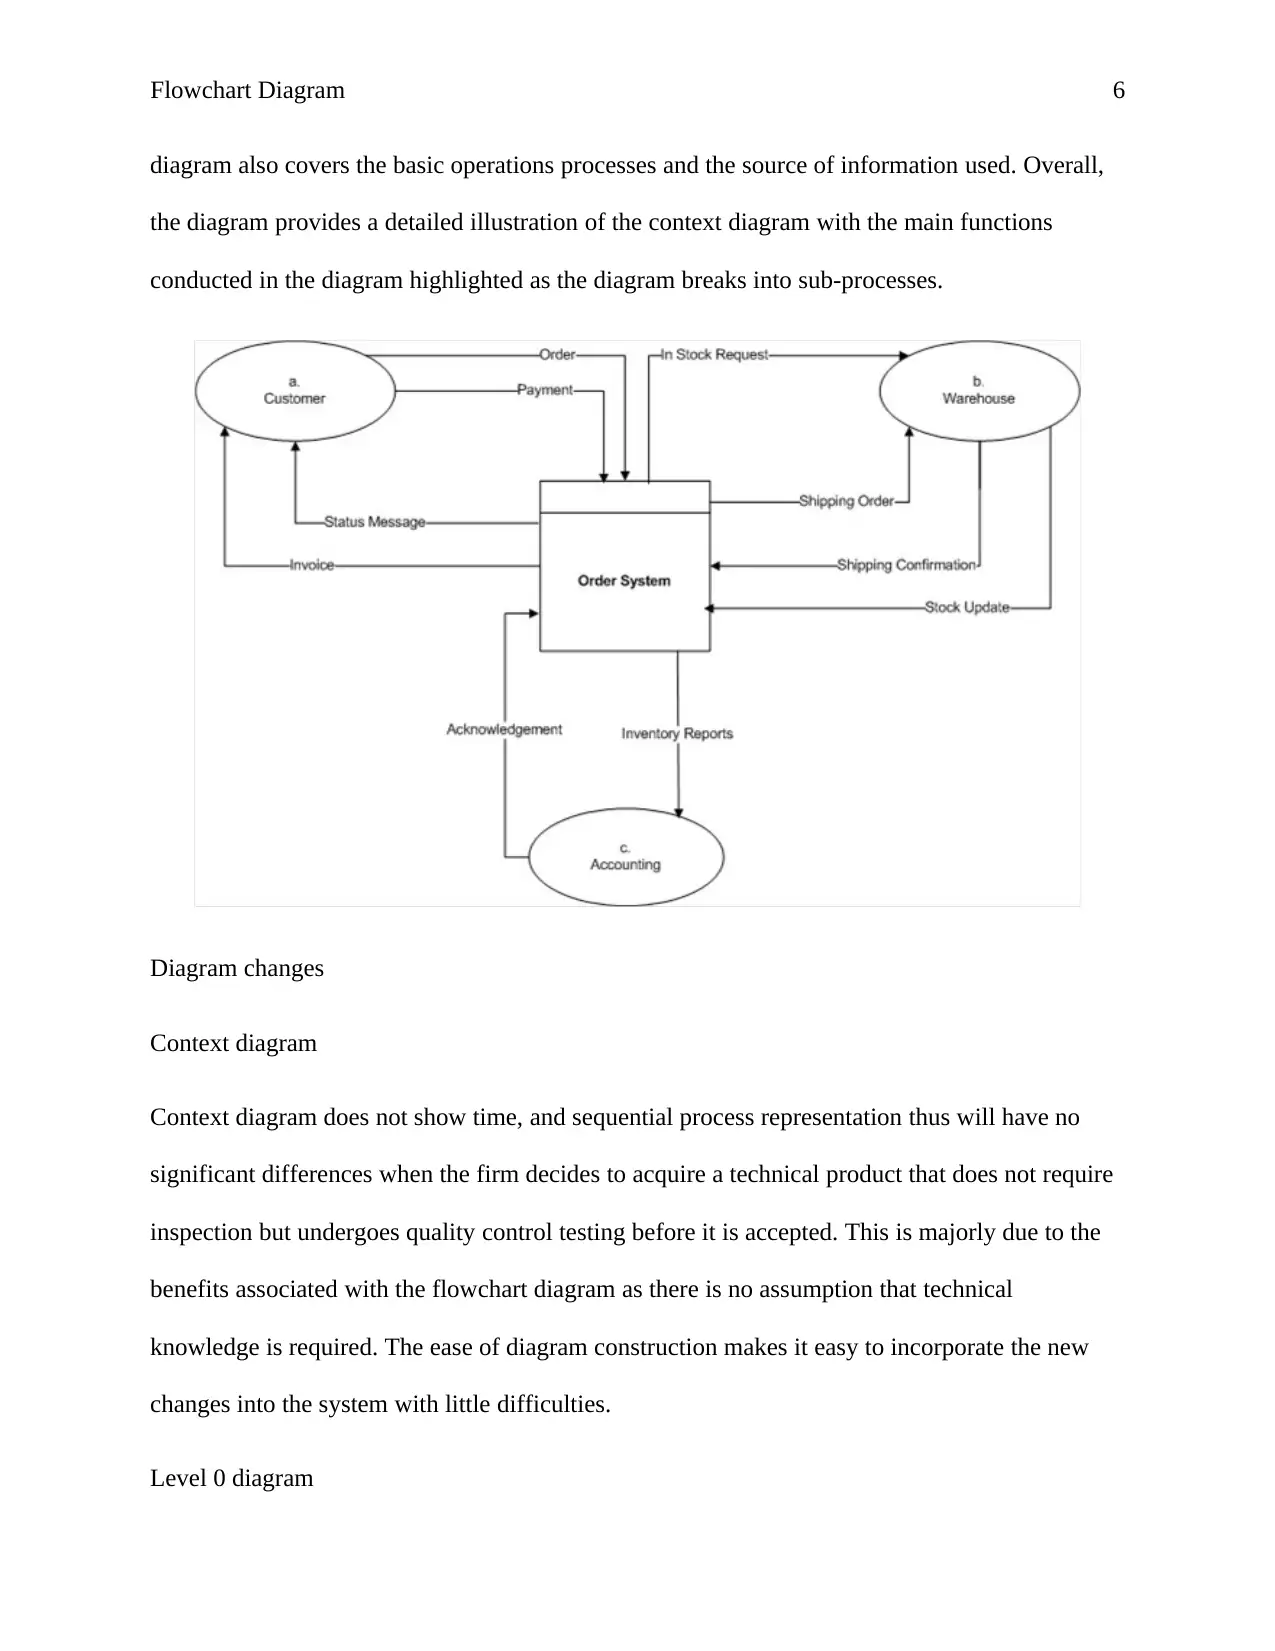
This report analyzes flowchart diagrams illustrating the purchase and receiving processes at Ludlow Winter Sports, focusing on the transactional flow of acquiring winter sports apparel. It details the step-by-step inventory purchase process, aiming for effective procurement and product delivery. The report reviews context, level 0, and level 1 diagrams, highlighting their uses and benefits, such as indicating system scope and boundaries, ease of creation, and providing a visual overview of processes. It examines how the diagrams would change with the acquisition of a technical product, considering the need for quality control and adjustments in the diagrams to reflect new processes. The analysis emphasizes the importance of understanding the impact of changes on the diagrams and the need for detailed analysis, especially in the level 1 flowchart diagram, to incorporate new procedures and information accurately.
Document Page
Flowchart Diagram 1
Student’s Name
Institutional Affiliation
Professor
Date
tabler-icon-diamond-filled.svg

Secure Best Marks with AI Grader

Need help grading? Try our AI Grader for instant feedback on your assignments.
Document Page
Flowchart Diagram 2
Flowchart Diagram
The flow chart below represents the purchase and receiving processes at Ludlow Winter Sports
and the transactional flow process of acquiring winter sports apparel. The flow chart shows a
step by step transactional process in the inventory purchase rea. It ensures better management of
the processes and clarifies the purchasing and inventory receiving process for inventory
warehouse, with the primary objective being an effective and well-coordinated procurement and
product delivery.
Review of flow diagrams
Context diagram
The flow chart diagrams illustrate the processes actions in consideration as a single process and
show the existing relationship present in the firm with the external entities. The diagram gives no
information on the processes sequencing, timing, and synchronization of processes in an away
Document Page
Flowchart Diagram 3
that it shows which processes occur in a sequence or are performed consequently. Some of the
primary benefits tied to this flow chart diagram include; indicate the scope and system
boundaries, including system interface, no assumption on the technical knowledge, ease of
diagram creation, and its ability to benefit a wide range of users.
The context diagram shows a system as a whole and the various inputs and outputs from all the
external factors that may come into interaction with the operational processes. The flowchart
diagram pictures the overall process at the center with limited information about the internal
processes within the firm surrounded by other interactive methods.
Level 0 diagram
The diagram is used in showing various processes and data systems wholly and places emphasis
processes and data interactions with other external functions. It is commonly used as a
Document Page
Flowchart Diagram 4
preliminary step in creating a system processes overview without going into the process details.
However, the users of the diagram need prior briefing in all the stages involved in the diagram.
With the level 0 diagram, users can predict the way the processes will unfold and how the system
will be achieved. The diagram majorly functions as at a glance view of all the processes involved
in an operation.
tabler-icon-diamond-filled.svg

Secure Best Marks with AI Grader

Need help grading? Try our AI Grader for instant feedback on your assignments.
Document Page
Flowchart Diagram 5
Level 1 diagram
It is a more detailed data flow diagram as it is broken into specific and complicated procedures.
It depicts the necessary modules in the data flow among the various operations module. This
Document Page
Flowchart Diagram 6
diagram also covers the basic operations processes and the source of information used. Overall,
the diagram provides a detailed illustration of the context diagram with the main functions
conducted in the diagram highlighted as the diagram breaks into sub-processes.
Diagram changes
Context diagram
Context diagram does not show time, and sequential process representation thus will have no
significant differences when the firm decides to acquire a technical product that does not require
inspection but undergoes quality control testing before it is accepted. This is majorly due to the
benefits associated with the flowchart diagram as there is no assumption that technical
knowledge is required. The ease of diagram construction makes it easy to incorporate the new
changes into the system with little difficulties.
Level 0 diagram
Document Page
Flowchart Diagram 7
The flowchart is used in showing the full representation of processes and their interaction with
other external factors. Purchasing a technical product that does not require inspection in the
receiving department of the firm will technically not change the whole program as the entire
process of product acquisition will be illustrated in the diagram with no changes experienced on
its overall interface. The new changes can be incorporated as a new function in the diagram.
However, the inspection department and other concerned parties in the acquisition process of the
technical product will have to be briefed on the new additions to the flow chart diagram.
Level 1 flowchart diagram
It is the most detailed flow chart diagram of the three diagrams. Thus, it will experience
significant changes with the acquisition of a product that will interrupt the normal operations and
processes in the firm. The introduction of a product that will disrupt the routine procedures will
require the inclusion of detail analysis of the product into the flowchart diagram covering the
details of the process and the information of the methods the product was acquired. The new
modified diagram will indicate the subprocess required in putting the new product through
quality control testing before acceptance. This will include requests for the quality control
process and the need to overtake the inspection process of the product.
chevron_up_icon
1 out of 7
circle_padding
hide_on_mobile
zoom_out_icon
logo.png

Your All-in-One AI-Powered Toolkit for Academic Success.

Available 24*7 on WhatsApp / Email

[object Object]