Business Process Management: Comparing BPR and BPM Analysis Report
VerifiedAdded on 2022/11/17
|12
|946
|80
Report
AI Summary
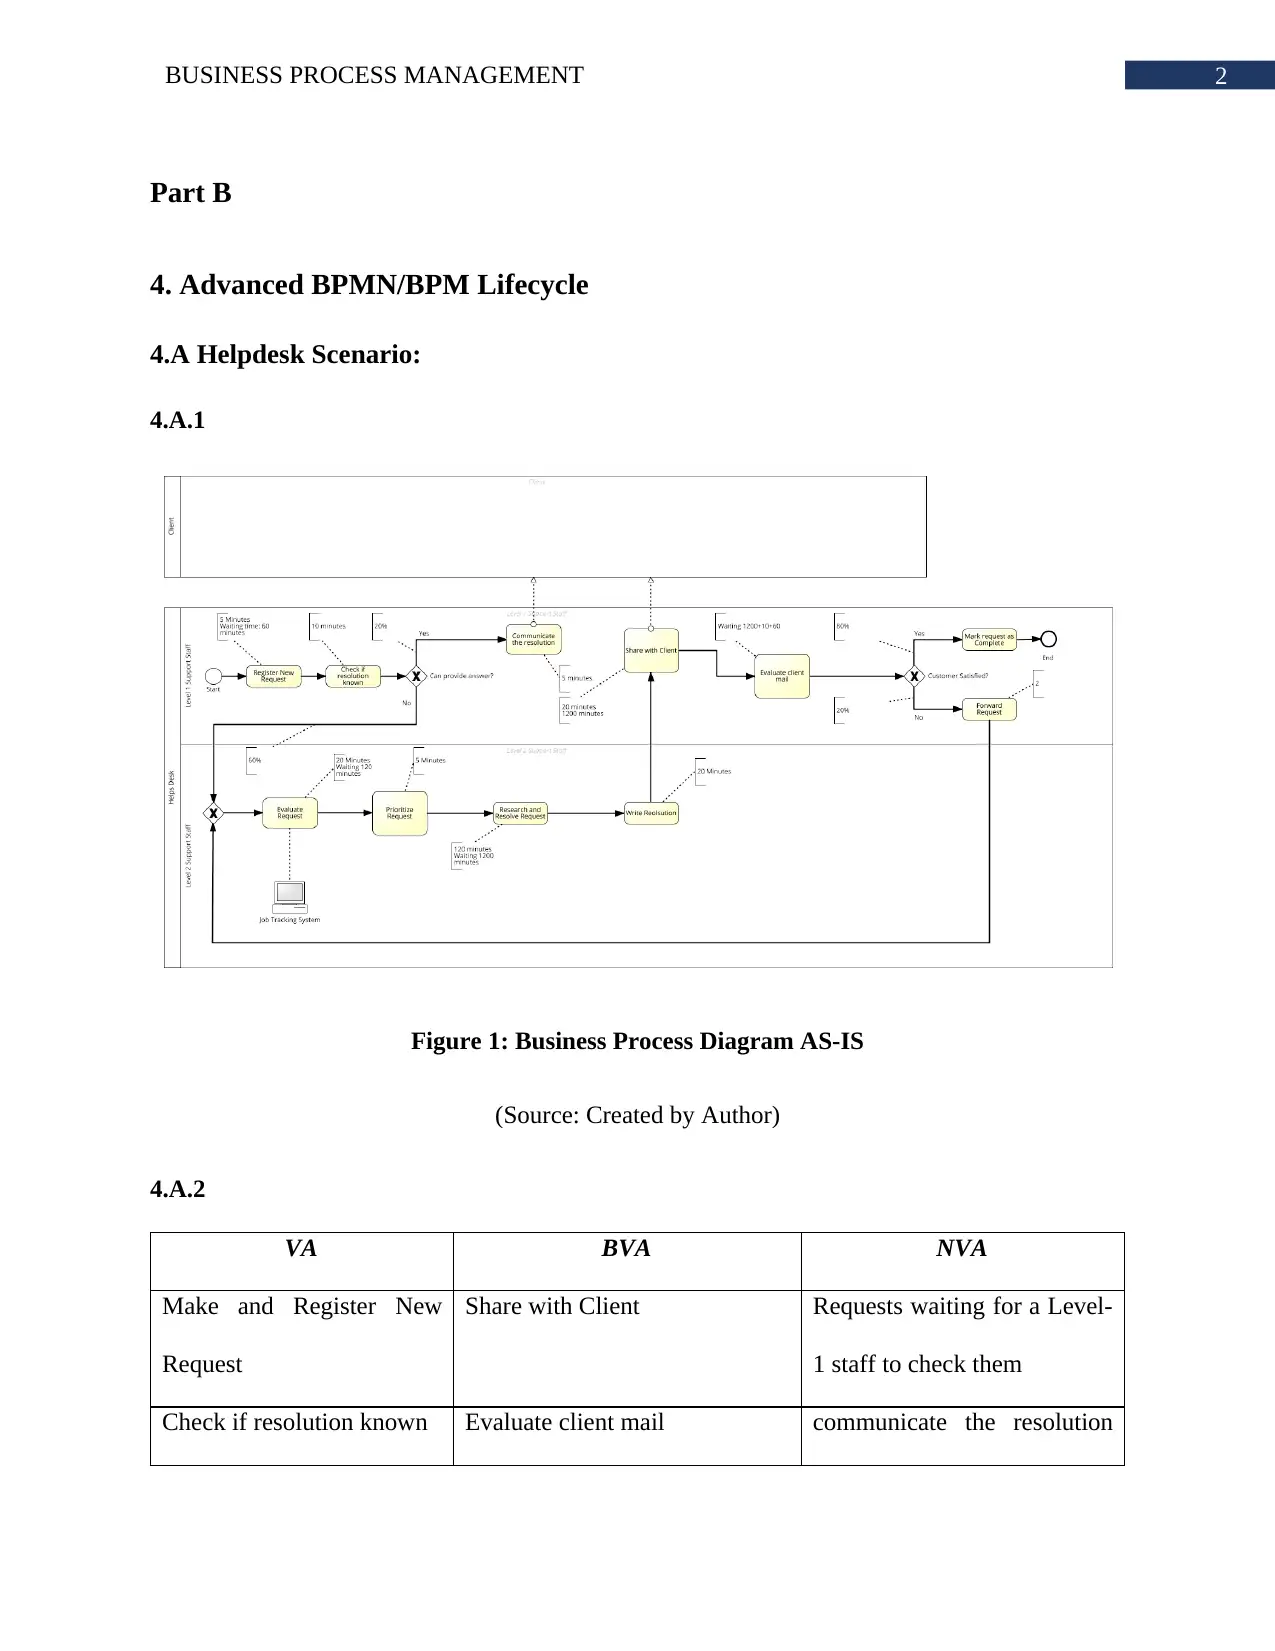
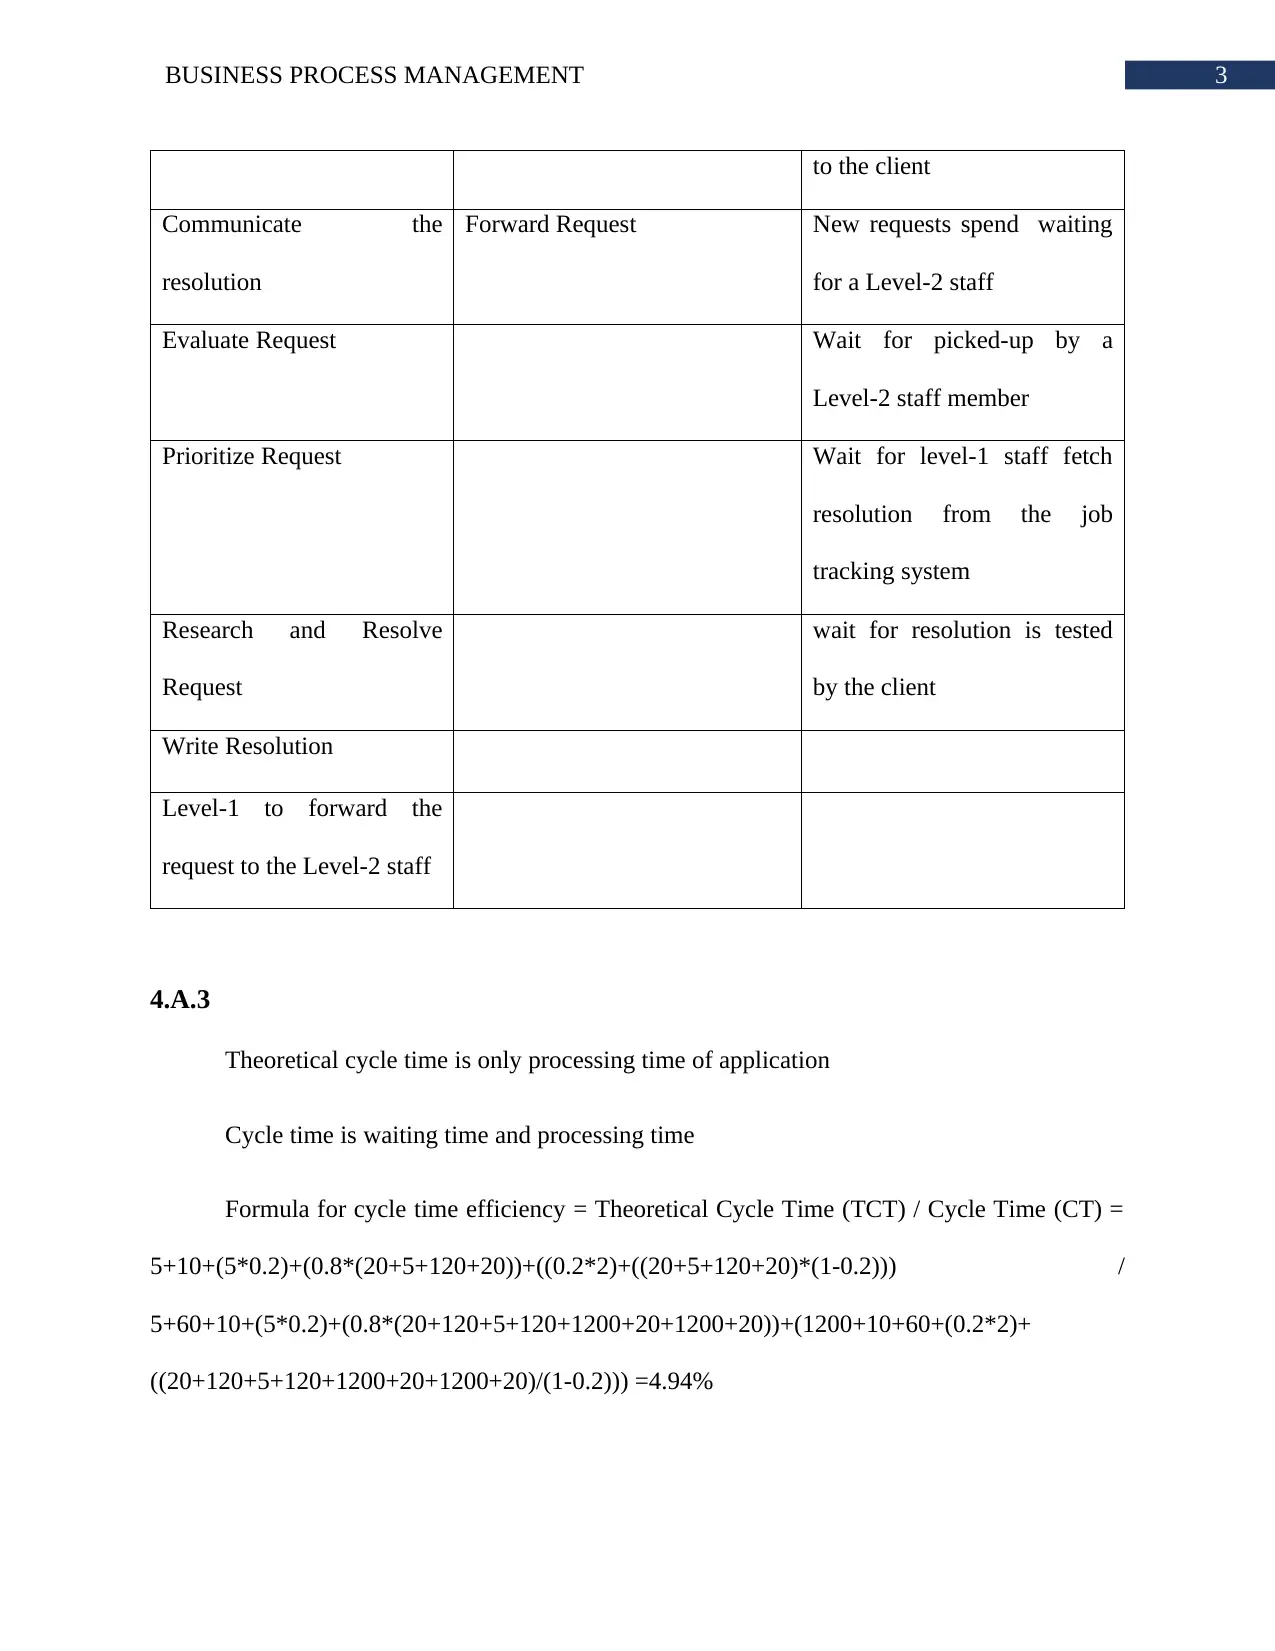
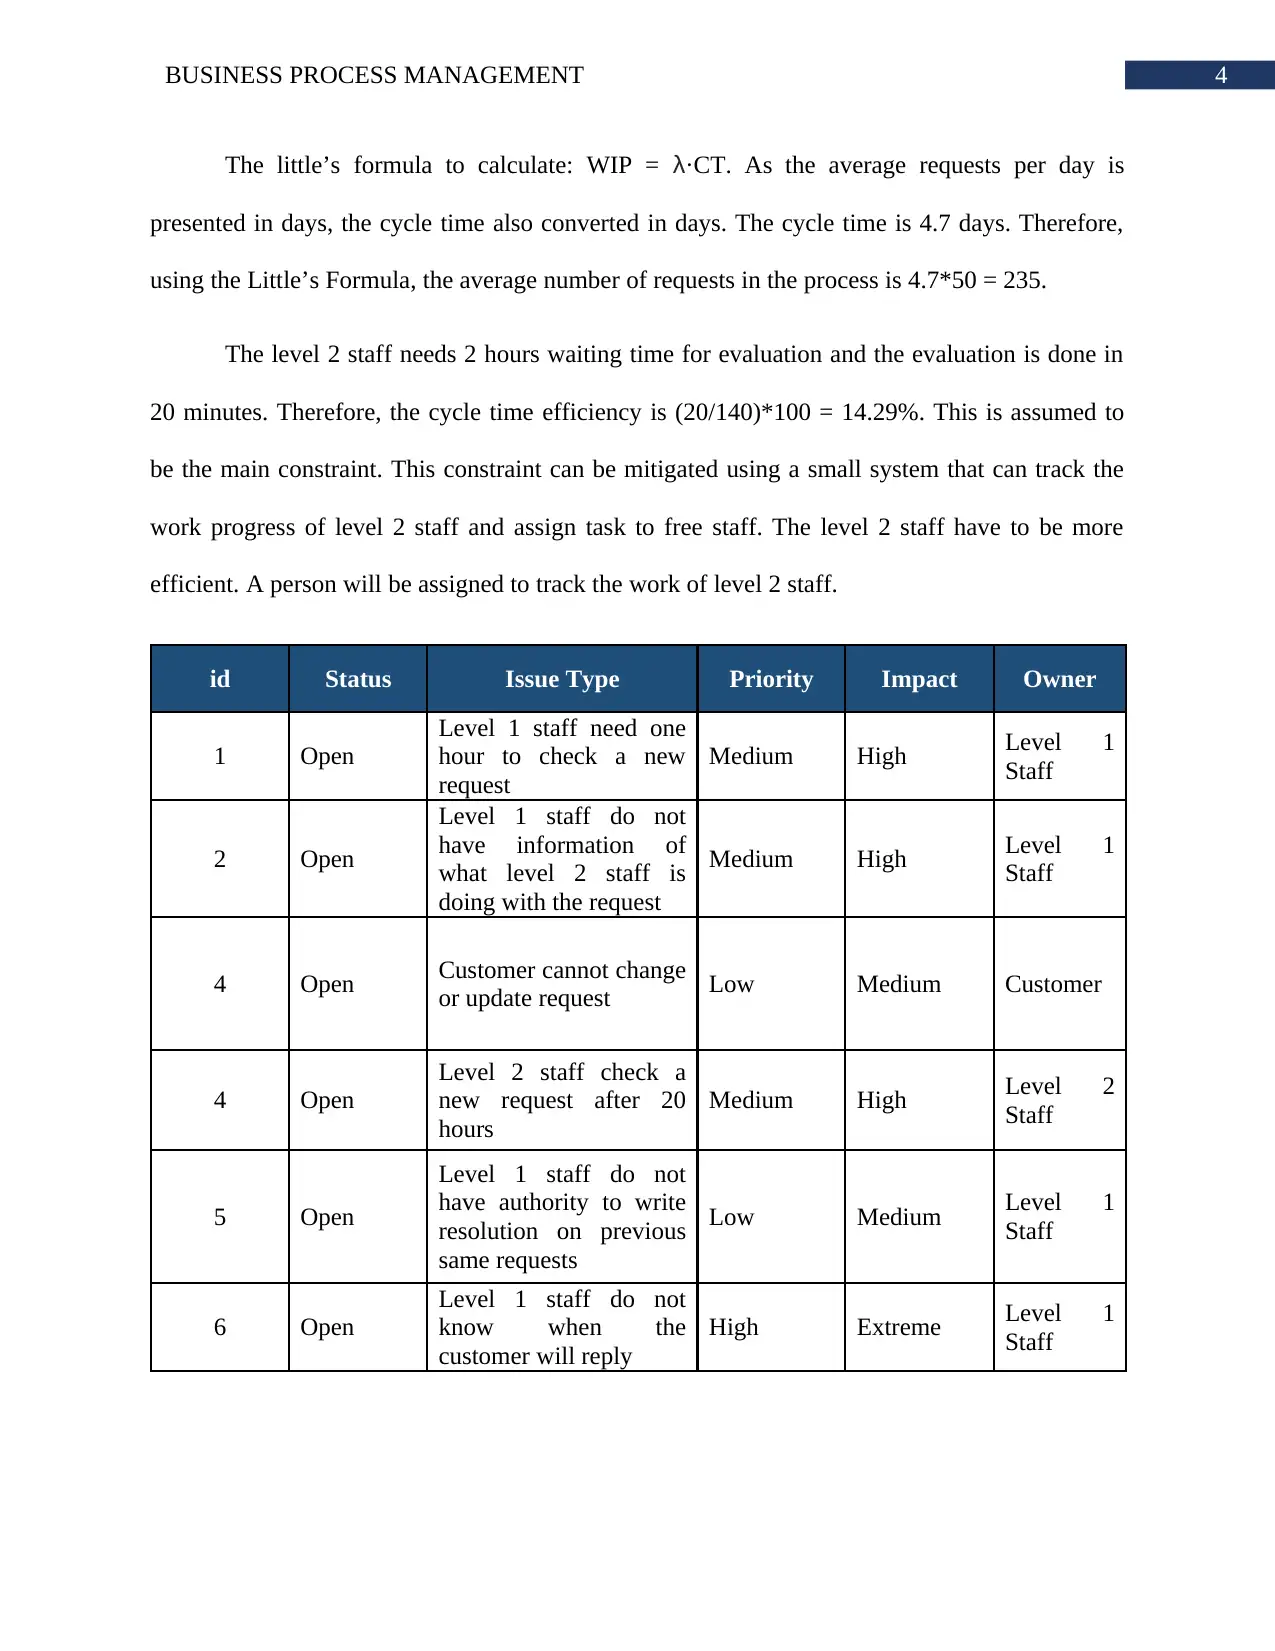
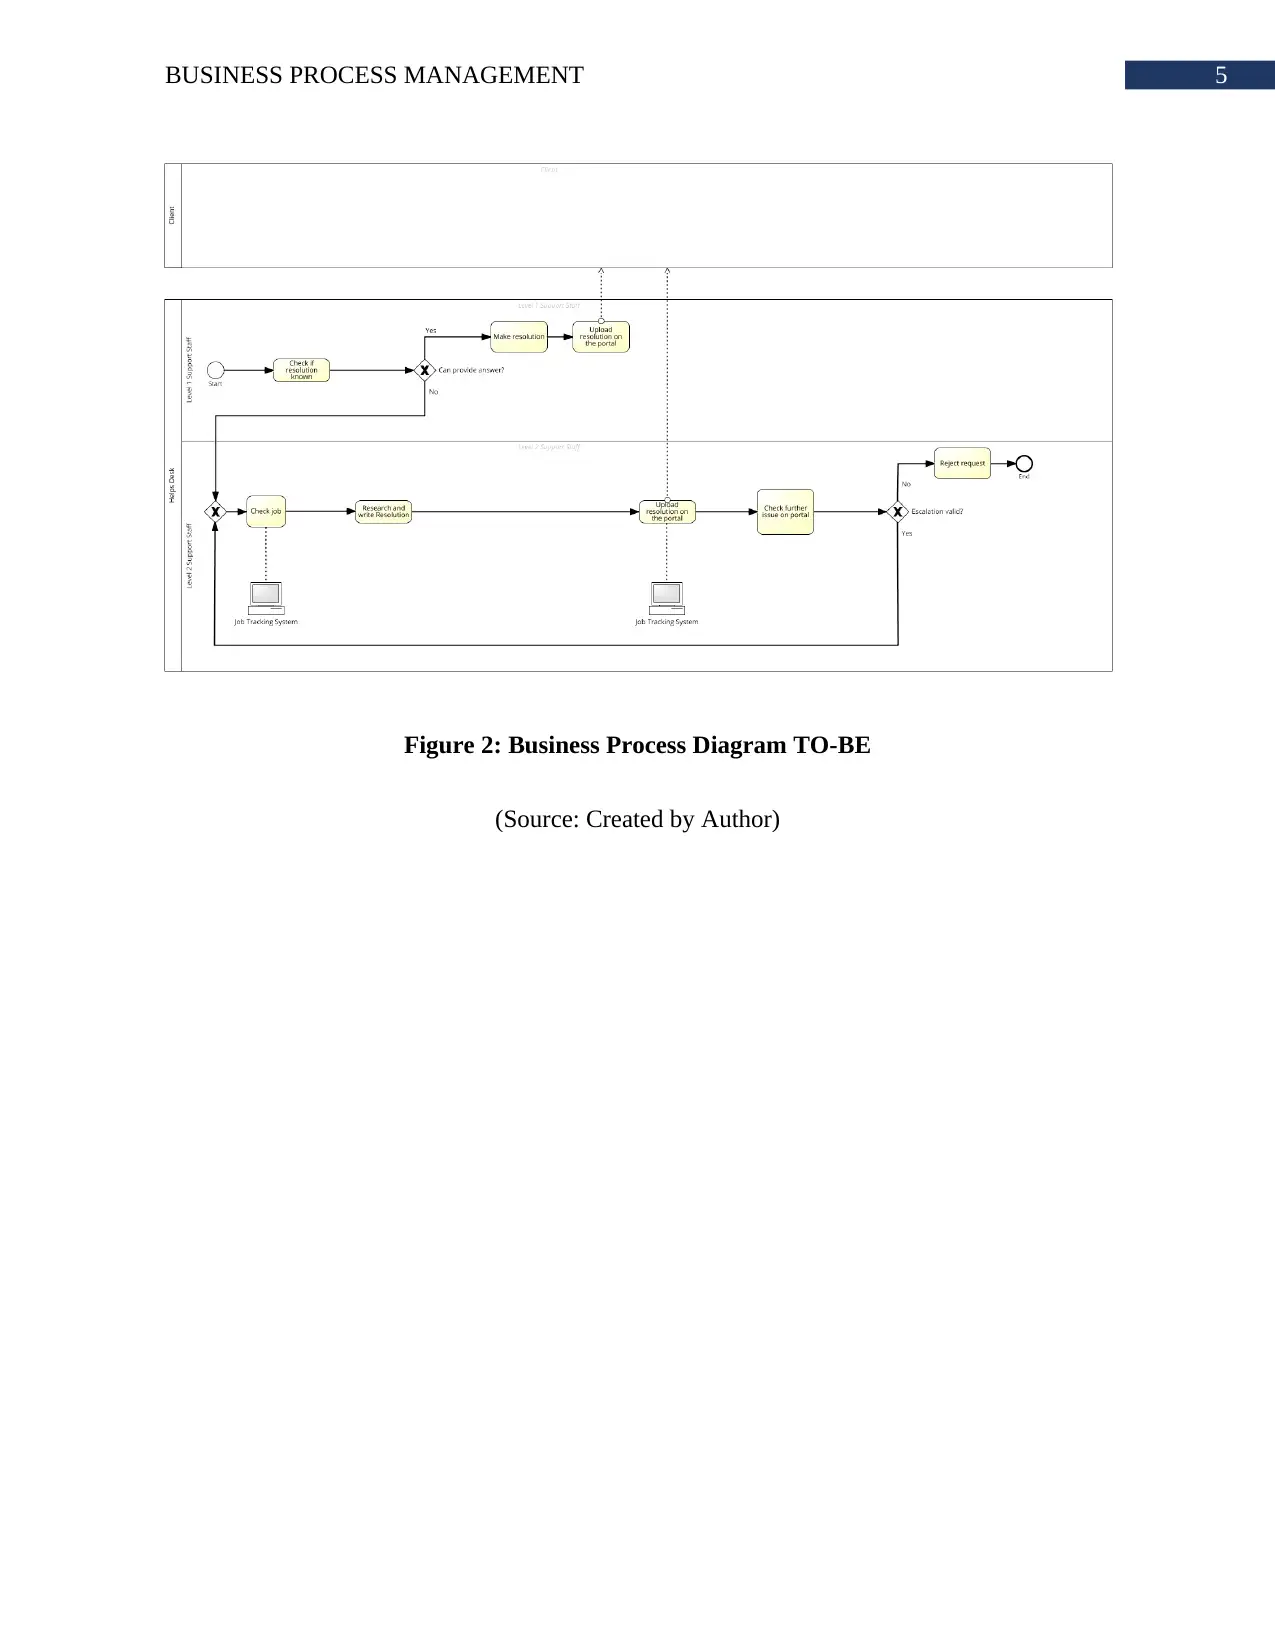
This report analyzes Business Process Management (BPM) and compares it with Business Process Reengineering (BPR), addressing their benefits, shortcomings, and integration within a continuous improvement methodology. The report includes a detailed exploration of BPMN, including how to connect pools and elements within a business process diagram (BPD). It presents two real-world scenarios: a Helpdesk scenario and an ABC Insurance scenario, utilizing diagrams such as AS-IS and TO-BE diagrams, value chain diagrams, and fishbone diagrams to illustrate process analysis and improvement strategies. The report also calculates cycle time efficiency using the Little’s formula and identifies constraints, proposing mitigation strategies. The report provides a comprehensive understanding of BPM principles and practical applications. This report is contributed by a student and is published on Desklib, a platform offering AI-based study tools and resources for students.

Running head: BUSINESS PROCESS MANAGEMENT
Business Process Management
Name of the Student
Name of the University
Author’s note:
Business Process Management
Name of the Student
Name of the University
Author’s note:
Paraphrase This Document
Need a fresh take? Get an instant paraphrase of this document with our AI Paraphraser

1BUSINESS PROCESS MANAGEMENT
Table of Contents
Part B...............................................................................................................................................2
4. Advanced BPMN/BPM Lifecycle...............................................................................................2
4.A Helpdesk Scenario:...............................................................................................................2
4.A.1........................................................................................................................................2
4.A.2........................................................................................................................................2
4.A.3............................................................................................................................................3
4.B ABC Insurance Scenario:......................................................................................................6
4.B.1:........................................................................................................................................6
4.B.2:........................................................................................................................................7
4.B.3:........................................................................................................................................8
4.B.4:......................................................................................................................................10
Bibliography:.................................................................................................................................11

2BUSINESS PROCESS MANAGEMENT
Part B
4. Advanced BPMN/BPM Lifecycle
4.A Helpdesk Scenario:
4.A.1
Figure 1: Business Process Diagram AS-IS
(Source: Created by Author)
4.A.2
VA BVA NVA
Make and Register New
Request
Share with Client Requests waiting for a Level-
1 staff to check them
Check if resolution known Evaluate client mail communicate the resolution
⊘ This is a preview!⊘
Do you want full access?
Subscribe today to unlock all pages.

Trusted by 1+ million students worldwide

3BUSINESS PROCESS MANAGEMENT
to the client
Communicate the
resolution
Forward Request New requests spend waiting
for a Level-2 staff
Evaluate Request Wait for picked-up by a
Level-2 staff member
Prioritize Request Wait for level-1 staff fetch
resolution from the job
tracking system
Research and Resolve
Request
wait for resolution is tested
by the client
Write Resolution
Level-1 to forward the
request to the Level-2 staff
4.A.3
Theoretical cycle time is only processing time of application
Cycle time is waiting time and processing time
Formula for cycle time efficiency = Theoretical Cycle Time (TCT) / Cycle Time (CT) =
5+10+(5*0.2)+(0.8*(20+5+120+20))+((0.2*2)+((20+5+120+20)*(1-0.2))) /
5+60+10+(5*0.2)+(0.8*(20+120+5+120+1200+20+1200+20))+(1200+10+60+(0.2*2)+
((20+120+5+120+1200+20+1200+20)/(1-0.2))) =4.94%
Paraphrase This Document
Need a fresh take? Get an instant paraphrase of this document with our AI Paraphraser

4BUSINESS PROCESS MANAGEMENT
The little’s formula to calculate: WIP = λ·CT. As the average requests per day is
presented in days, the cycle time also converted in days. The cycle time is 4.7 days. Therefore,
using the Little’s Formula, the average number of requests in the process is 4.7*50 = 235.
The level 2 staff needs 2 hours waiting time for evaluation and the evaluation is done in
20 minutes. Therefore, the cycle time efficiency is (20/140)*100 = 14.29%. This is assumed to
be the main constraint. This constraint can be mitigated using a small system that can track the
work progress of level 2 staff and assign task to free staff. The level 2 staff have to be more
efficient. A person will be assigned to track the work of level 2 staff.
id Status Issue Type Priority Impact Owner
1 Open
Level 1 staff need one
hour to check a new
request
Medium High Level 1
Staff
2 Open
Level 1 staff do not
have information of
what level 2 staff is
doing with the request
Medium High Level 1
Staff
4 Open Customer cannot change
or update request Low Medium Customer
4 Open
Level 2 staff check a
new request after 20
hours
Medium High Level 2
Staff
5 Open
Level 1 staff do not
have authority to write
resolution on previous
same requests
Low Medium Level 1
Staff
6 Open
Level 1 staff do not
know when the
customer will reply
High Extreme Level 1
Staff

5BUSINESS PROCESS MANAGEMENT
Figure 2: Business Process Diagram TO-BE
(Source: Created by Author)
Figure 2: Business Process Diagram TO-BE
(Source: Created by Author)
⊘ This is a preview!⊘
Do you want full access?
Subscribe today to unlock all pages.

Trusted by 1+ million students worldwide

6BUSINESS PROCESS MANAGEMENT
4.B ABC Insurance Scenario:
4.B.1:
Figure 3: Value Chain Diagram of ABC Insurance Process Architecture
(Source: Created by Author)
4.B ABC Insurance Scenario:
4.B.1:
Figure 3: Value Chain Diagram of ABC Insurance Process Architecture
(Source: Created by Author)
Paraphrase This Document
Need a fresh take? Get an instant paraphrase of this document with our AI Paraphraser

7BUSINESS PROCESS MANAGEMENT
4.B.2:
Figure 4: Business Process Diagram AS-IS
(Source: Created by Author)
Figure 5: Check Claim Validity Sub Process of AS-IS
(Source: Created by Author)
4.B.2:
Figure 4: Business Process Diagram AS-IS
(Source: Created by Author)
Figure 5: Check Claim Validity Sub Process of AS-IS
(Source: Created by Author)

8BUSINESS PROCESS MANAGEMENT
4.B.3:
id Status Issue Type Owner Impact Priority
1 Hold Customer can fraud Customer High Medium
2 Hold Organization cannot detect the
fraud at any cost IT Helpdesk Extreme Critical
3 Hold Delay in phone connection
Customer/
Repair Shop
Employee
High High
4 Hold The shop worker do not know
about claims
Repair Shop
Employee Medium Low
5 Hold Agent failed to add coverage in
first attempt Agent Medium Low
⊘ This is a preview!⊘
Do you want full access?
Subscribe today to unlock all pages.

Trusted by 1+ million students worldwide

9BUSINESS PROCESS MANAGEMENT
Figure 6: Fishbone Diagram
(Source: Created by Author)
Usage of backdated telephonic communication is delay in work progress.
Human intervention in every work is causing delay and errors.
The number of employees working is low. That is why the connection is most of the time
unreachable.
Figure 6: Fishbone Diagram
(Source: Created by Author)
Usage of backdated telephonic communication is delay in work progress.
Human intervention in every work is causing delay and errors.
The number of employees working is low. That is why the connection is most of the time
unreachable.
Paraphrase This Document
Need a fresh take? Get an instant paraphrase of this document with our AI Paraphraser

10BUSINESS PROCESS MANAGEMENT
4.B.4:
Time: The delay in process completion will lead to better service
Figure 7: Business Process Diagram TO-BE
(Source: Created by Author)
4.B.4:
Time: The delay in process completion will lead to better service
Figure 7: Business Process Diagram TO-BE
(Source: Created by Author)

11BUSINESS PROCESS MANAGEMENT
Bibliography:
Chang, J. F. (2016). Business process management systems: strategy and implementation.
Auerbach Publications.
Esbenshade, J., Vidal, M., Fascilla, G., & Ono, M. (2016). Customer-driven management models
for choiceless clientele? Business process reengineering in a California welfare
agency. Work, employment and society, 30(1), 77-96.
Huang, S. Y., Lee, C. H., Chiu, A. A., & Yen, D. C. (2015). How business process reengineering
affects information technology investment and employee performance under different
performance measurement. Information Systems Frontiers, 17(5), 1133-1144.
Van Der Aalst, W. M., La Rosa, M., & Santoro, F. M. (2016). Business process management.
⊘ This is a preview!⊘
Do you want full access?
Subscribe today to unlock all pages.

Trusted by 1+ million students worldwide
1 out of 12
Related Documents

Your All-in-One AI-Powered Toolkit for Academic Success.
+13062052269
info@desklib.com
Available 24*7 on WhatsApp / Email
Unlock your academic potential
Copyright © 2020–2025 A2Z Services. All Rights Reserved. Developed and managed by ZUCOL.