Comprehensive Business Report: Alibaba Group Holdings Limited Analysis
VerifiedAdded on 2020/03/16
|20
|3899
|178
Report
AI Summary
This business report offers a comprehensive analysis of Alibaba Group Holdings Limited, examining its financial performance through ratio and segmental analysis, comparing it to industry standards. The report delves into Alibaba's marketing strategies, including the marketing mix and SWOT analysis, to assess its market positioning and promotional activities. Furthermore, it explores the company's HRM practices, evaluating core values, skills, change management, compensation, organizational culture, and recruitment policies. The operational analysis investigates the company's value chain and technical aspects. The report concludes with an overview of Alibaba's strengths, weaknesses, and overall business strategies.
Running Head: Business Report
1
Project Report: Business Report
1
Project Report: Business Report
Paraphrase This Document
Need a fresh take? Get an instant paraphrase of this document with our AI Paraphraser
Business Report
2
Contents
Introduction.......................................................................................................................3
Financial analysis..............................................................................................................3
Ratio analysis and comparison.....................................................................................3
Segmental analysis........................................................................................................4
Conclusion....................................................................................................................4
Marketing analysis............................................................................................................4
Marketing Mix..............................................................................................................5
SWOT Analysis............................................................................................................6
HRM analysis...................................................................................................................6
Operational analysis..........................................................................................................8
Strength and weakness....................................................................................................11
References.......................................................................................................................14
Appendix.........................................................................................................................16
Business Report
3
Introduction:
This business report has been prepared on Alibaba group holdings limited. Alibaba
limited is a Chinese company. This company is running its business through online portal. It
is the biggest company of e-commerce in Chinese market. This company provides business to
consumer, consumer to consumer, business to business sales services through a web portal.
This company offers various electronic payment services to its clients to make a payment
successfully without any kind of risk. The strategic business units of the company are its
various businesses such as services to the investors, manufactures, dealers and customers.
This company also offers a shopping search engine to services and cloud computing services
to its clients. Alibaba limited is the part of Alibaba group holdings limited. This company has
been founded in 1999 by Jack Ma. This company contracts with local and overseas
manufactures to sold out the products of these manufactures through the web portal of the
company. The current revenue of the company is somewhere around CNY 158.273 million.
Currently, 50000 employees are holding by the company to manage its domestic as well as
international business (Home, 2017). In April, 2016, this company has been awarded as the
biggest and most worthy retailing company as well as it is also recognized as one of the
biggest internet companies.
Financial analysis:
Financial analysis is a study which depict about various position of the company such
as is the company stable from last year? Is the financial performance of the company is
competitive? How is the viability of the company in terms of finance or is the business able
to make high profits?
Ratio analysis and comparison:
In the case of Alibaba limited, financial study has been performed over the company
through analyzing the financial statement of the company, ratio analysis, segmental analysis
and the industry evaluation. Firstly, a study has been performed over the financial statement
and ratio analysis of the company. These depict that how the company is performing in
context with the liquidity, profitability, solvency and efficiency. The profitability ratio of the
company depict that the profit margin of the company in 2016 was stunning and rest of the
years from last 5 years, the company is managing an average profitability ratio. Currently the
net margin of the company is 27.59% and the return on equity of the company is 15.67%.
⊘ This is a preview!⊘
Do you want full access?
Subscribe today to unlock all pages.
Trusted by 1+ million students worldwide
Business Report
4
This depict that the performance of the company is quite better than the industry profitability
ratio. The industry profitability ratio of the company is depicting the negative figures and
thus it has been found that Alibaba is performing well (Bloomberg, 2017).
Further, it has been found that the company is offering a great margin to the investors
according to the ratio of net profit and total equity of the company (annual report, 2017). In
addition, liquidity position of the company has been analyzed through analyzing the current
assets and current liabilities of the company. It has been evaluated that the current position of
the current ratio and quick ratio of the company is better and company could reduce the level
of current assets to manage the funds and cost of the company (Morningstar, 2017). The
industry ratio of the company is a way better and so company is suggested to follow the ratio
of the industry to manage the liquidity position.
The efficiency position of the company express about the better position of the
company and the efficiency of the company to managing its working capital. This depict that
the receivable collection period and payable collection period of the company is in a manner
that the company could manage the working capital effectively. Asset turnover ratio of the
company has also been analyzed and it has been found that the asset ratio of the company is
competitive (Morningstar, 2017). Further, the solvency ratio of the company has also been
analyzed and it has been found that the debt equity ratio and debt asset ratio of the company
is quite stunning.
Segmental analysis:
Further, the segmental analysis has also been done over the company and it has been
found that the segment of core commerce is more profitable than any other segment of the
company whereas the digital media and entertainment is the most loss segment of the
company.
Conclusion:
Through the study of financial analysis of the company, it has been analyzed that the
performance of the company in terms of industry performance is way better. The company is
managing to earn more profits than the industry. Though, it is also suggested to the company
to follow the ratio of the industry to manage the liquidity position.
Marketing analysis:
Paraphrase This Document
Need a fresh take? Get an instant paraphrase of this document with our AI Paraphraser
Business Report
5
Financial analysis is a study which depict about various position of the company such
as is the company using the best technique to do marketing for its products? Is the marketing
performance of the company is competitive? How is the viability of the company in terms of
marketing or is the business able to make high profits due to the marketing factor of the
company? Marketing analysis study of a company depict about all the internal and external
aspect of the company which could affect the business and marketing performance of a
company. In this study, 4ps and SWOT analysis has been done of Alibaba to analyze that
how well the company is using the marketing strategy to promote its products, manage the
sales and enhance the customer loyalty and so on.
Marketing Mix:
The marketing mix is an important tool to analyze and understand that how the
product and services of the company must be present in front of the customers to set a
position of the product or brand’s image into the customer’s mind (Du and Girma, 2009).
Mainly, 4 marketing mix are there which are product, price, place and promotion. The
marketing mix of Alibaba is as follows:
Product:
The main product of Alibaba limited is the e-commerce portal which is known as
Alibaba.com. This portal is known as the biggest business to business portal. This company
has achieved the heights through capturing the market of business to business rather than
business to customers such as Amazon and other e-portals are doing. This company also
offers many other products and services into the market such as online transaction and
payment, Alibaba.com, Alipay, China Yahoo, cloud computing etc. (FIRRER et al, 2012)
Price:
Alibaba has planned to offer the products in the lenient price to its customers and the
commission of the company is quite lower which allows the business man to run their
business easily. The main reason behind the success of the company is its lower commission
rate. The pricing strategy of Alibaba is Penetrative (Elmuti & Kathawala, 2001).
Place:
The range of Alibaba is very wider and this company has diversified its market
globally. The portal of this company is only of its type which has an international presence.
Business Report
6
The major advantage of this company is that it sleets from china mainly where the production
is done in bulk. Currently this company is exporting in around 240 countries from its
international portal.
Promotion:
This company is recognized to do heavy promotions of its portal. Basically, the
services of the company is digital and thus it becomes easy for the company to promote its
business through digital sources. This company also uses hoardings, sales promotions and
digital advertising to promote the business. TV advertisement, radio advertising and print
advertisement is also used by the company.
SWOT Analysis:
(Fulin, 2011)
Thus through this analysis, it has been found that the marketing activities of the
company are attractive and this is helping the company to achieve the target and motto of the
company.
HRM analysis:
HR analysis is a field of analysis that depicts about applying various analytical
processes to the HRD of a company in the expectation of enhancing the employee
SWOTAnalysis
⊘ This is a preview!⊘
Do you want full access?
Subscribe today to unlock all pages.
Trusted by 1+ million students worldwide
Business Report
7
performance and thus reaching at a level of better investment return. HR analysis does not
only consider about the analysing and collecting the efficiency of the employee. Instead, it
focuses to offer insight into every process of the company through collecting the data and
then taking the use of these data to make a better decision about how to enhance this
procedure (Lacalle, 2017). Various analysis and factors have been analyzed to identify the
main factors of HR in Alibaba. Some of them are as follows:
Core values:
Core values of Alibaba have been analyzed and it has been found that these are
helping the company to find a right path about fulfilling their objectives through making a
solid guide. The core values of the company depicts about the sustainability, corporate social
responsibility, commitment to manage and build a good environment, helping the needy
people etc.
Skills:
Skills of the company are quite impressive to manage entire activities and the
operations of the company, this company focuses over society and its people to measure their
skills and then it work accordingly.
Change in management:
Change management refers to a term where individual, company and the team are
prepared and supported to make a change into the organization, through analyzing the
management of Alibaba, it has been analyzed that company is making the changes into its
management style according to the organizational culture and changes into the economy
(Mcleish, 2010).
Pay and additional compensation:
Further, pay and additional compensation of the company has been analyzed and it
has been found that company is making a good payment to its employees and if the
employees are performing well and metering the target of the company is offering them
additional payment (Kaufmann, 2012).
Organizational culture:
Paraphrase This Document
Need a fresh take? Get an instant paraphrase of this document with our AI Paraphraser
Business Report
8
In addition, the organizational culture of the company is flexible. The offices of the
company in different countries could be dissimilar to each other as the company is focusing
more on the comfort of the employees.
Number of employees:
Currently, around 50,000 people are working with Alibaba group and the employee
turnover rate of the company is quite lower due to the various strategies and policies of the
company of motivation (Blundell and Dias, 2009).
Recruitment policy:
The recruitment policies of the company are quite attractive. Company is using
internal as well as external sources to manage and recruit the people for the company.
Company hires people through consultancy, campus placement, internal sources etc.
Corporate governance policy:
CSR policy of the company has also been analyzed and it has been found that
company is using the best ways to manage its duty towards the society. The total of 0.3%
from total revenue of the company is using by the company for the society welfare. Many
NGOs are running by the company to help the needy people (Dopfer, 2012). Currently,
Alibaba group has involved more than 10,000 villages from 100 countries to develop an e
platform. This company is committed to its social responsibility projects and offering various
benefits to the society and eco system.
Thus through this analysis it has been found that the HR management of the company
is quite strong and the system of the company is flexible rather than being rigid which is
helping the firm to manage entire process easily.
Operational analysis:
Operational analysis of a firm is related to the technical department of a company. It
depicts that how the engineering part of a company is performing. This department in inter
linked with all the other department of the company (Cravens and Piercy, 2006). In this
analysis, management of data, trade process, client reporting, client support service etc are
analyzed. The study of value chain of Alibaba has been done to understand this factor briefly.
Value chain:
Business Report
9
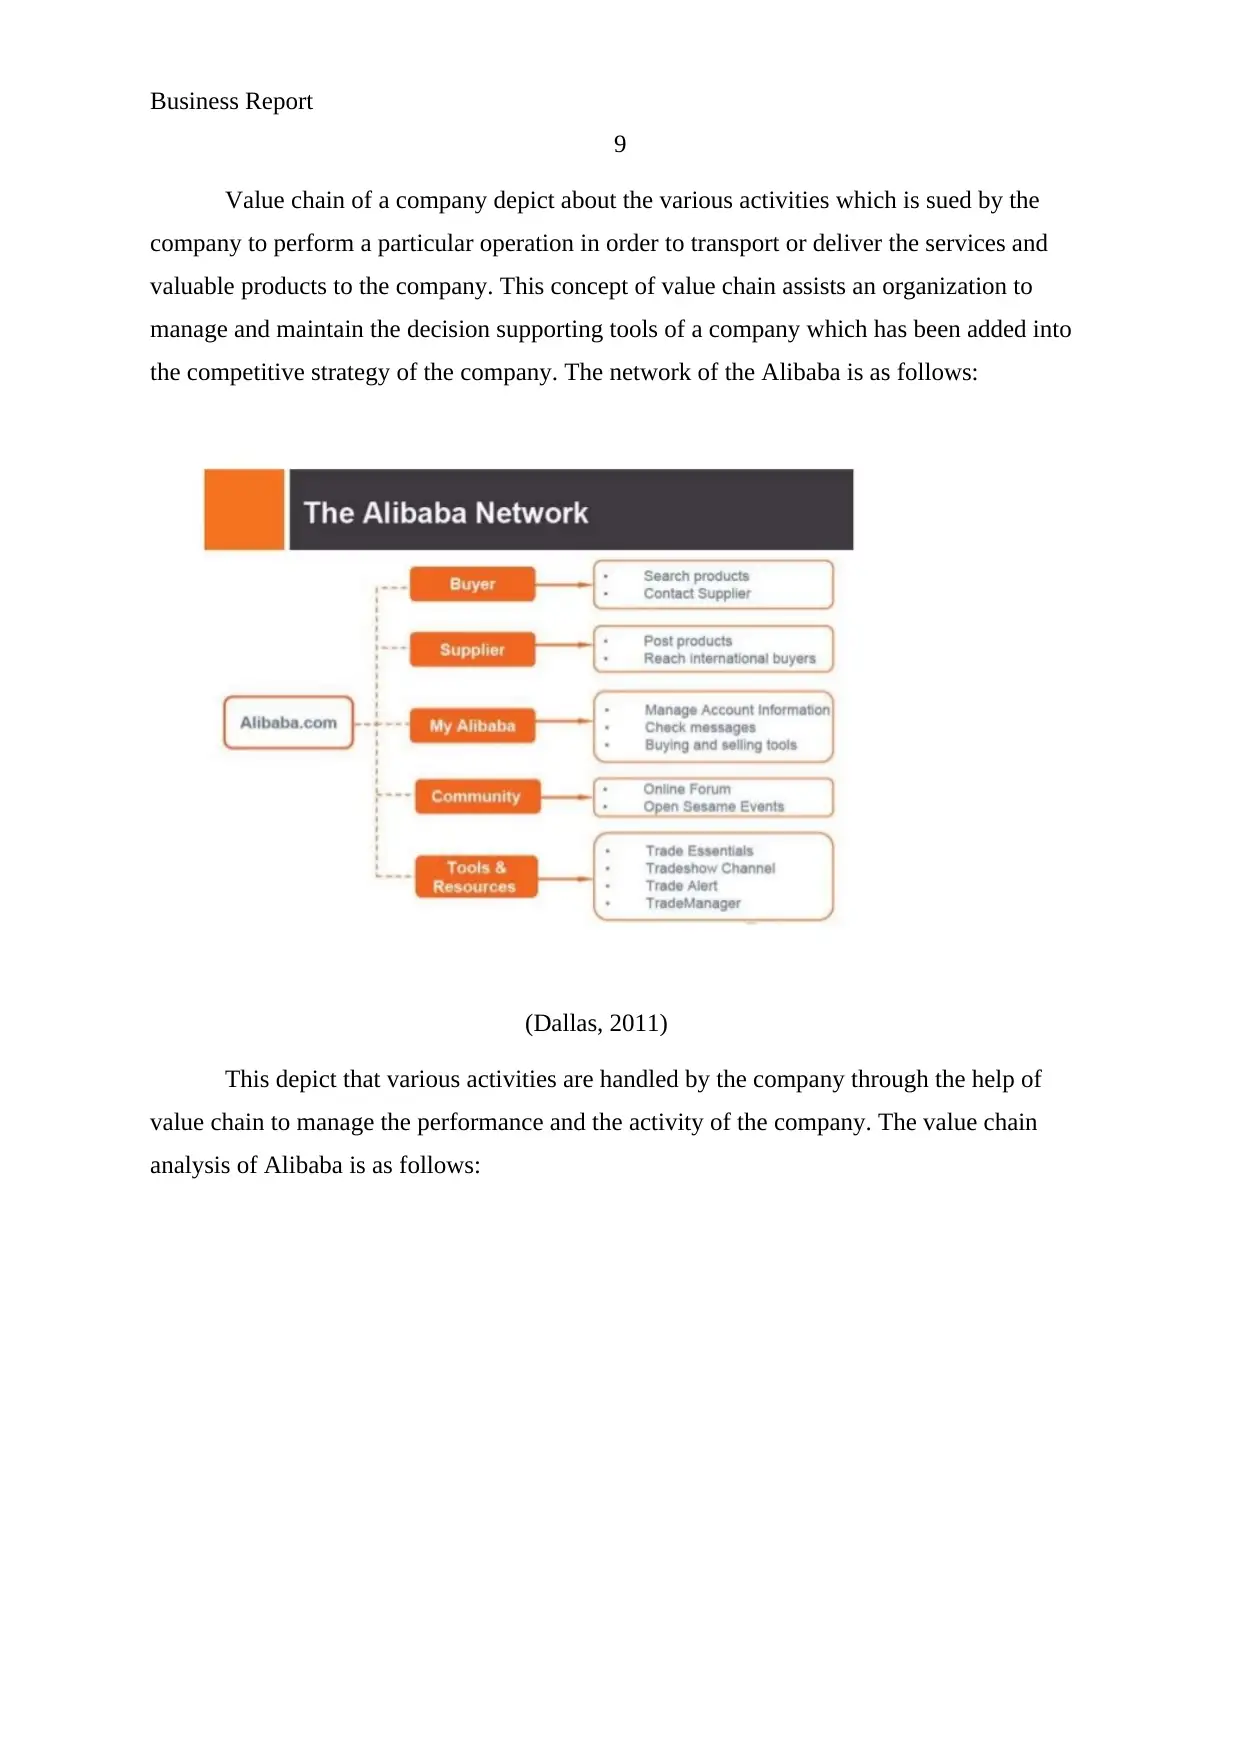
Value chain of a company depict about the various activities which is sued by the
company to perform a particular operation in order to transport or deliver the services and
valuable products to the company. This concept of value chain assists an organization to
manage and maintain the decision supporting tools of a company which has been added into
the competitive strategy of the company. The network of the Alibaba is as follows:
(Dallas, 2011)
This depict that various activities are handled by the company through the help of
value chain to manage the performance and the activity of the company. The value chain
analysis of Alibaba is as follows:
9
Value chain of a company depict about the various activities which is sued by the
company to perform a particular operation in order to transport or deliver the services and
valuable products to the company. This concept of value chain assists an organization to
manage and maintain the decision supporting tools of a company which has been added into
the competitive strategy of the company. The network of the Alibaba is as follows:
(Dallas, 2011)
This depict that various activities are handled by the company through the help of
value chain to manage the performance and the activity of the company. The value chain
analysis of Alibaba is as follows:
⊘ This is a preview!⊘
Do you want full access?
Subscribe today to unlock all pages.
Trusted by 1+ million students worldwide
Business Report
10
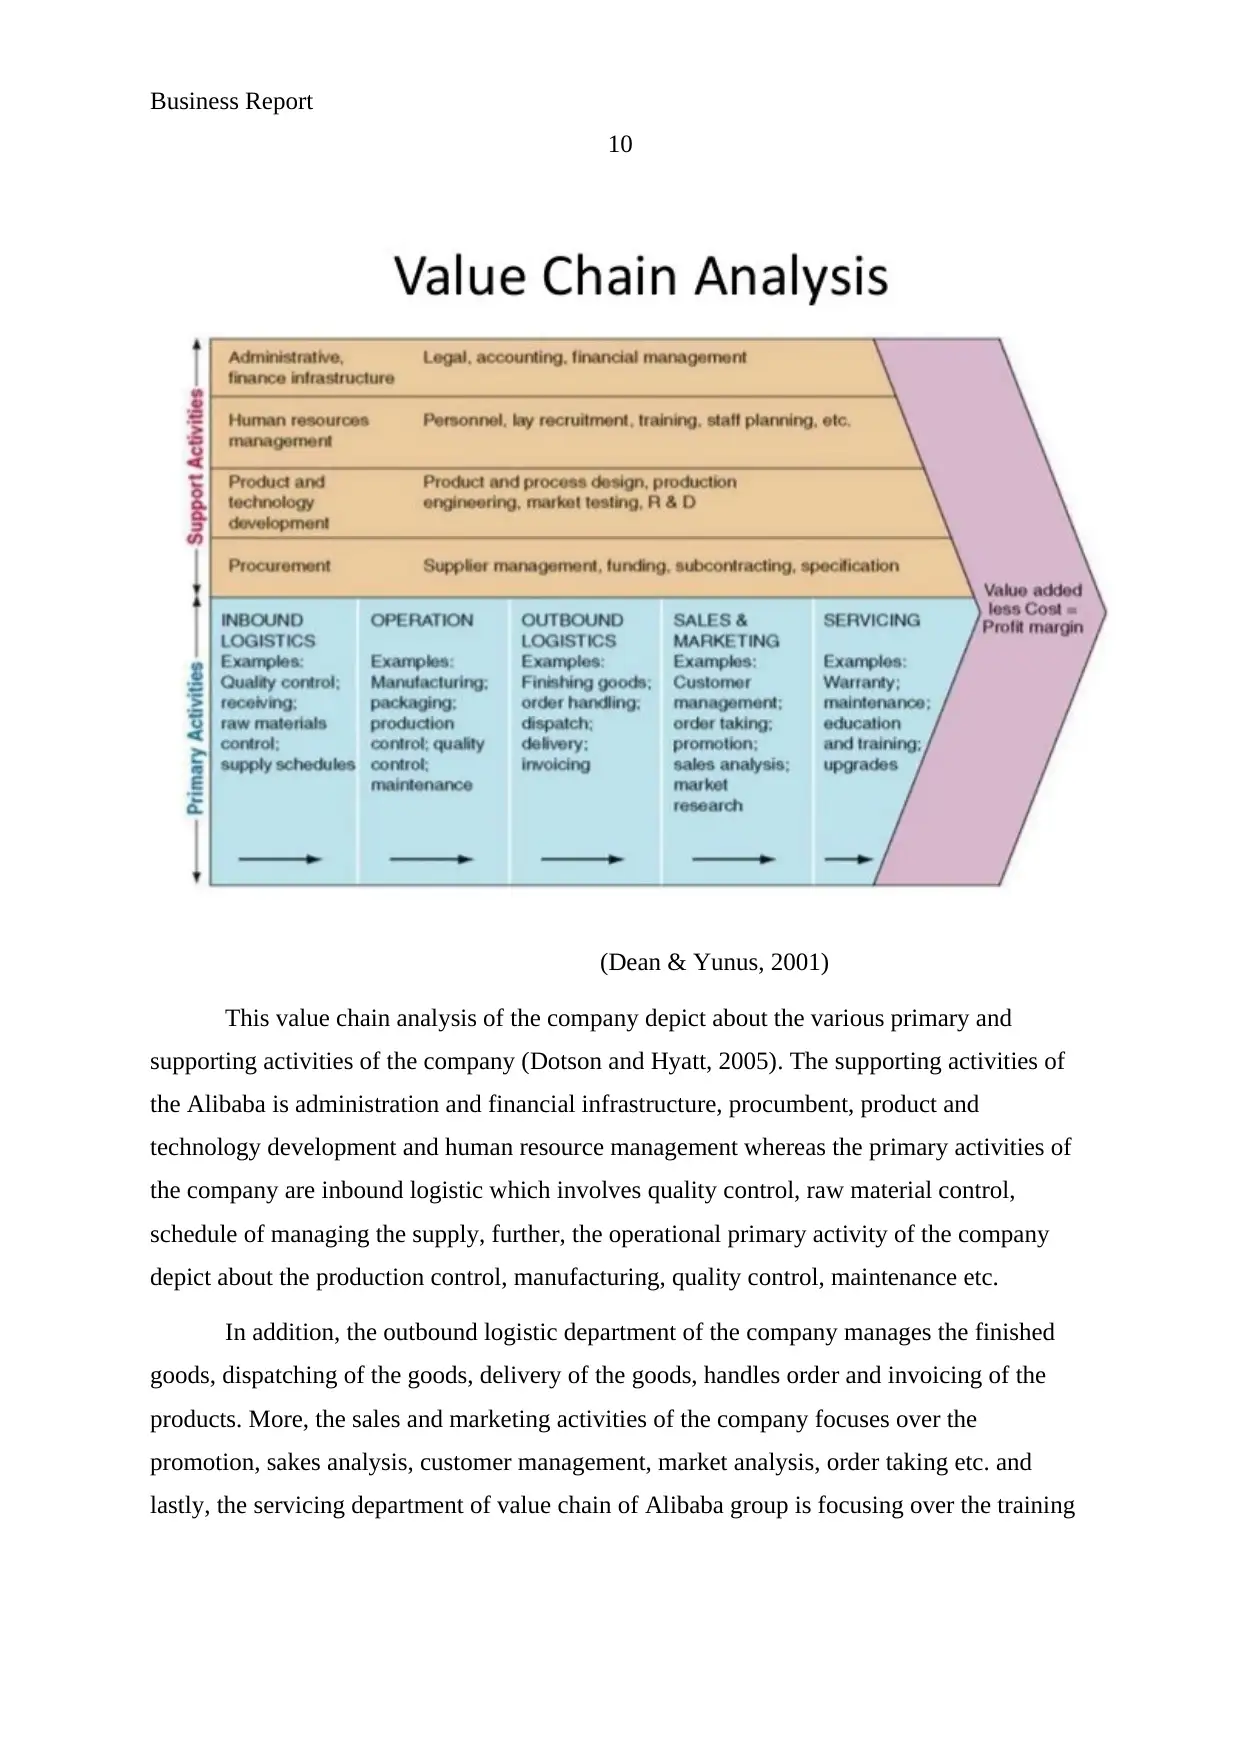
(Dean & Yunus, 2001)
This value chain analysis of the company depict about the various primary and
supporting activities of the company (Dotson and Hyatt, 2005). The supporting activities of
the Alibaba is administration and financial infrastructure, procumbent, product and
technology development and human resource management whereas the primary activities of
the company are inbound logistic which involves quality control, raw material control,
schedule of managing the supply, further, the operational primary activity of the company
depict about the production control, manufacturing, quality control, maintenance etc.
In addition, the outbound logistic department of the company manages the finished
goods, dispatching of the goods, delivery of the goods, handles order and invoicing of the
products. More, the sales and marketing activities of the company focuses over the
promotion, sakes analysis, customer management, market analysis, order taking etc. and
lastly, the servicing department of value chain of Alibaba group is focusing over the training
10
(Dean & Yunus, 2001)
This value chain analysis of the company depict about the various primary and
supporting activities of the company (Dotson and Hyatt, 2005). The supporting activities of
the Alibaba is administration and financial infrastructure, procumbent, product and
technology development and human resource management whereas the primary activities of
the company are inbound logistic which involves quality control, raw material control,
schedule of managing the supply, further, the operational primary activity of the company
depict about the production control, manufacturing, quality control, maintenance etc.
In addition, the outbound logistic department of the company manages the finished
goods, dispatching of the goods, delivery of the goods, handles order and invoicing of the
products. More, the sales and marketing activities of the company focuses over the
promotion, sakes analysis, customer management, market analysis, order taking etc. and
lastly, the servicing department of value chain of Alibaba group is focusing over the training
Paraphrase This Document
Need a fresh take? Get an instant paraphrase of this document with our AI Paraphraser
Business Report
11
related to the product, maintenance of the product, warranty, upgrades etc. (Elmuti &
Kathawala, 2011).
Thus through this analysis, it has been found that the value chain of the company is
way better and helping the company to manage entire related factor and opportunity in a well
manner.
Strength and weakness:
Finance department:
The main strength of the financial department of the company is as follows:
Market leader
High profitability condition
Revenue increment
Better efficiency position
Better solvency position (Fournier and Lee, 2009)
The weakness of the financial department of the company is as follows:
Segmental performance is not good
Liquidity position must be better
Economical condition is not good
Government regulation
Less profit in 2017 in comparison of 2016
Marketing department:
The main strength of the marketing department of the company is as follows:
Market leader
Better promotional activities
The prices are competitive
Strategies are better
Places of buying the products are better
The weakness of the marketing department of the company is as follows:
Government regulation
International boundaries
Business Report
12
Cultural differences
Customer loyalty is less
Decrement in the revenue
HRM:
The main strength of the HRM department of the company is as follows:
Huge employees
Motivated employees
Better CSR policies (Gaughan, 2010)
Good environment
Better training
The weakness of the HRM department of the company is as follows:
Cultural differences
Organizational culture
Regulations
Less focus over the HR policies
Government regulations
Operational department:
The main strength of the operational department of the company is as follows:
Better value chain model
Good supporting activities
Organizational activities
Better management
High technology (Jain and Haley, 2009)
The weakness of the operational department of the company is as follows:
Competitors
Less training
Quality control is not good
Department are not interlinked
Regulations
⊘ This is a preview!⊘
Do you want full access?
Subscribe today to unlock all pages.
Trusted by 1+ million students worldwide
1 out of 20
Related Documents


Your All-in-One AI-Powered Toolkit for Academic Success.
+13062052269
info@desklib.com
Available 24*7 on WhatsApp / Email
![[object Object]](/_next/static/media/star-bottom.7253800d.svg)
Unlock your academic potential
Copyright © 2020–2026 A2Z Services. All Rights Reserved. Developed and managed by ZUCOL.