Business Studies Report: Financial Analysis, Softly Sofas Pty Ltd

Verified

Added on  2022/09/06

|12
|1694
|16
Report
AI Summary
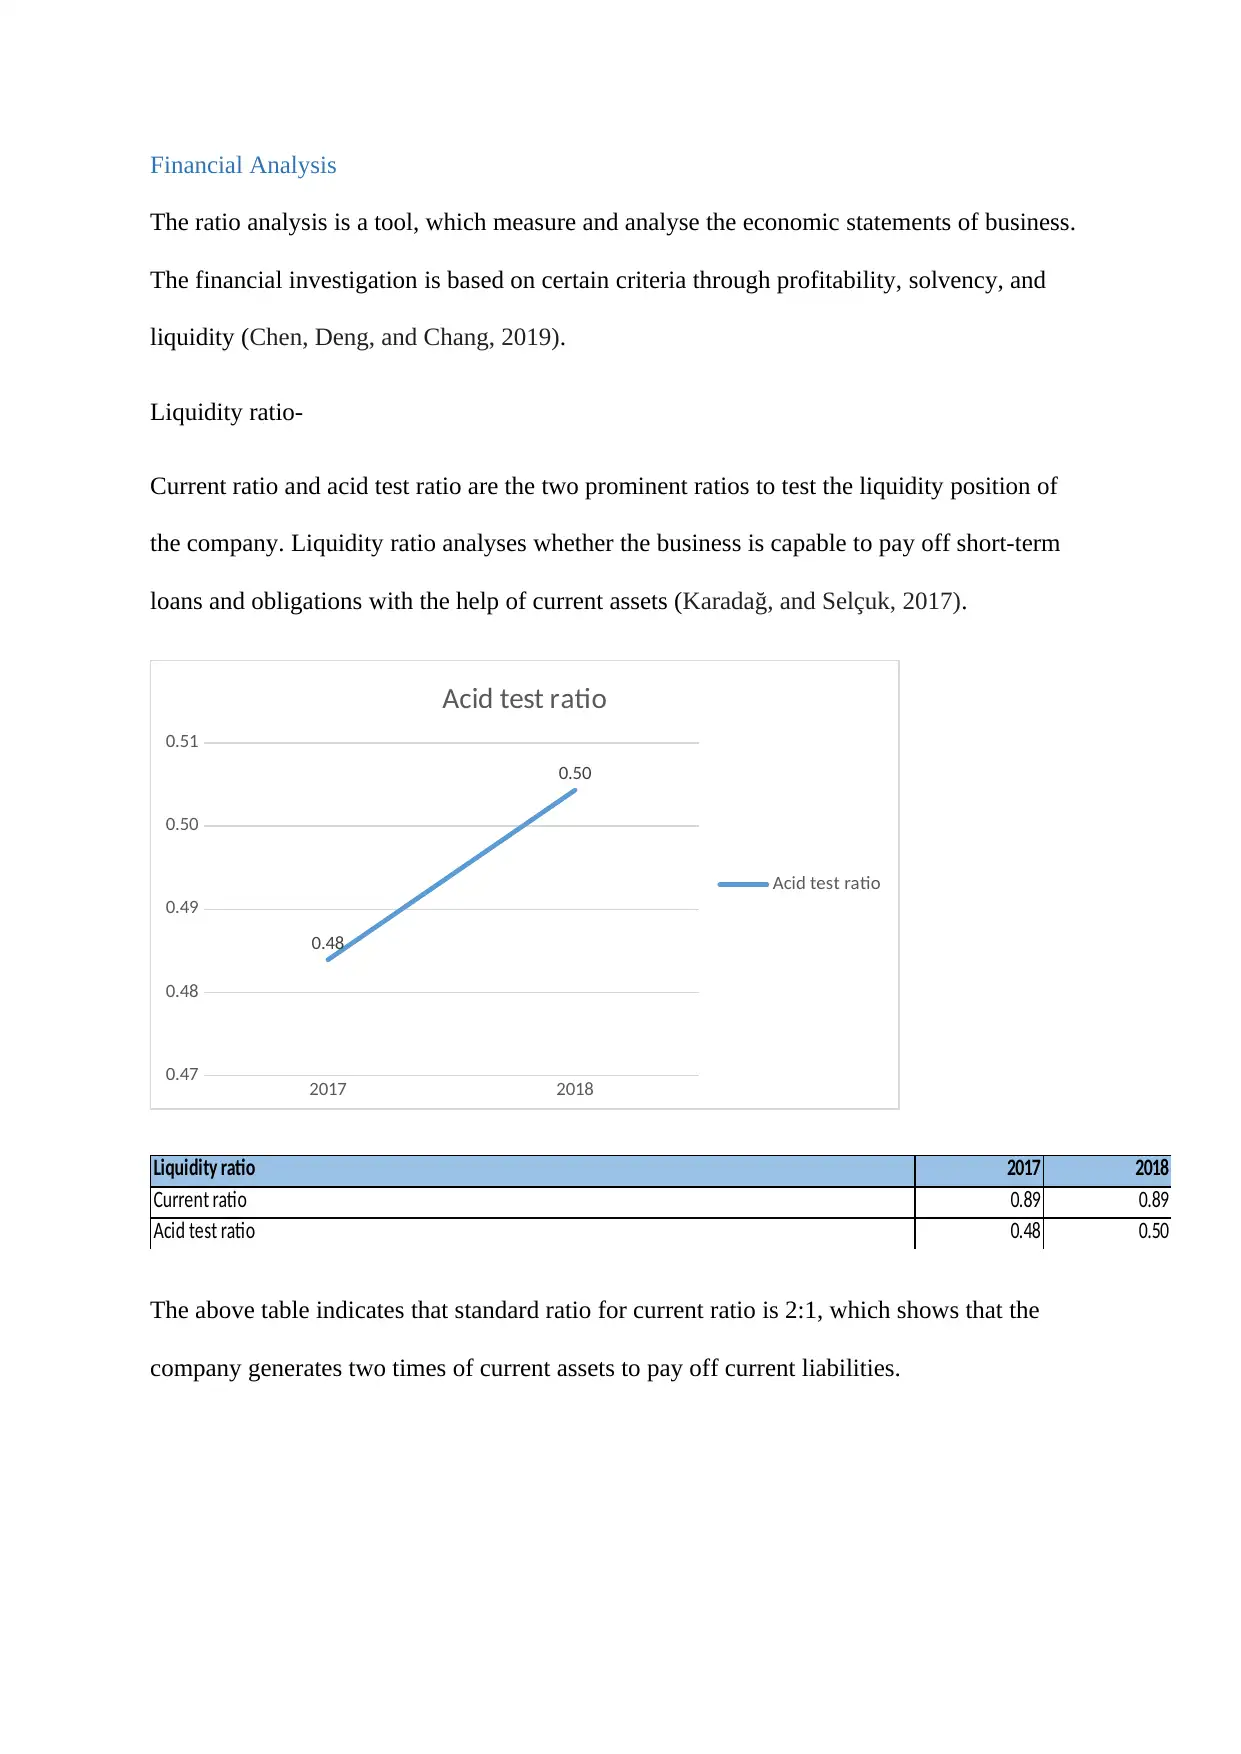
This report presents a financial analysis of Softly Sofas Pty Ltd, examining its performance in the context of global influences and potential risks. The report begins with an introduction to Softly Sofas and identifies factors such as political and economic risks associated with entering the New Zealand market. It then delves into a detailed financial analysis, utilizing ratio analysis to assess the company's liquidity, solvency, and profitability. Key ratios, including current ratio, debt-equity ratio, interest coverage ratio, gross profit ratio, net profit margin, return on equity, and return on total assets, are analyzed for the years 2017 and 2018. The report also explores global financial management strategies to mitigate identified risks, such as forecasting and financial planning. Finally, the report suggests methods to minimize risks and optimize the company's financial performance. The report includes a detailed overview of the company's financial position and provides recommendations to mitigate potential risks associated with global operations.
tabler-icon-diamond-filled.svg

Contribute Materials

Your contribution can guide someone’s learning journey. Share your documents today.
Document Page
BUSINESS STUDIES
tabler-icon-diamond-filled.svg

Secure Best Marks with AI Grader

Need help grading? Try our AI Grader for instant feedback on your assignments.
Document Page
Contents
Introduction...........................................................................................................................................3
Global influence that may impact on this decision................................................................................3
Financial Analysis.................................................................................................................................4
Global financial management way to opt a way out to get rid of the issues...........................................9
References...........................................................................................................................................11
Document Page
Introduction
The report brings out a discussion on Softly Sofas Pty Ltd, which offers cosy, differentiated,
very comfortable, inspired solutions and the accessible price in Ligne Roset collection. At
first, the report comes up with factors (global and external risks) affecting the decision of the
organisation. Furthermore, the report analyse the financial statement of business with help of
ratio analysis. It is a tool, which can measure to gain insight in company`s liquidity,
profitability, and operational efficiency by elaborating financial statements. Furthermore,
there is a resolution of the company, which can minimise the impact of external and global
risks associated with company`s operations.
Global influence that may impact on this decision
Risks associated with entering New Zealand is the political risks and economic risks, which
will affect the organisation at its maximum on decision-making (Zavadskas et al., 2018). New
Zealand`s GDP grew 2.5 percent in 2019, which is expected to be at similar level in 2020 in
2.7 percent and 2021 of 2.6 percent. Political conditions are instable where business
environment leavers no scope for improvement (Visvizi, and Lytras, 2019). Government
rules and legislations for supplying wood materials to our country depends on the scope of
the of leverages and advantages availed to the local business. The country is highly
dependent on foreign investment to avail services to its people and high corporate debt level.
The nation is highly dependent on Chinese demand and it has lack of skilled labour. The
company will face issues in engaging R&D department and low labour productivity as
compared to other nations. The risks is not limited to political risks but it extends to
operational risks and financial risks (Zavadskas, Stević, Tanackov, and Prentkovskis, 2018).
Document Page
Financial Analysis
The ratio analysis is a tool, which measure and analyse the economic statements of business.
The financial investigation is based on certain criteria through profitability, solvency, and
liquidity (Chen, Deng, and Chang, 2019).
Liquidity ratio-
Current ratio and acid test ratio are the two prominent ratios to test the liquidity position of
the company. Liquidity ratio analyses whether the business is capable to pay off short-term
loans and obligations with the help of current assets (Karadağ, and Selçuk, 2017).
2017 2018
0.47
0.48
0.49
0.50
0.51
0.48
0.50
Acid test ratio
Acid test ratio
Liquidity ratio 2017 2018
Current ratio 0.89 0.89
Acid test ratio 0.48 0.50
The above table indicates that standard ratio for current ratio is 2:1, which shows that the
company generates two times of current assets to pay off current liabilities.
tabler-icon-diamond-filled.svg

Secure Best Marks with AI Grader

Need help grading? Try our AI Grader for instant feedback on your assignments.
Document Page
2017 2018
0.89
0.89
0.89
0.89
0.89
Current ratio
Current ratio
Solvency ratio-
This ratio has two prominent ratios, which has been indicated by debt-equity ratio and
interest coverage ratio. This ratio reflects whether business is able to pay off long term
liabilities of the company through interest coverage ratio. On the additional point, Debt
equity proportion checks capital structure of the business by managing the amount of debt
and equity in total investment (Nguyen, 2016).
Solvency Ratios
Capital structure ratio 2017 2018
Debt- equity 0.77 0.50
interest coverage ratio 3.33 4.93
The above ratio indicates that standard ratio regarding the debt-equity ratio is estimated 2:1,
which indicates the best proportion of the capital structure. Here, debt equity ratio for 2017
is .77:1, which is extremely low, which shows that the company is dependent on equity rather
than managing its capital. For 2018, the company maintains a ratio of .5:1, which shows debt,
is almost half of the equity. This analyses that company use.
Document Page
2017 2018
0.00
0.10
0.20
0.30
0.40
0.50
0.60
0.70
0.80
0.90
0.77
0.50
Debt- equity
Debt- equity
Interest coverage ratio indicates the number of times of how the company is able to pay off
the interest incurred through long-term loans (Alamgir et al., 2017).
2017 2018
0.00
1.00
2.00
3.00
4.00
5.00
6.00
3.33
4.93
Interest coverage ratio
Intrest coverage ratio
Profitability ratio-
This ratio reflects the generation of profits in proportion to the total sales. It is the magnitude
and measure of financial conditions of the company. It is used as the financial metrics, which
can be assessed by generating earnings in relation to revenues, balance sheet, operating costs,
and the investor`s equity. The ideal ratio for viable profitability ratio is 12-20 percent. The
Document Page
prominent ratios for profitability analysis will include Net profit margin, Gross profit ratio,
return on total assets and return on equity (Sales, Ghirardi, and Jorquera, 2017).
Profitability Ratios 2017 2018
Gross Profit ratio 75% 75%
Net Profit Margin 5% 7%
Return on Equity 27% 32%
Return on Total assets 12% 17%
Gross profit ratio-
2017 2018
75%
75%
76%
75%
75%
Gross Profit ratio
Gross Profit ratio
Gross profit ratio is the degree of amount of total revenue to Gross profits (Sales- cost of
production) (Nguyen, 2016). The gross profit for both the years (2017 and 2018) is nearly 75
percent, which means the direct costs associated with the production of products is quite less.
The standard ratio for gross profit ratio is 50 percent, which is estimated at 75 percent each
year.
Net Profit Margin-
tabler-icon-diamond-filled.svg

Paraphrase This Document

Need a fresh take? Get an instant paraphrase of this document with our AI Paraphraser
Document Page
2017 2018
0%
1%
2%
3%
4%
5%
6%
7%
8%
5%
7%
Net Profit Margin
Net Profit Margin
Net Profit ratio measures the proportion of remaining profits after cost of production,
financing, and administration subtracted from the sales (Visvizi, and Lytras, 2019). The net
profit margin for 2017 and 2018, which represents that the company earns 5 percent in 2017
and 7 percent in 2018. This net profit ratio indicates that the indirect expense of the company
is extremely high, which has led to decrease in net profitability. The net profit ratio for
industry is 6 percent and Softly Sofas Pty Ltd has remained between 5 to 7 percent each year.
Return on equity-
2017 2018
25%
26%
27%
28%
29%
30%
31%
32%
33%
Return on Equity
Return on Equity
Document Page
This ratio measure the net profits generated by employing total equity (Limbong et al., 2018).
Return on equity of Softly Sofas Pty Ltd is estimated at 27 percent in 2017 and 32 percent in
2018, which indicates that the company returns are quite appropriate in terms of contribution
towards the equity.
Return on total assets-
2017 2018
0%
2%
4%
6%
8%
10%
12%
14%
16%
18%
12%
17%
Return on Total assets
Return on Total
assets
Return on total assets measure the organisation’s earnings by employing total net assets. The
graph indicates that Yield on total assets is nearly 12 percent in 2017 and 17 percent in 2018.
The company generates appropriate amount of returns by employing total assets.
Account receivable ratio refers to number of times each year, which an organisation collects
average accounts receivable. This can measure the capability to effectively issue the credit
the customers and then collect the funds as well. According to industry ratio, the average
ratio is 15 days, whereas, receivable ratio of Softly Sofas Pty Ltd is 12 days that shows it is
efficient to maintain working capital.
Document Page
Global financial management way to opt a way out to get rid of the issues
As global risks can be completely minimised and vanished, political risks especially
exchange rates, interest rates and other political risks. However, the company can minimise
the risks so that it can get rid of issues with appropriate management of risks. Furthermore,
forecasting is the best method to reduce the risks. Furthermore, the company can create the
financial plan by estimating interest expenses according to the interest risks in the New
Zealand`s economy. This process will include planning, controlling, directing, and decision
making of the company in regards to its finances. The company can manage profitability by
controlling business costs and revenues by effective profitable management, which refers to
minimising costs and then maximising the revenue at the same time.
tabler-icon-diamond-filled.svg

Secure Best Marks with AI Grader

Need help grading? Try our AI Grader for instant feedback on your assignments.
Document Page
References
Alamgir, M., Campbell, M.J., Sloan, S., Goosem, M., Clements, G.R., Mahmoud, M.I. and
Laurance, W.F., 2017. Economic, socio-political and environmental risks of road
development in the tropics. Current Biology, 27(20), pp.R1130-R1140.
Chen, L., Deng, X. and Chang, T., 2019. Analysis of Political Risks Affecting International
Construction projects in Malaysia. International Journal of Construction Engineering and
Planning, 5(2), pp.10-27.
Karadağ, M. and Selçuk, H., 2017. The Comparison of Islamic Financial Reporting and
International Financial Reporting in terms of Murabaha, an Islamic Financial Tool.
Limbong, T., Simarmata, J., Sriadhi, S., Tambunan, A.R.S., Sinaga, E.K., Simbolon, N.,
Simarmata, H.M.P., Siahaan, A.L.S., Septarini, I.R., Jaya, I.K. and Lubis, M.A., 2018. The
Implementation of Multi-Objective Optimization on the Basis of Ratio Analysis Method to
Select the Lecturer Assistant Working at Computer Laboratorium. J. Eng. Technol, 7, pp.352-
356.
Nguyen, Q.K., 2016, November. Blockchain-a financial technology for future sustainable
development. In 2016 3rd International conference on green technology and sustainable
development (GTSD) (pp. 51-54). IEEE.
Sales, E.A., Ghirardi, M.L. and Jorquera, O., 2017. Subcritical ethylic biodiesel production
from wet animal fat and vegetable oils: A net energy ratio analysis. Energy conversion and
management, 141, pp.216-223.
Visvizi, A. and Lytras, M. eds., 2019. Smart Cities: Issues and Challenges: Mapping
Political, Social and Economic Risks and Threats. Elsevier.
Document Page
Zavadskas, E.K., Stević, Ž., Tanackov, I. and Prentkovskis, O., 2018. A novel multicriteria
approach–rough step-wise weight assessment ratio analysis method (R-SWARA) and its
application in logistics. Studies in Informatics and Control, 27(1), pp.97-106.
chevron_up_icon
1 out of 12
circle_padding
hide_on_mobile
zoom_out_icon
logo.png

Your All-in-One AI-Powered Toolkit for Academic Success.

Available 24*7 on WhatsApp / Email

[object Object]