Business Decision Making Report: Sygenta's US Market Entry Strategy
VerifiedAdded on 2020/01/21
|21
|4914
|433
Report
AI Summary
This report presents a comprehensive analysis of Sygenta's business decisions regarding the potential launch of its fungicide product, Amistar, in the USA. The report begins with an introduction to the challenges of modern business decision-making, emphasizing the use of statistical tools for predicting future trends. The research methodology includes the creation of a plan for collecting primary and secondary data, survey methodology, and a questionnaire for gathering information. Statistical tools such as mean, median, mode, and standard deviation are applied to analyze the collected data, with interpretations and recommendations provided. The report also includes graphic representations of the data, trend line creation for prediction, and the development of a formal business report. Furthermore, it covers information processing tools, a project plan, and project evaluation techniques, including payback period, ARR, NPV, and IRR calculations. The findings suggest that Sygenta should focus on making expenditures in the range of 30-40 million to expand its business rapidly in the USA.

BUSINESS DECISION MAKING
Paraphrase This Document
Need a fresh take? Get an instant paraphrase of this document with our AI Paraphraser
TABLE OF CONTENTS
INTRODUCTION...........................................................................................................................3
TASK 1............................................................................................................................................3
1.1 Creation of plan for collection of primary and secondary data ............................................3
1.2 Survey methodology for sampling frame used ....................................................................3
1.3 Questionnaire for research....................................................................................................4
TASK 2............................................................................................................................................5
2.1 Representative values of statistical tools...............................................................................5
2.2 Analysis of results of mean median and mode......................................................................7
2.3 Measures of dispersion..........................................................................................................7
2.4 Calculation of quartile, percentile and correlation................................................................8
TASK 3............................................................................................................................................9
3.1 Graphic representation of collected data...............................................................................9
3.2 Creation of trend line for prediction....................................................................................14
3.4 Formal business report........................................................................................................14
TASK 4..........................................................................................................................................15
4.1 Information processing tools...............................................................................................15
4.2 Project plan for business project ........................................................................................16
4.3 Project evaluation techniques..............................................................................................18
CONCLUSION..............................................................................................................................20
REFERENCES..............................................................................................................................21
INDEX OF TABLES
Table 1: Calculation of mean, median and mode............................................................................6
Table 2: Measures of dispersion......................................................................................................8
Table 3: Calculation of quartile and percentile................................................................................9
Table 4: Calculation of correlation..................................................................................................9
Table 5: Sales, cost and profit data................................................................................................10
Table 6: Which of the below given factors you think mostly affect your purchasing decisions?. 13
Table 7: Do you think that Sygenta must launch Amistar in USA?.............................................14
Table 8: Calculation of pay back period method...........................................................................19
Table 9: Calculation of ARR.........................................................................................................19
Table 10: Calculation of NPV........................................................................................................20
Table 11: Calculation of IRR.........................................................................................................20
ILLUSTRATION INDEX
Illustration 1: Chart on sales, cost and profit data.........................................................................11
Illustration 2: People opinion on Which of the below given factors you think mostly affect your
purchasing decisions?....................................................................................................................13
Illustration 3: People opinion regarding opening of business in USA...........................................14
Illustration 4: Trend line for Sygenta.............................................................................................15
Illustration 5: GANTT chart..........................................................................................................18
Illustration 6: Network diagram.....................................................................................................18
⊘ This is a preview!⊘
Do you want full access?
Subscribe today to unlock all pages.
Trusted by 1+ million students worldwide
INTRODUCTION
In today era, it is very difficult to make business decisions due to complexity of business
environment. It is facts which are used to predict future trends and in this regard various tools are
used like mean, median, mode and standard deviation. In this report a research is conducted
regard to opening of business in USA. In respect to this primary and secondary data is collected
by the researcher. In case of primary data questionnaire is distributed and response is collected.
On the secondary data statistical tools like mean, median, mode and standard deviation is
applied. On he basis of results of these tools recommendations are made in the formal business
report. Apart from this, project evaluation techniques are also applied and their results are
interpreted in proper manner. In this way entire project is prepared in systematic manner.
TASK 1
1.1 Creation of plan for collection of primary and secondary data
Sygenta is a company which wants to launch its fungicide product named Amistar for
the pest control. In study, USA is selected because it is a nation in which in large quantity crops
are produced. Also it is large in size and due to this reason; it has become easy to earn a huge
amount of revenue in USA (Groves, 2011). In order to launch business, it is necessary to conduct
market research. Hence, primary and secondary data is collected for doing market research. In
order to conduct a secondary research, data will be taken from newspapers, books and journals
etc. Secondary data is a data that is already collected by someone else and is published in the
specific source of information. Whereas, primary research is a research in which data is
collected for the first time by the researcher (Jankowicz, 2005). For conducting primary
research, sample of 50 people will be taken which reside in different villages of Texas. By
carrying out the research, Sygenta would be able to identify potential of the specific geographic
area in terms of revenue. Hence, in this way research will be conducted in a proper manner.
1.2 Survey methodology for sampling frame used
Survey methodology and sampling techniques are used to conduct research in a proper
manner and to select appropriate data collection techniques for the research. Following are
sample techniques that can be used by the Sygenta for conducting a research.
Paraphrase This Document
Need a fresh take? Get an instant paraphrase of this document with our AI Paraphraser
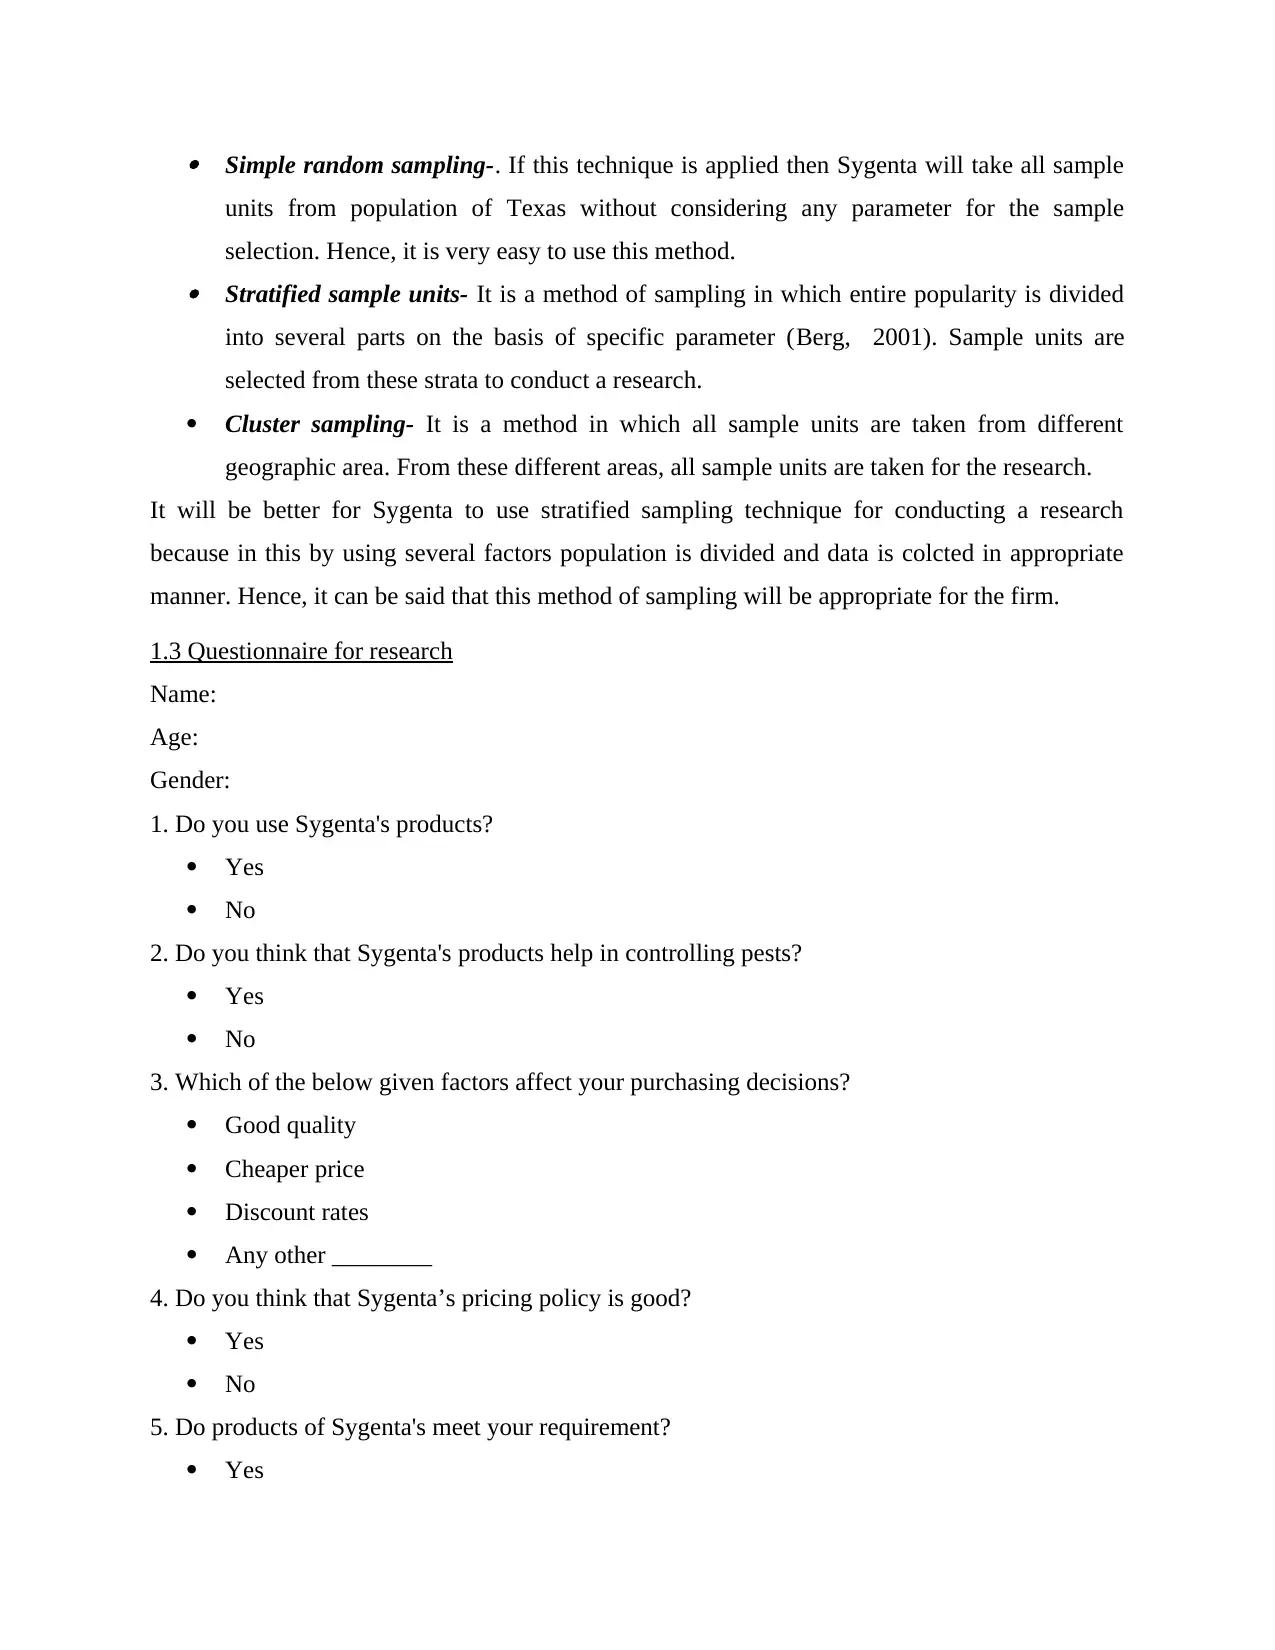
Simple random sampling-. If this technique is applied then Sygenta will take all sample
units from population of Texas without considering any parameter for the sample
selection. Hence, it is very easy to use this method. Stratified sample units- It is a method of sampling in which entire popularity is divided
into several parts on the basis of specific parameter (Berg, 2001). Sample units are
selected from these strata to conduct a research.
Cluster sampling- It is a method in which all sample units are taken from different
geographic area. From these different areas, all sample units are taken for the research.
It will be better for Sygenta to use stratified sampling technique for conducting a research
because in this by using several factors population is divided and data is colcted in appropriate
manner. Hence, it can be said that this method of sampling will be appropriate for the firm.
1.3 Questionnaire for research
Name:
Age:
Gender:
1. Do you use Sygenta's products?
Yes
No
2. Do you think that Sygenta's products help in controlling pests?
Yes
No
3. Which of the below given factors affect your purchasing decisions?
Good quality
Cheaper price
Discount rates
Any other ________
4. Do you think that Sygenta’s pricing policy is good?
Yes
No
5. Do products of Sygenta's meet your requirement?
Yes
No
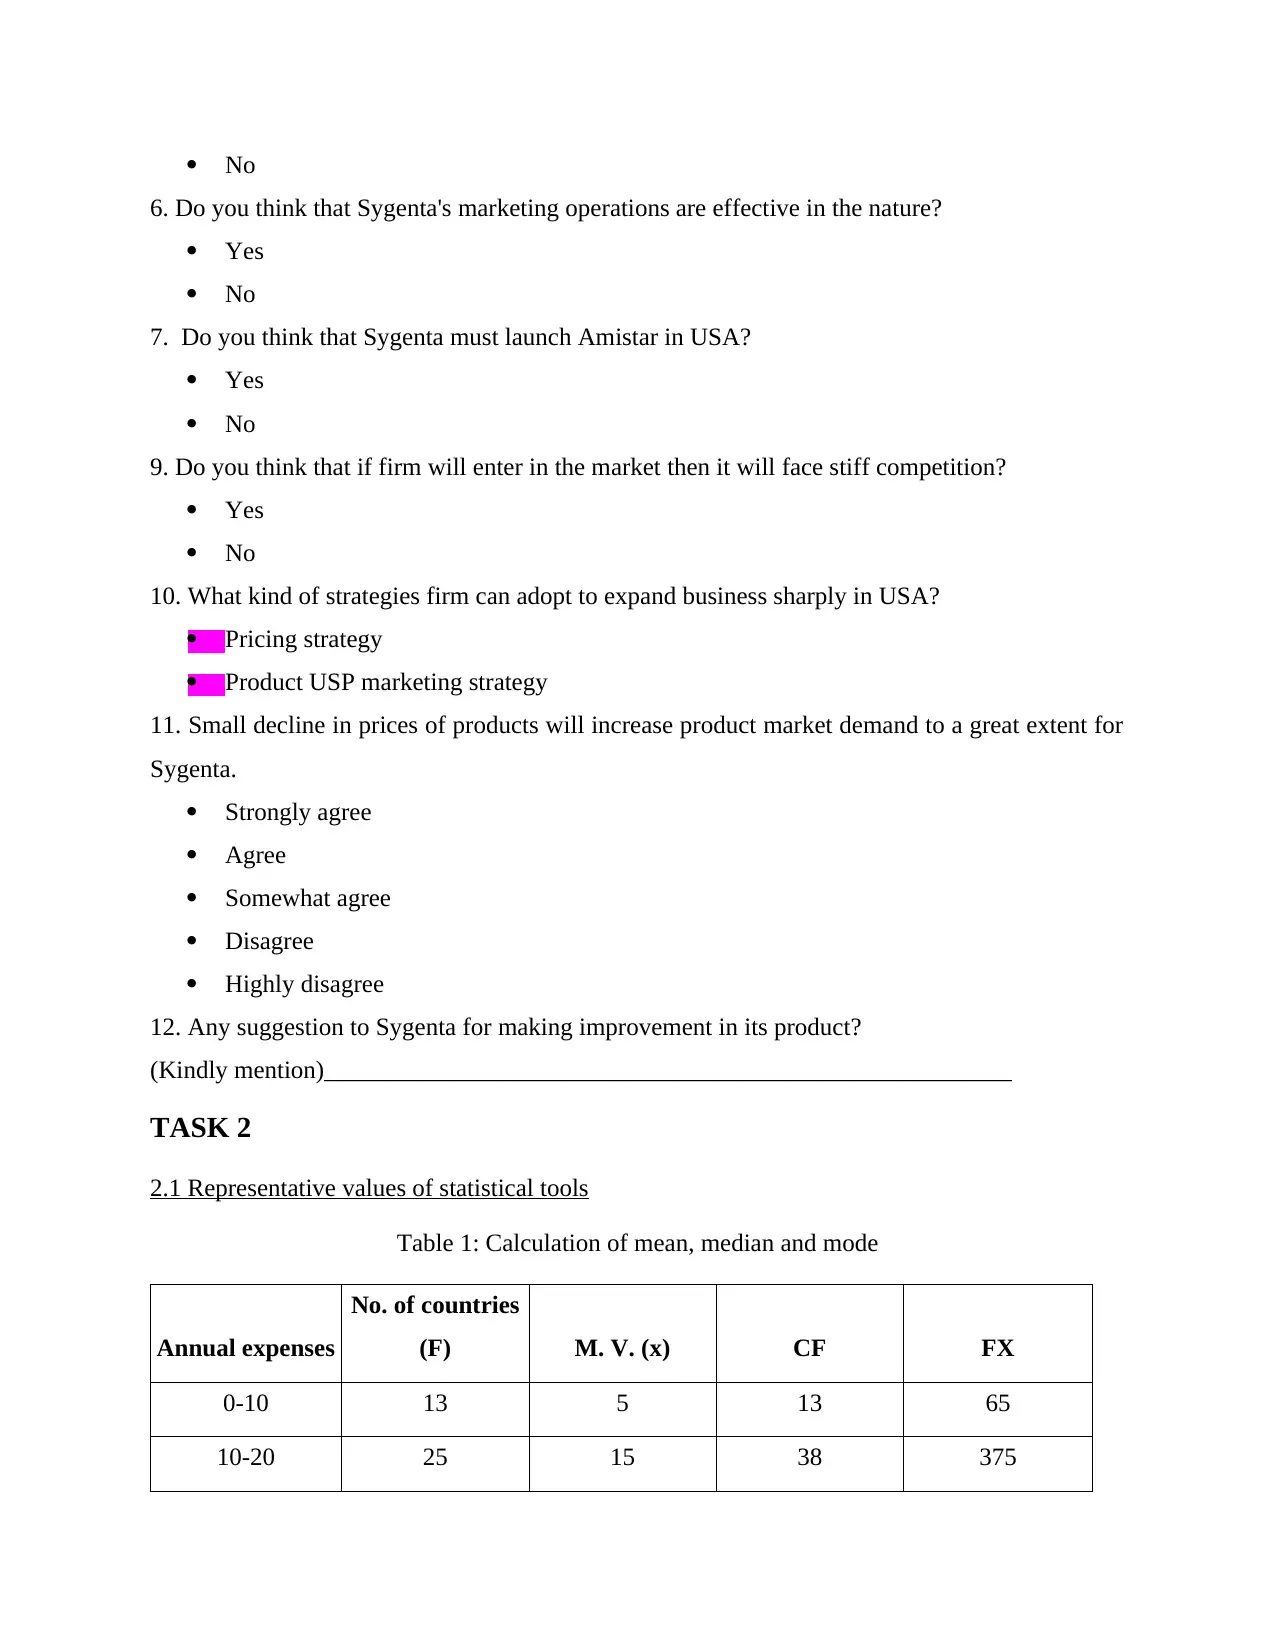
6. Do you think that Sygenta's marketing operations are effective in the nature?
Yes
No
7. Do you think that Sygenta must launch Amistar in USA?
Yes
No
9. Do you think that if firm will enter in the market then it will face stiff competition?
Yes
No
10. What kind of strategies firm can adopt to expand business sharply in USA?
Pricing strategy
Product USP marketing strategy
11. Small decline in prices of products will increase product market demand to a great extent for
Sygenta.
Strongly agree
Agree
Somewhat agree
Disagree
Highly disagree
12. Any suggestion to Sygenta for making improvement in its product?
(Kindly mention)_______________________________________________________
TASK 2
2.1 Representative values of statistical tools
Table 1: Calculation of mean, median and mode
Annual expenses
No. of countries
(F) M. V. (x) CF FX
0-10 13 5 13 65
10-20 25 15 38 375
⊘ This is a preview!⊘
Do you want full access?
Subscribe today to unlock all pages.
Trusted by 1+ million students worldwide
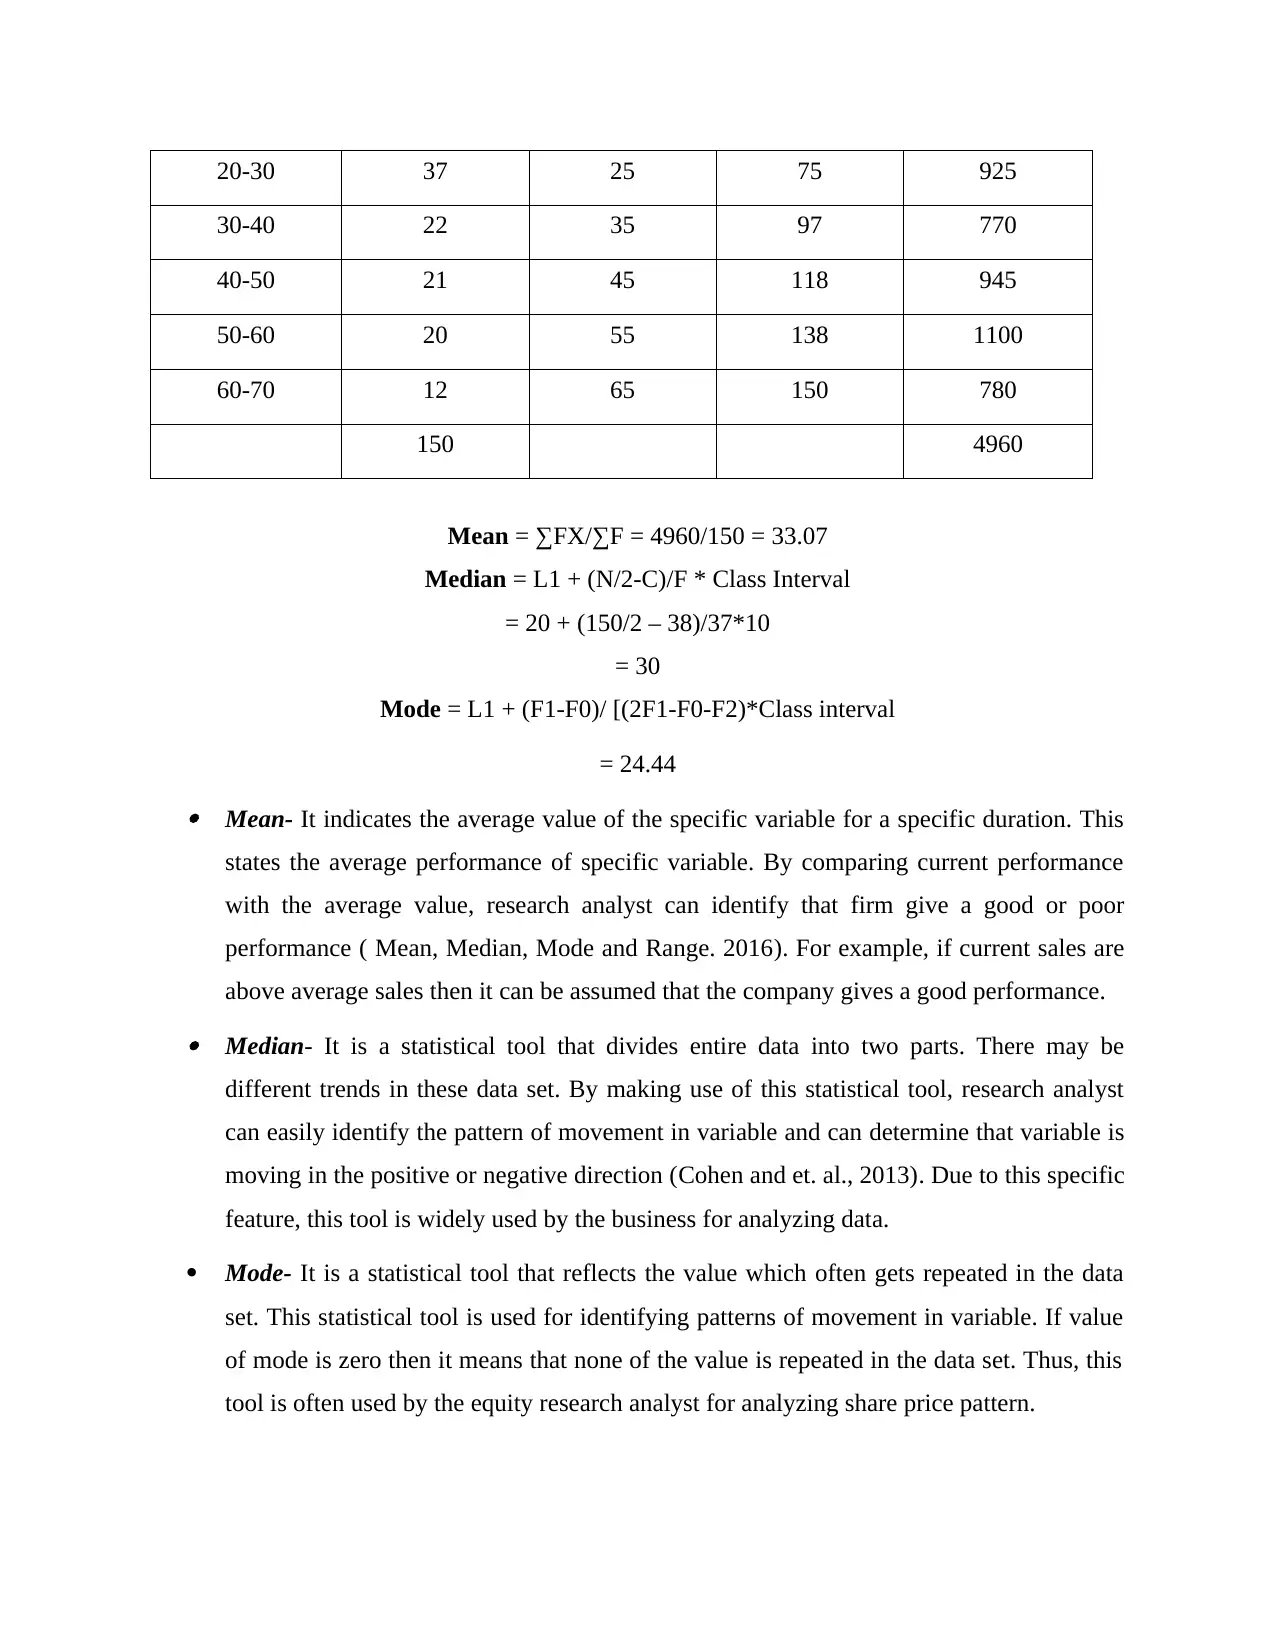
20-30 37 25 75 925
30-40 22 35 97 770
40-50 21 45 118 945
50-60 20 55 138 1100
60-70 12 65 150 780
150 4960
Mean = ∑FX/∑F = 4960/150 = 33.07
Median = L1 + (N/2-C)/F * Class Interval
= 20 + (150/2 – 38)/37*10
= 30
Mode = L1 + (F1-F0)/ [(2F1-F0-F2)*Class interval
= 24.44 Mean- It indicates the average value of the specific variable for a specific duration. This
states the average performance of specific variable. By comparing current performance
with the average value, research analyst can identify that firm give a good or poor
performance ( Mean, Median, Mode and Range. 2016). For example, if current sales are
above average sales then it can be assumed that the company gives a good performance. Median- It is a statistical tool that divides entire data into two parts. There may be
different trends in these data set. By making use of this statistical tool, research analyst
can easily identify the pattern of movement in variable and can determine that variable is
moving in the positive or negative direction (Cohen and et. al., 2013). Due to this specific
feature, this tool is widely used by the business for analyzing data.
Mode- It is a statistical tool that reflects the value which often gets repeated in the data
set. This statistical tool is used for identifying patterns of movement in variable. If value
of mode is zero then it means that none of the value is repeated in the data set. Thus, this
tool is often used by the equity research analyst for analyzing share price pattern.
Paraphrase This Document
Need a fresh take? Get an instant paraphrase of this document with our AI Paraphraser
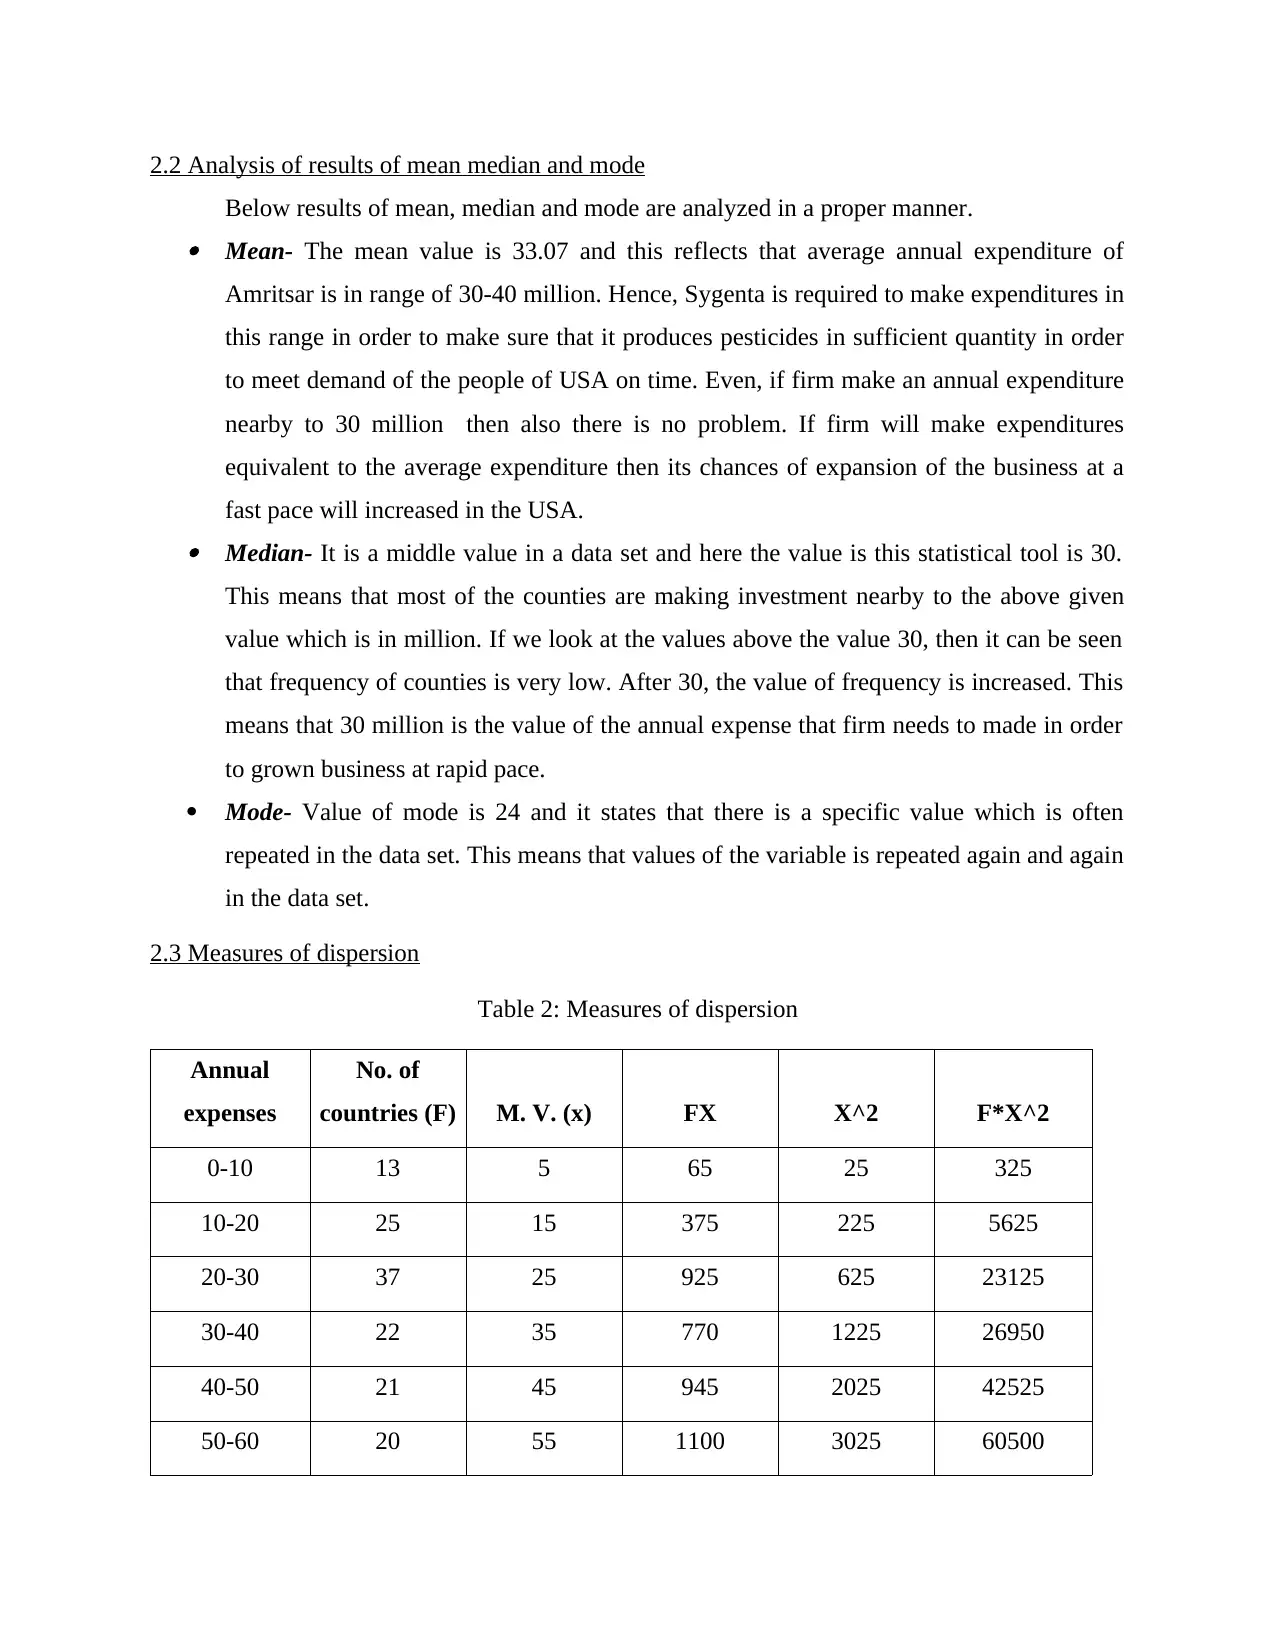
2.2 Analysis of results of mean median and mode
Below results of mean, median and mode are analyzed in a proper manner. Mean- The mean value is 33.07 and this reflects that average annual expenditure of
Amritsar is in range of 30-40 million. Hence, Sygenta is required to make expenditures in
this range in order to make sure that it produces pesticides in sufficient quantity in order
to meet demand of the people of USA on time. Even, if firm make an annual expenditure
nearby to 30 million then also there is no problem. If firm will make expenditures
equivalent to the average expenditure then its chances of expansion of the business at a
fast pace will increased in the USA. Median- It is a middle value in a data set and here the value is this statistical tool is 30.
This means that most of the counties are making investment nearby to the above given
value which is in million. If we look at the values above the value 30, then it can be seen
that frequency of counties is very low. After 30, the value of frequency is increased. This
means that 30 million is the value of the annual expense that firm needs to made in order
to grown business at rapid pace.
Mode- Value of mode is 24 and it states that there is a specific value which is often
repeated in the data set. This means that values of the variable is repeated again and again
in the data set.
2.3 Measures of dispersion
Table 2: Measures of dispersion
Annual
expenses
No. of
countries (F) M. V. (x) FX X^2 F*X^2
0-10 13 5 65 25 325
10-20 25 15 375 225 5625
20-30 37 25 925 625 23125
30-40 22 35 770 1225 26950
40-50 21 45 945 2025 42525
50-60 20 55 1100 3025 60500
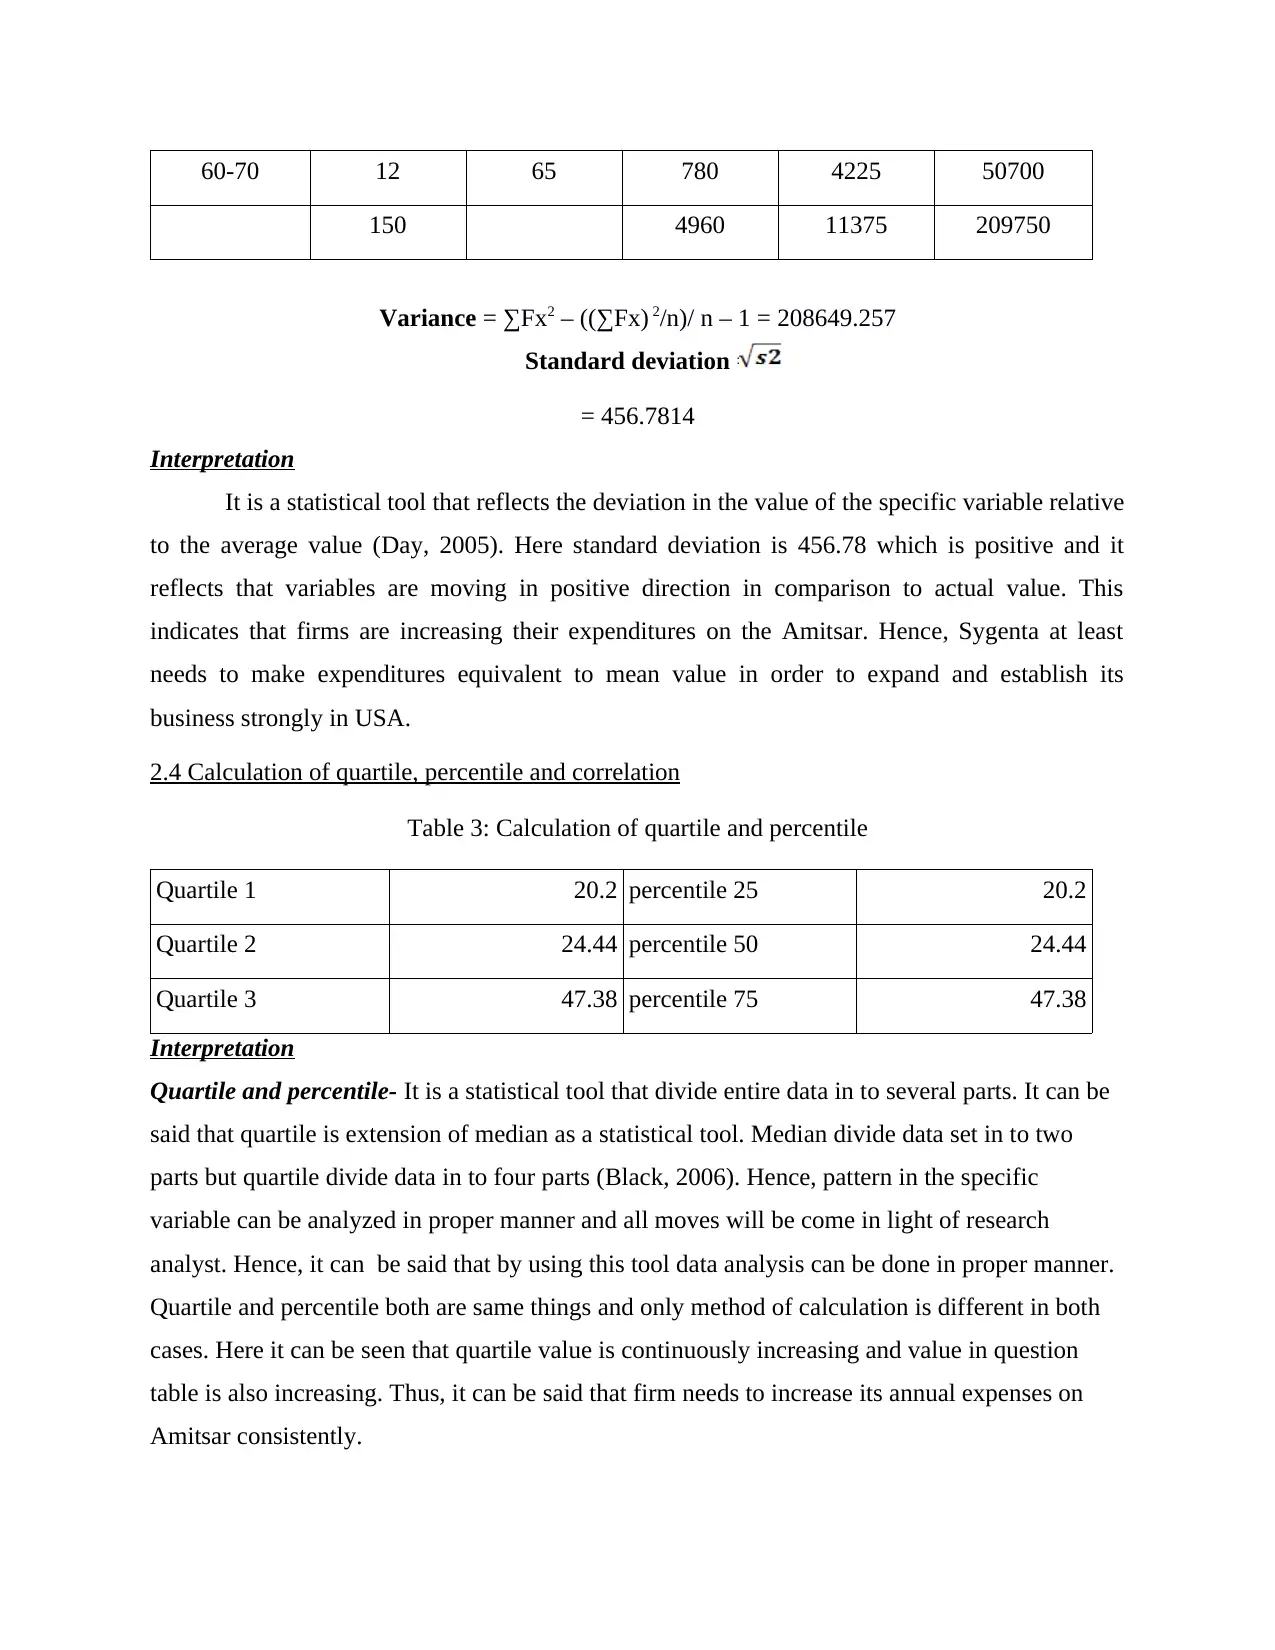
60-70 12 65 780 4225 50700
150 4960 11375 209750
Variance = ∑Fx2 – ((∑Fx) 2/n)/ n – 1 = 208649.257
Standard deviation =
= 456.7814
Interpretation
It is a statistical tool that reflects the deviation in the value of the specific variable relative
to the average value (Day, 2005). Here standard deviation is 456.78 which is positive and it
reflects that variables are moving in positive direction in comparison to actual value. This
indicates that firms are increasing their expenditures on the Amitsar. Hence, Sygenta at least
needs to make expenditures equivalent to mean value in order to expand and establish its
business strongly in USA.
2.4 Calculation of quartile, percentile and correlation
Table 3: Calculation of quartile and percentile
Quartile 1 20.2 percentile 25 20.2
Quartile 2 24.44 percentile 50 24.44
Quartile 3 47.38 percentile 75 47.38
Interpretation
Quartile and percentile- It is a statistical tool that divide entire data in to several parts. It can be
said that quartile is extension of median as a statistical tool. Median divide data set in to two
parts but quartile divide data in to four parts (Black, 2006). Hence, pattern in the specific
variable can be analyzed in proper manner and all moves will be come in light of research
analyst. Hence, it can be said that by using this tool data analysis can be done in proper manner.
Quartile and percentile both are same things and only method of calculation is different in both
cases. Here it can be seen that quartile value is continuously increasing and value in question
table is also increasing. Thus, it can be said that firm needs to increase its annual expenses on
Amitsar consistently.
⊘ This is a preview!⊘
Do you want full access?
Subscribe today to unlock all pages.
Trusted by 1+ million students worldwide
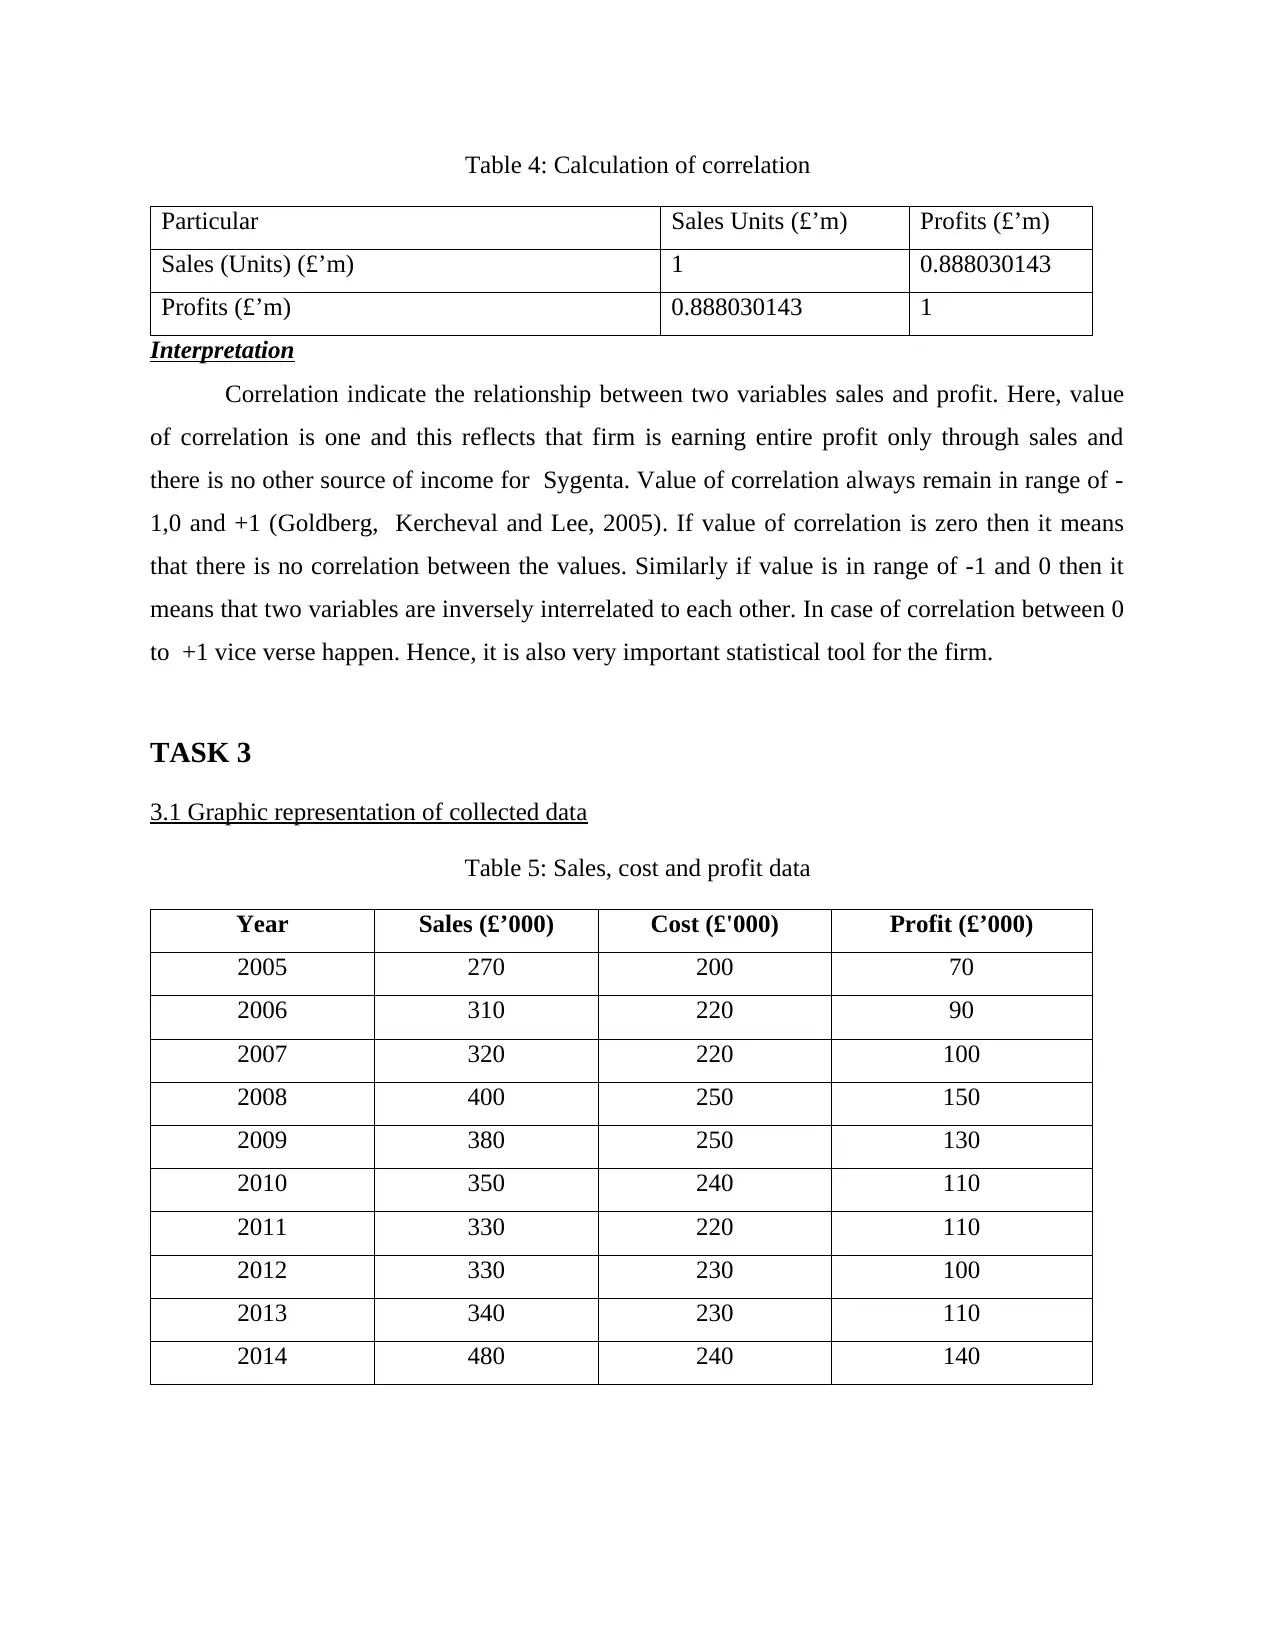
Table 4: Calculation of correlation
Particular Sales Units (£’m) Profits (£’m)
Sales (Units) (£’m) 1 0.888030143
Profits (£’m) 0.888030143 1
Interpretation
Correlation indicate the relationship between two variables sales and profit. Here, value
of correlation is one and this reflects that firm is earning entire profit only through sales and
there is no other source of income for Sygenta. Value of correlation always remain in range of -
1,0 and +1 (Goldberg, Kercheval and Lee, 2005). If value of correlation is zero then it means
that there is no correlation between the values. Similarly if value is in range of -1 and 0 then it
means that two variables are inversely interrelated to each other. In case of correlation between 0
to +1 vice verse happen. Hence, it is also very important statistical tool for the firm.
TASK 3
3.1 Graphic representation of collected data
Table 5: Sales, cost and profit data
Year Sales (£’000) Cost (£'000) Profit (£’000)
2005 270 200 70
2006 310 220 90
2007 320 220 100
2008 400 250 150
2009 380 250 130
2010 350 240 110
2011 330 220 110
2012 330 230 100
2013 340 230 110
2014 480 240 140
Paraphrase This Document
Need a fresh take? Get an instant paraphrase of this document with our AI Paraphraser
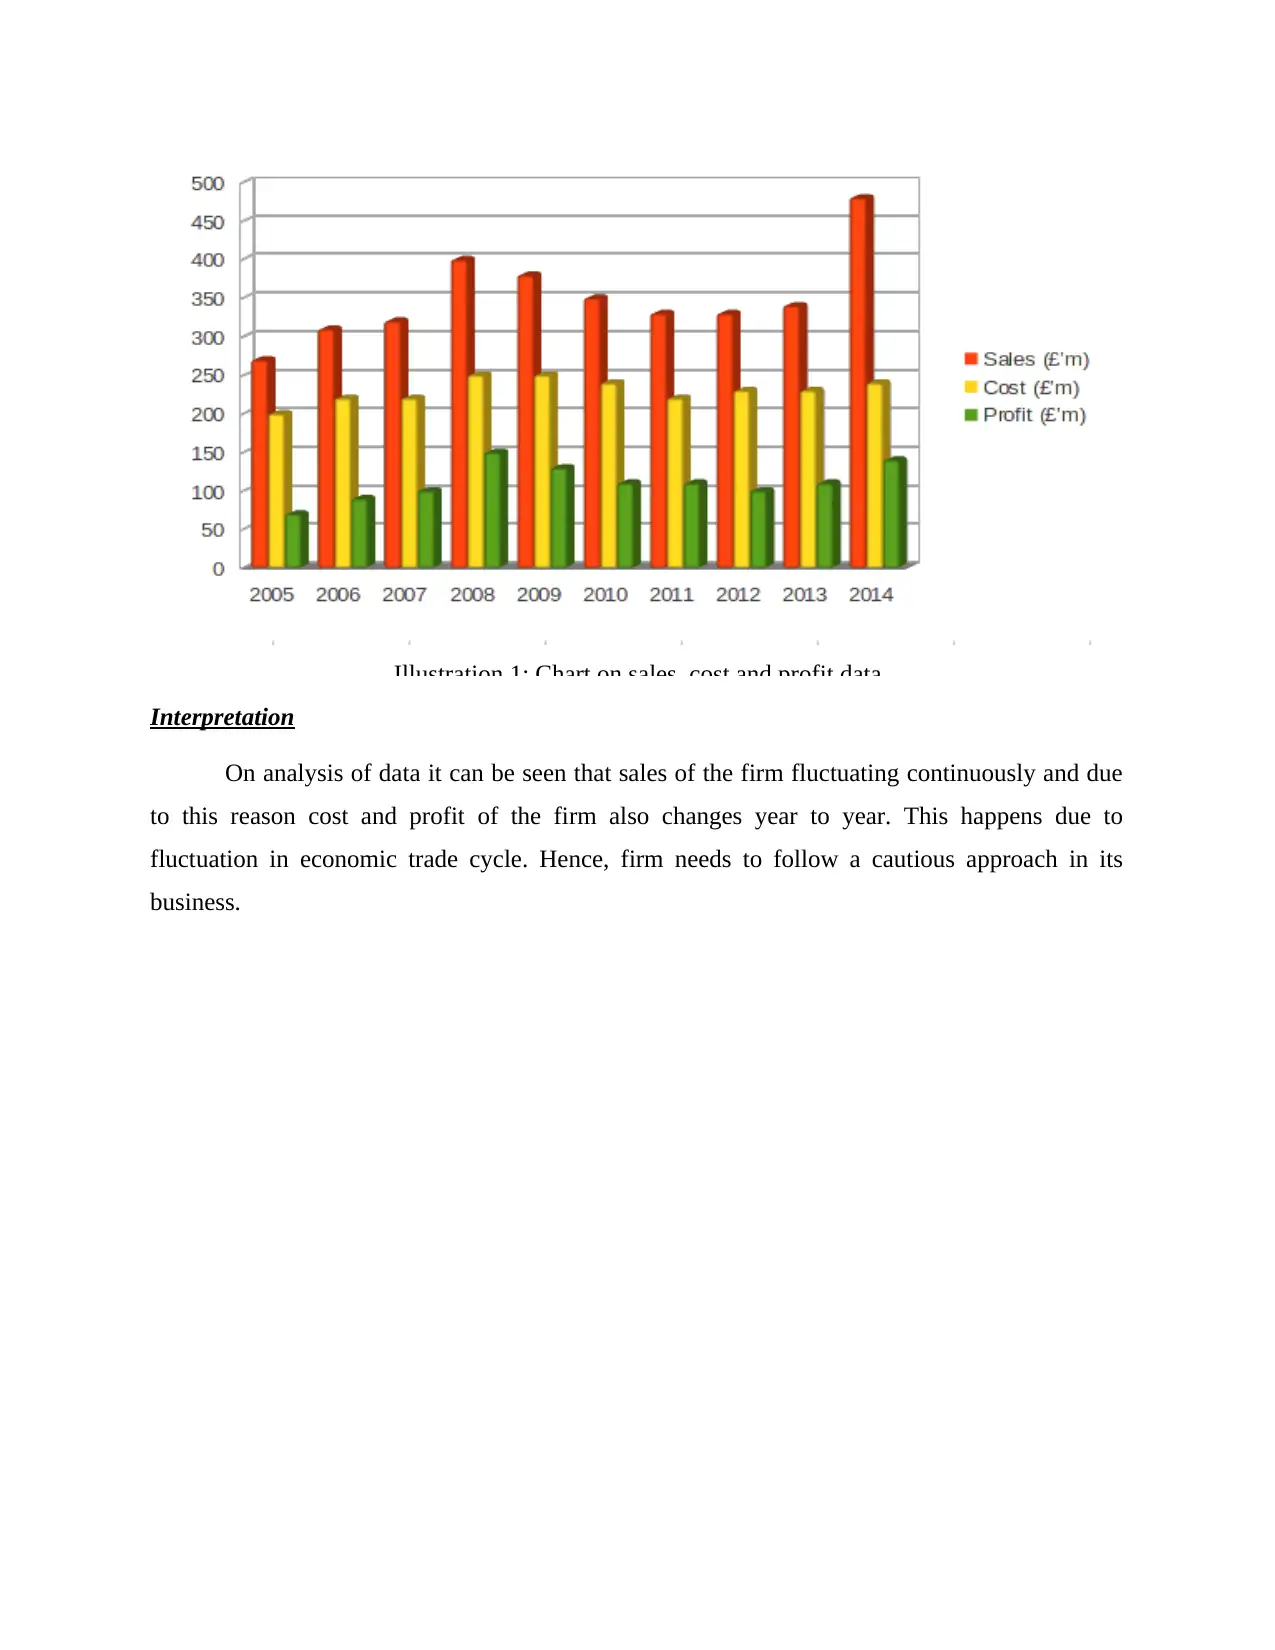
Illustration 1: Chart on sales, cost and profit data
Interpretation
On analysis of data it can be seen that sales of the firm fluctuating continuously and due
to this reason cost and profit of the firm also changes year to year. This happens due to
fluctuation in economic trade cycle. Hence, firm needs to follow a cautious approach in its
business.
Interpretation
On analysis of data it can be seen that sales of the firm fluctuating continuously and due
to this reason cost and profit of the firm also changes year to year. This happens due to
fluctuation in economic trade cycle. Hence, firm needs to follow a cautious approach in its
business.
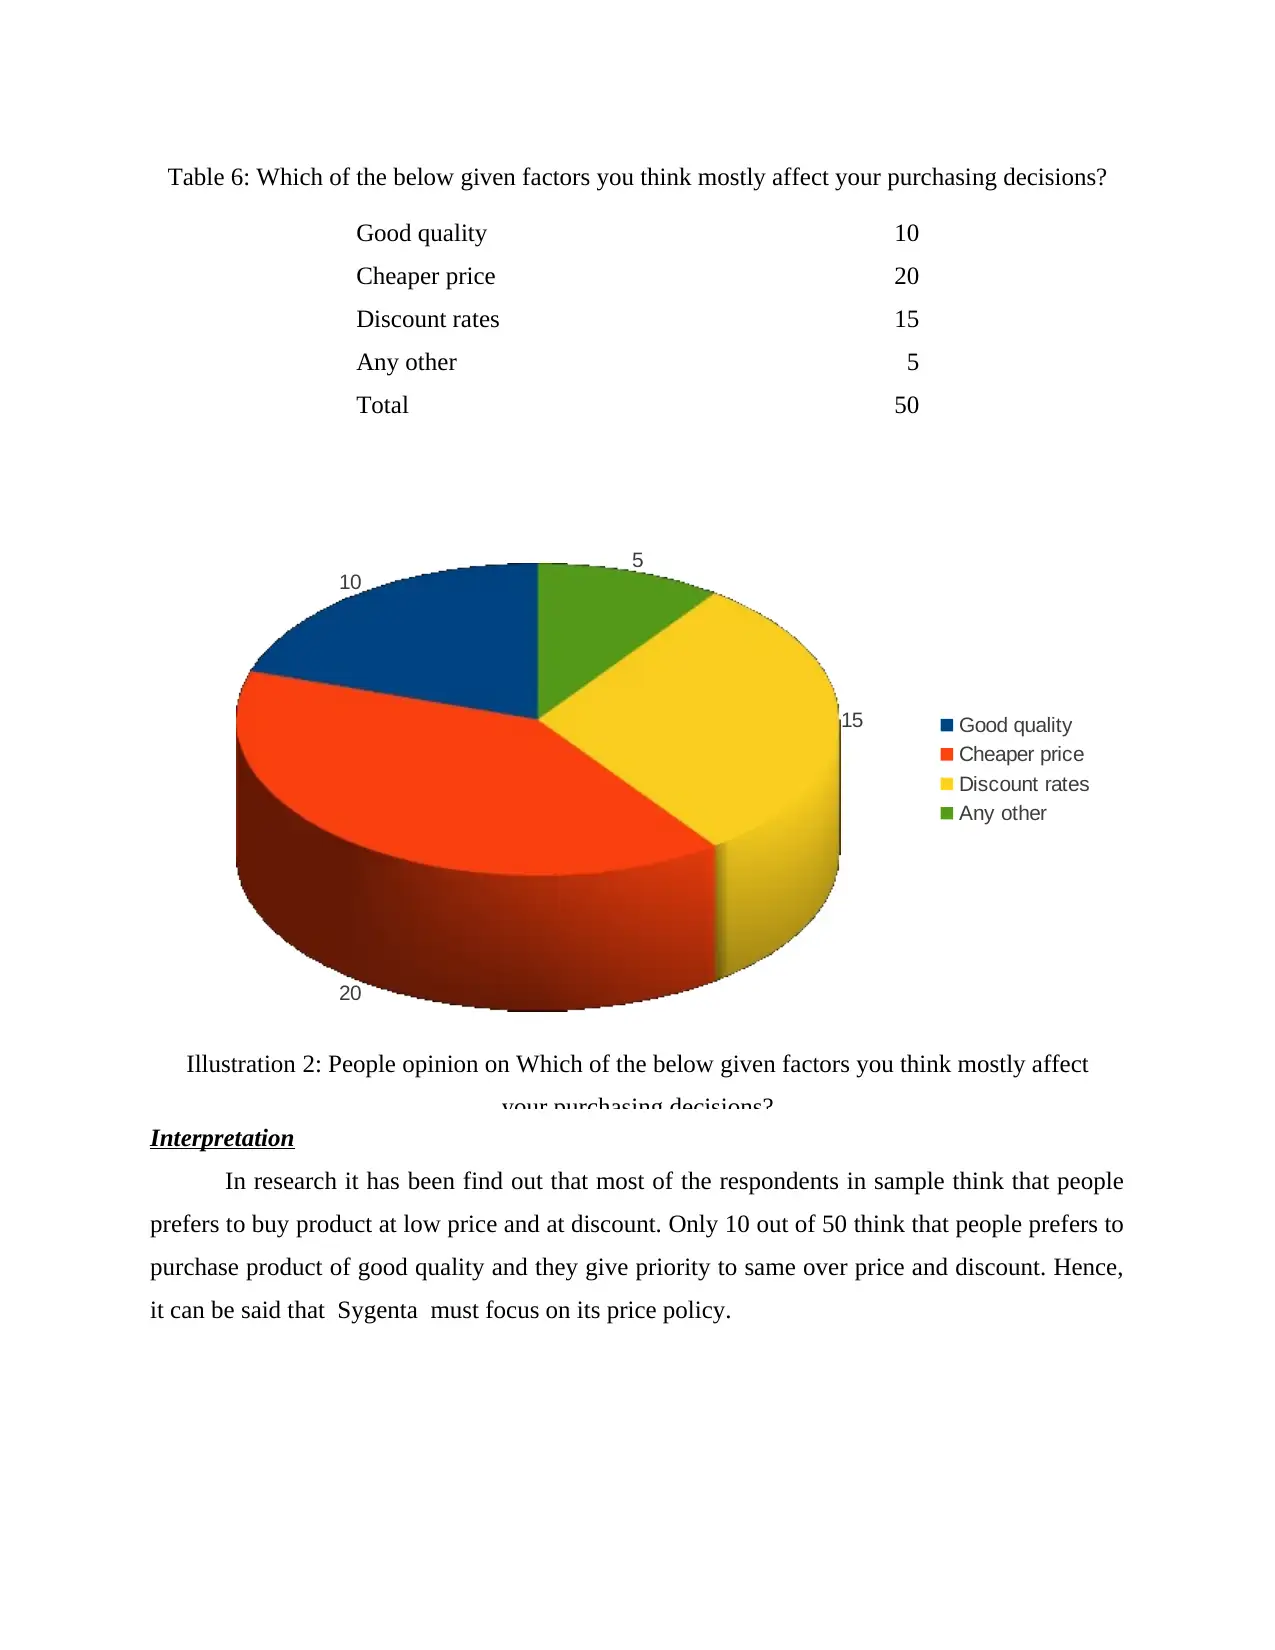
Table 6: Which of the below given factors you think mostly affect your purchasing decisions?
Good quality 10
Cheaper price 20
Discount rates 15
Any other 5
Total 50
Interpretation
In research it has been find out that most of the respondents in sample think that people
prefers to buy product at low price and at discount. Only 10 out of 50 think that people prefers to
purchase product of good quality and they give priority to same over price and discount. Hence,
it can be said that Sygenta must focus on its price policy.
10
20
15
5
Good quality
Cheaper price
Discount rates
Any other
Illustration 2: People opinion on Which of the below given factors you think mostly affect
your purchasing decisions?
⊘ This is a preview!⊘
Do you want full access?
Subscribe today to unlock all pages.
Trusted by 1+ million students worldwide
1 out of 21
Related Documents


Your All-in-One AI-Powered Toolkit for Academic Success.
+13062052269
info@desklib.com
Available 24*7 on WhatsApp / Email
![[object Object]](/_next/static/media/star-bottom.7253800d.svg)
Unlock your academic potential
Copyright © 2020–2026 A2Z Services. All Rights Reserved. Developed and managed by ZUCOL.