Analyzing Customer Complaints: A Business Research Methodology Report
VerifiedAdded on  2022/12/09
|12
|1792
|74
Report
AI Summary
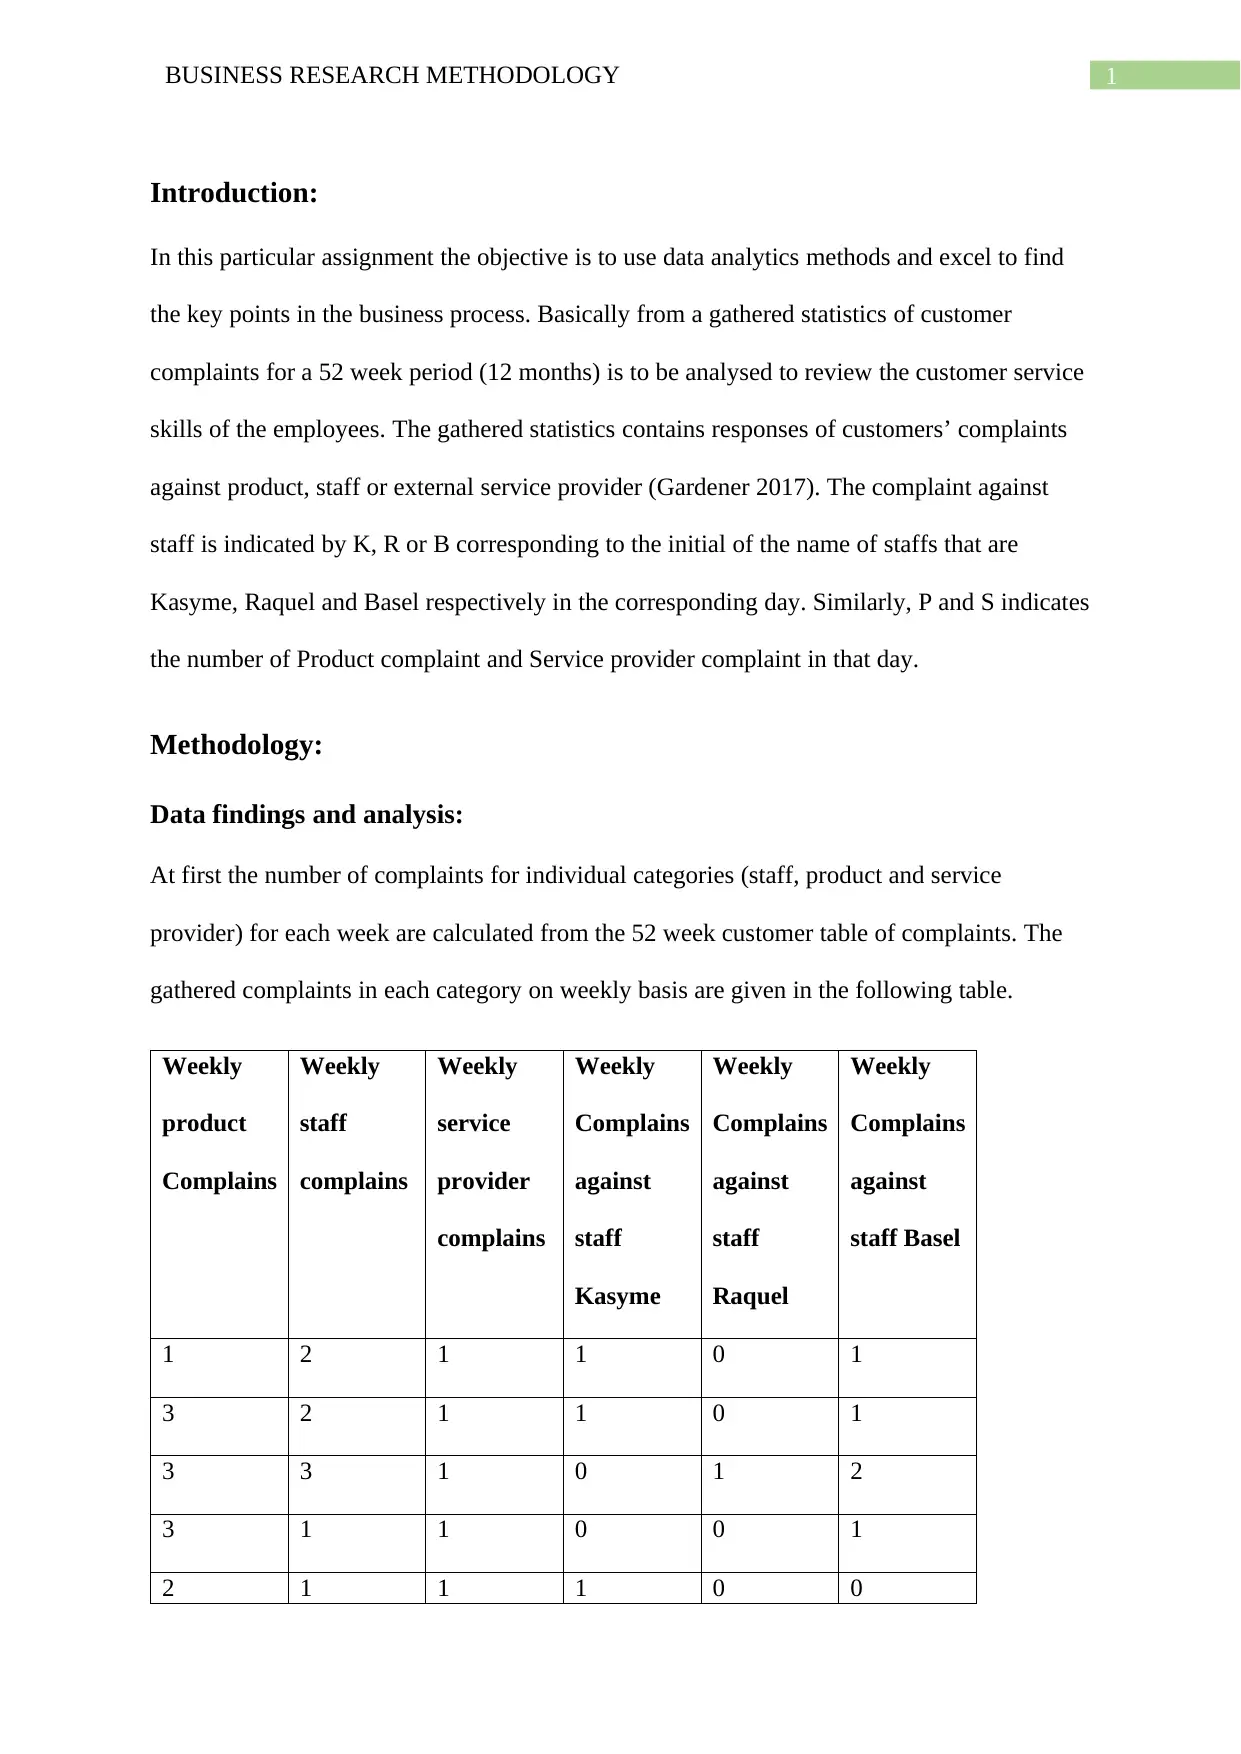
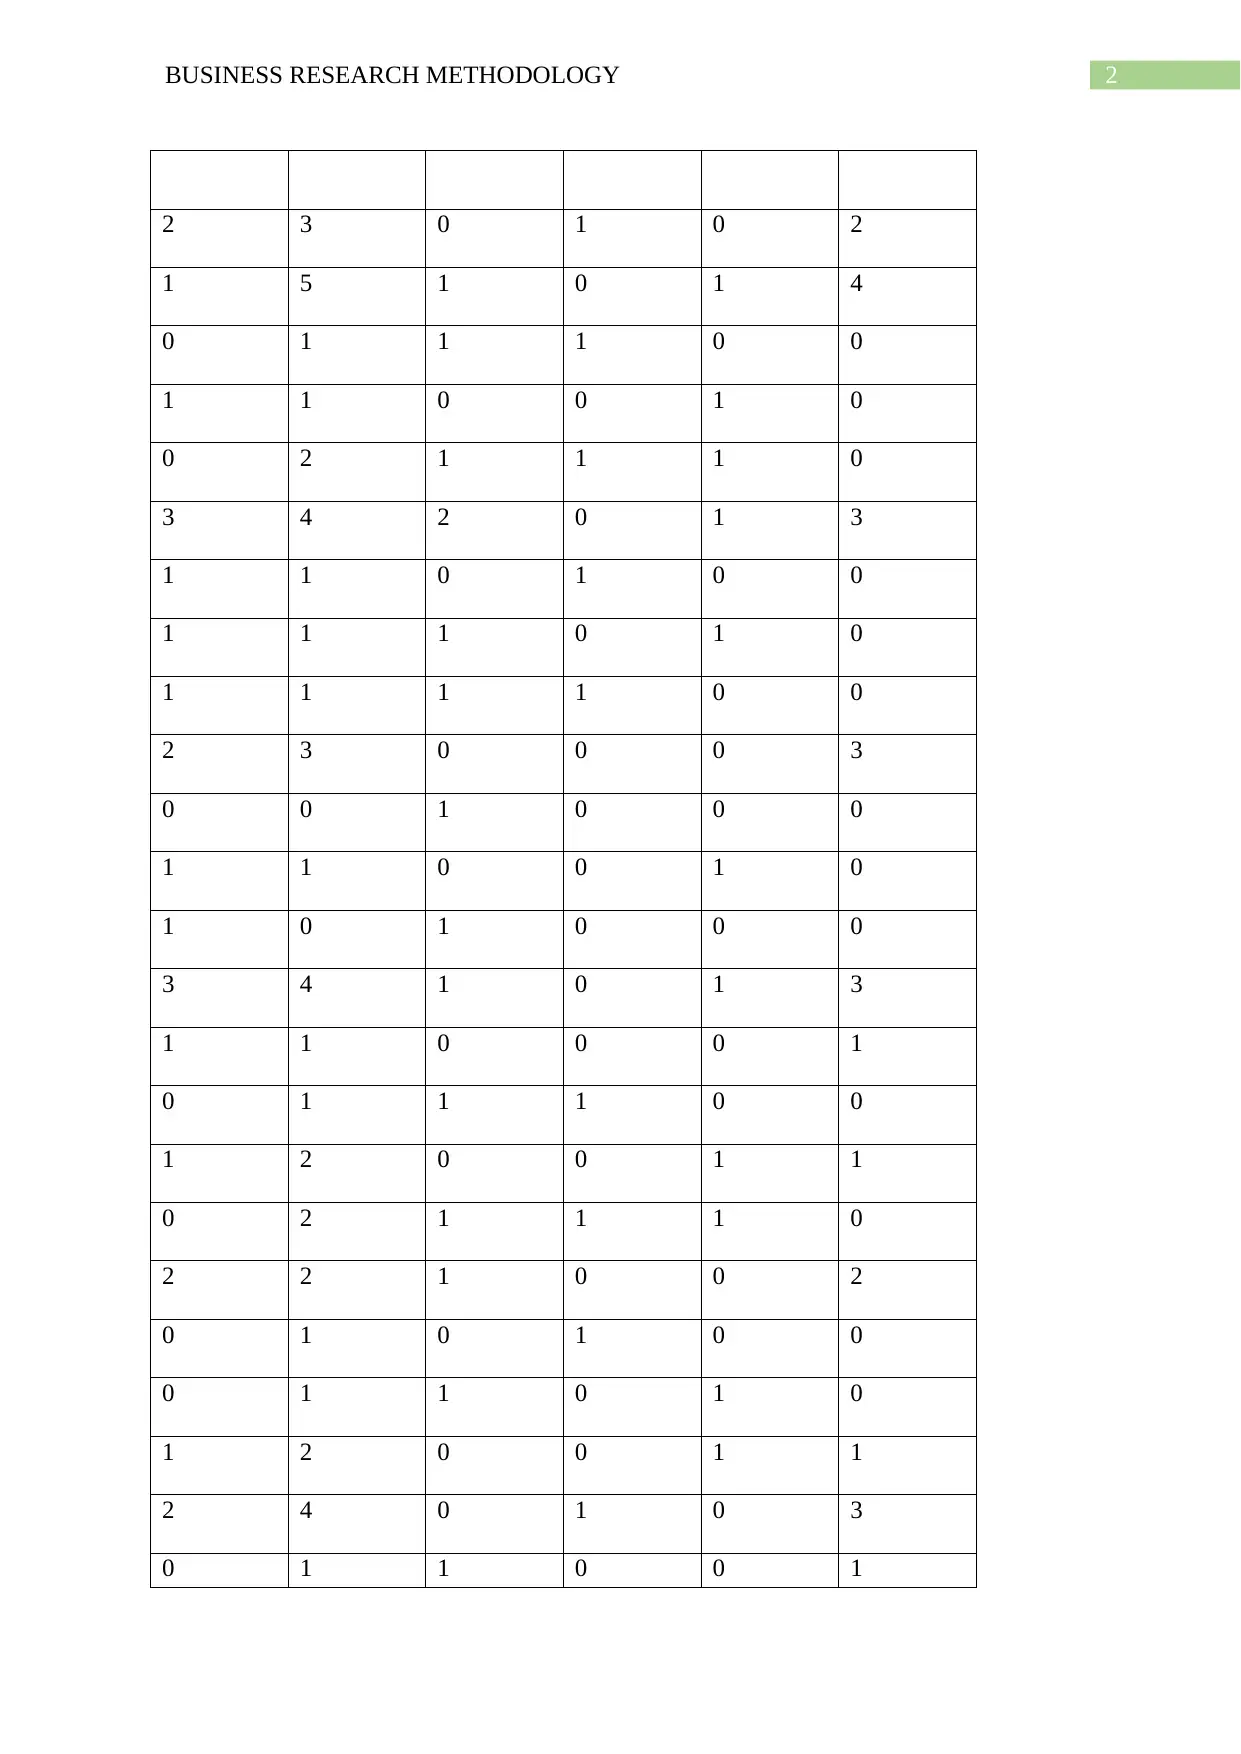
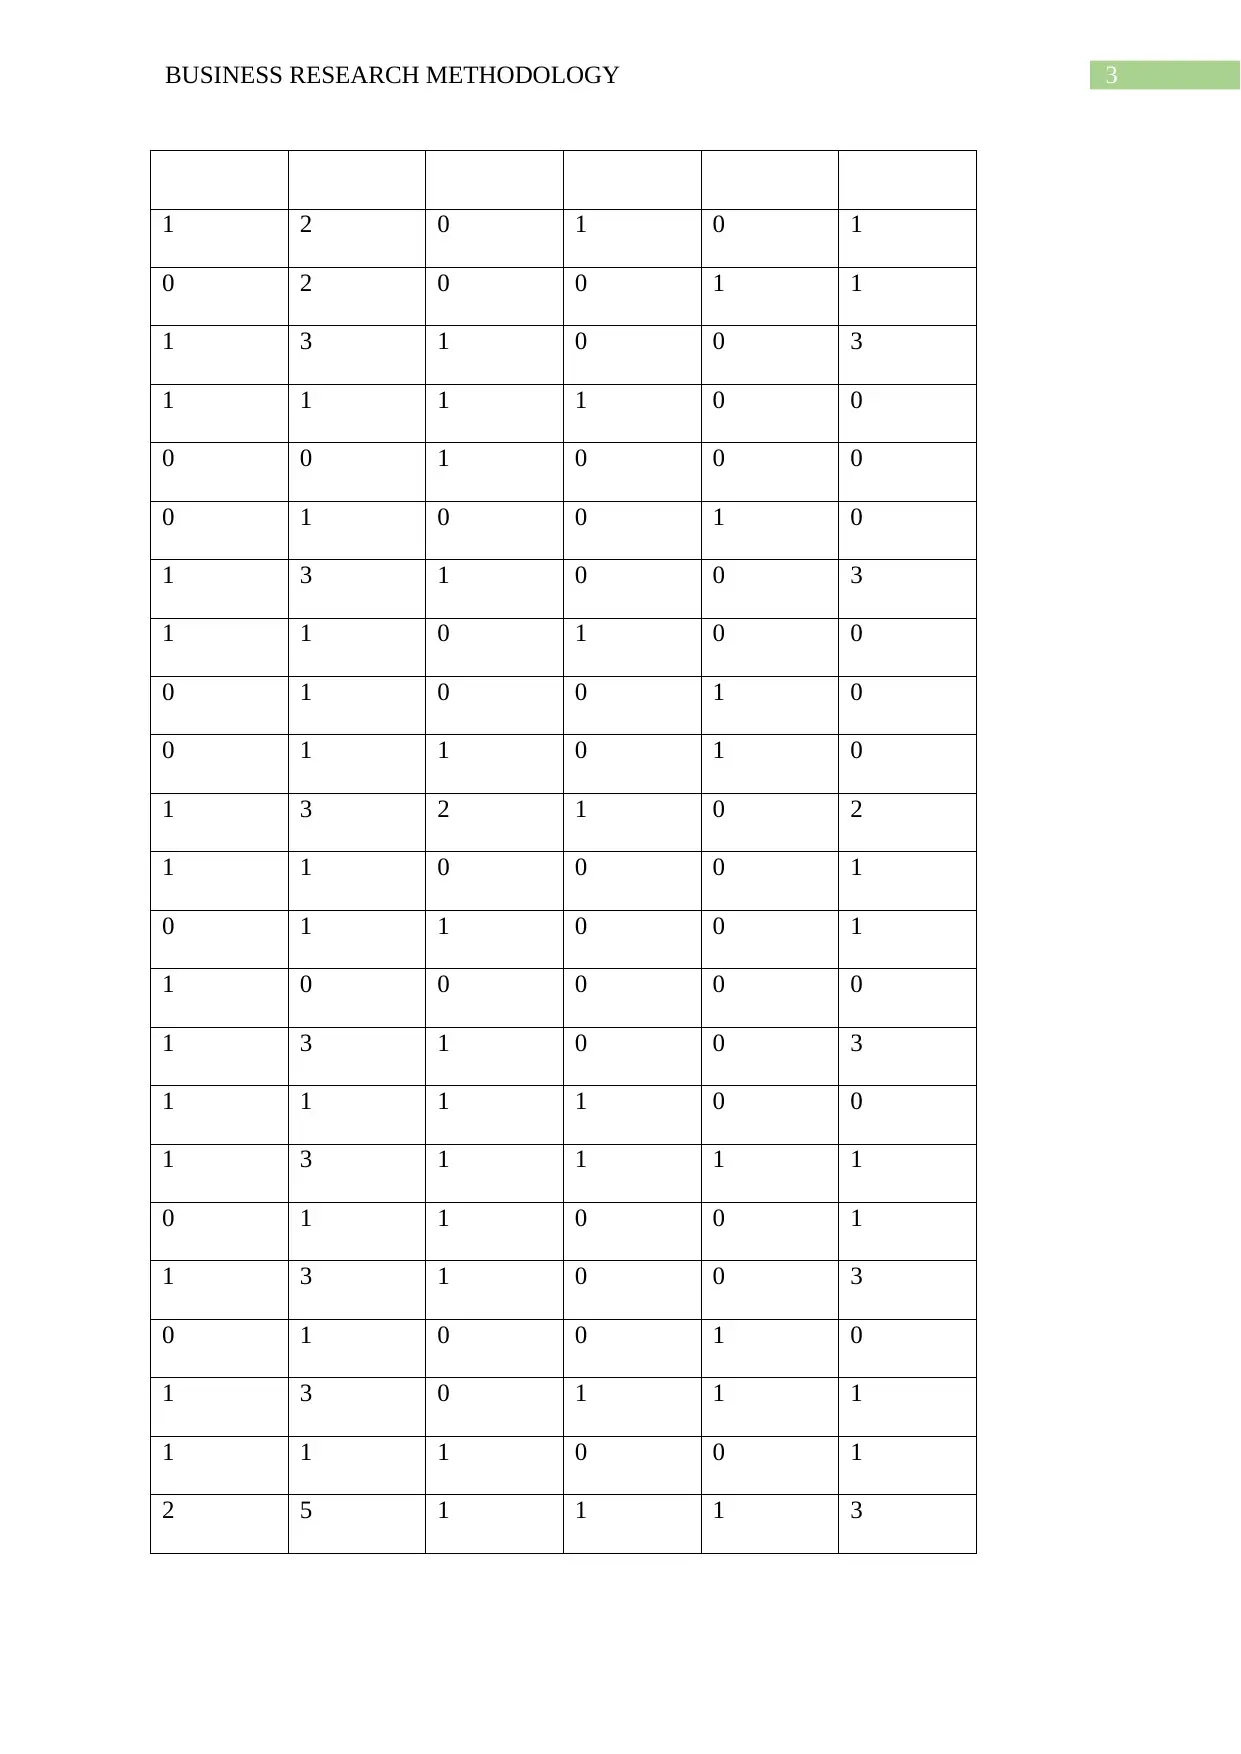
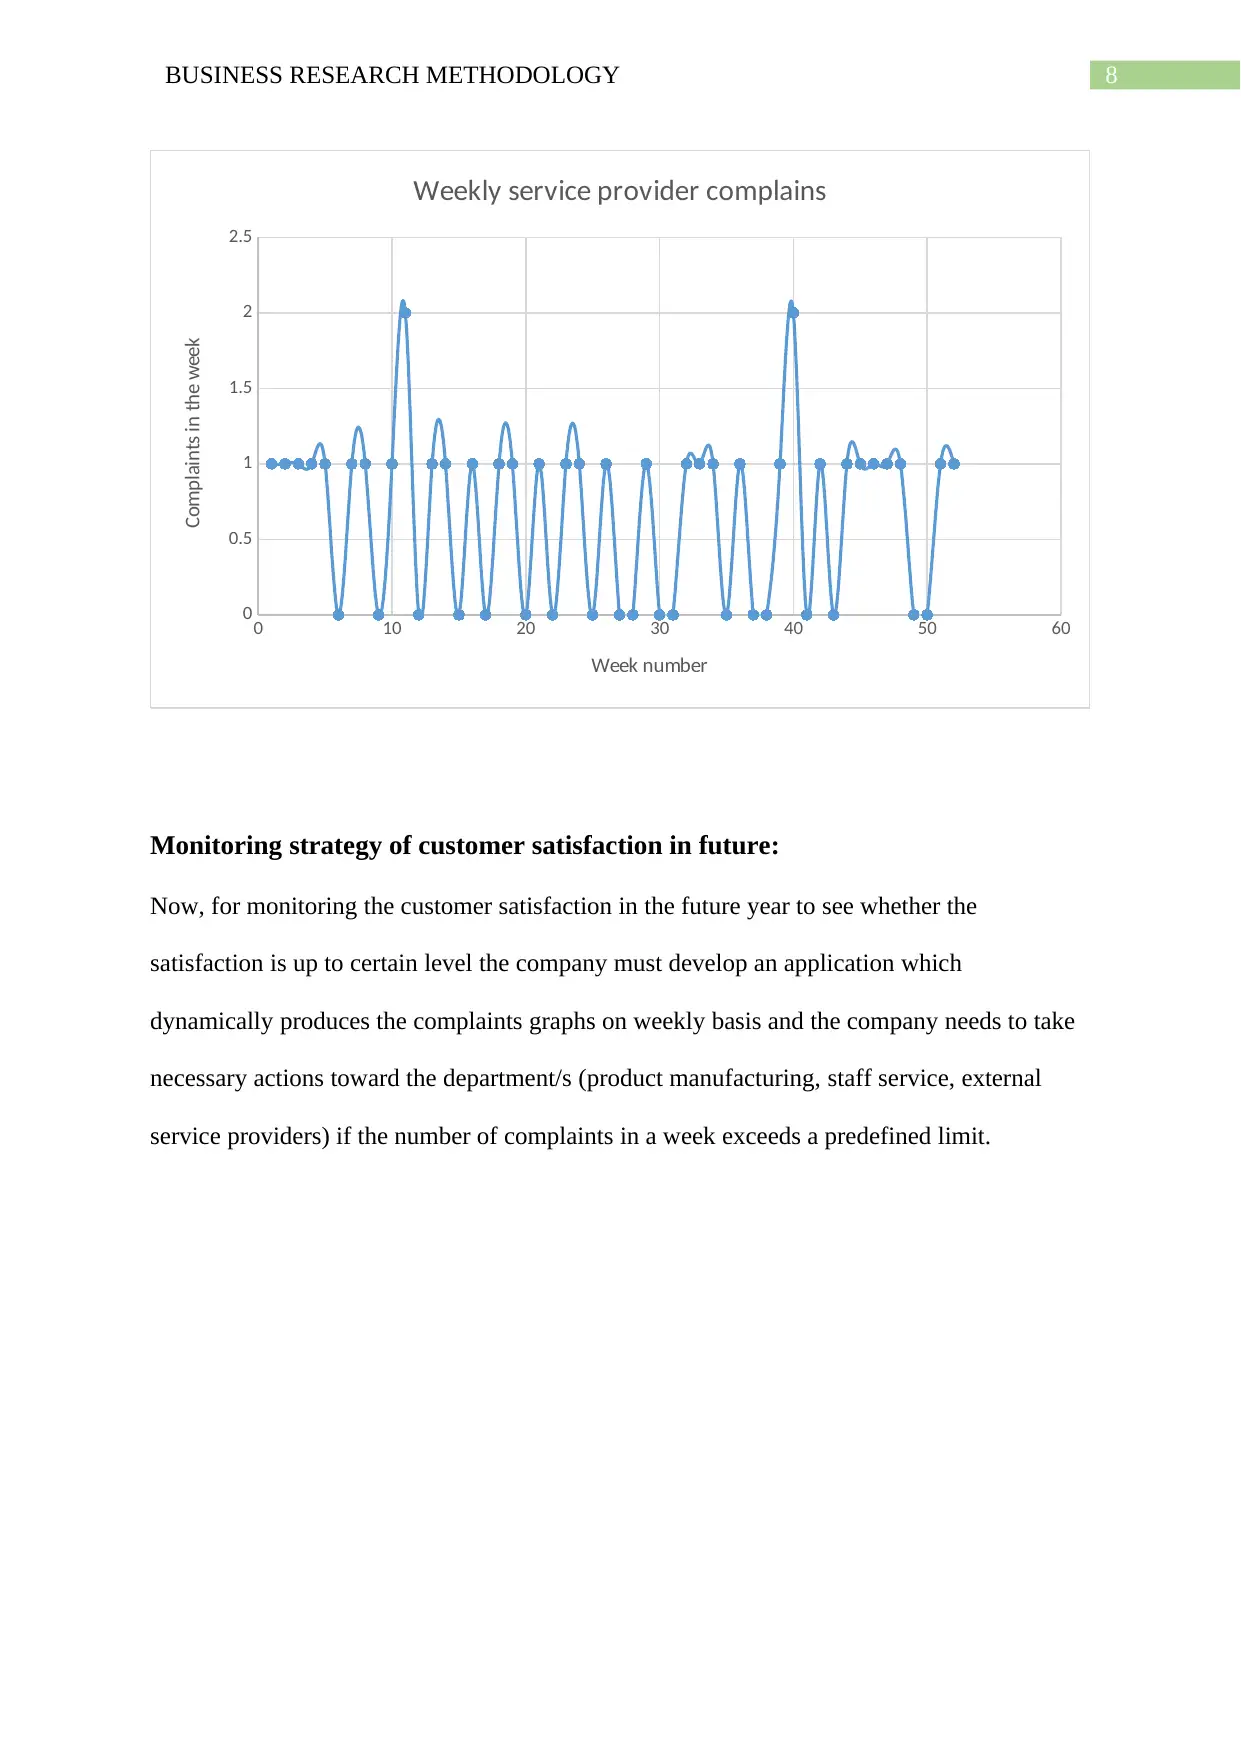
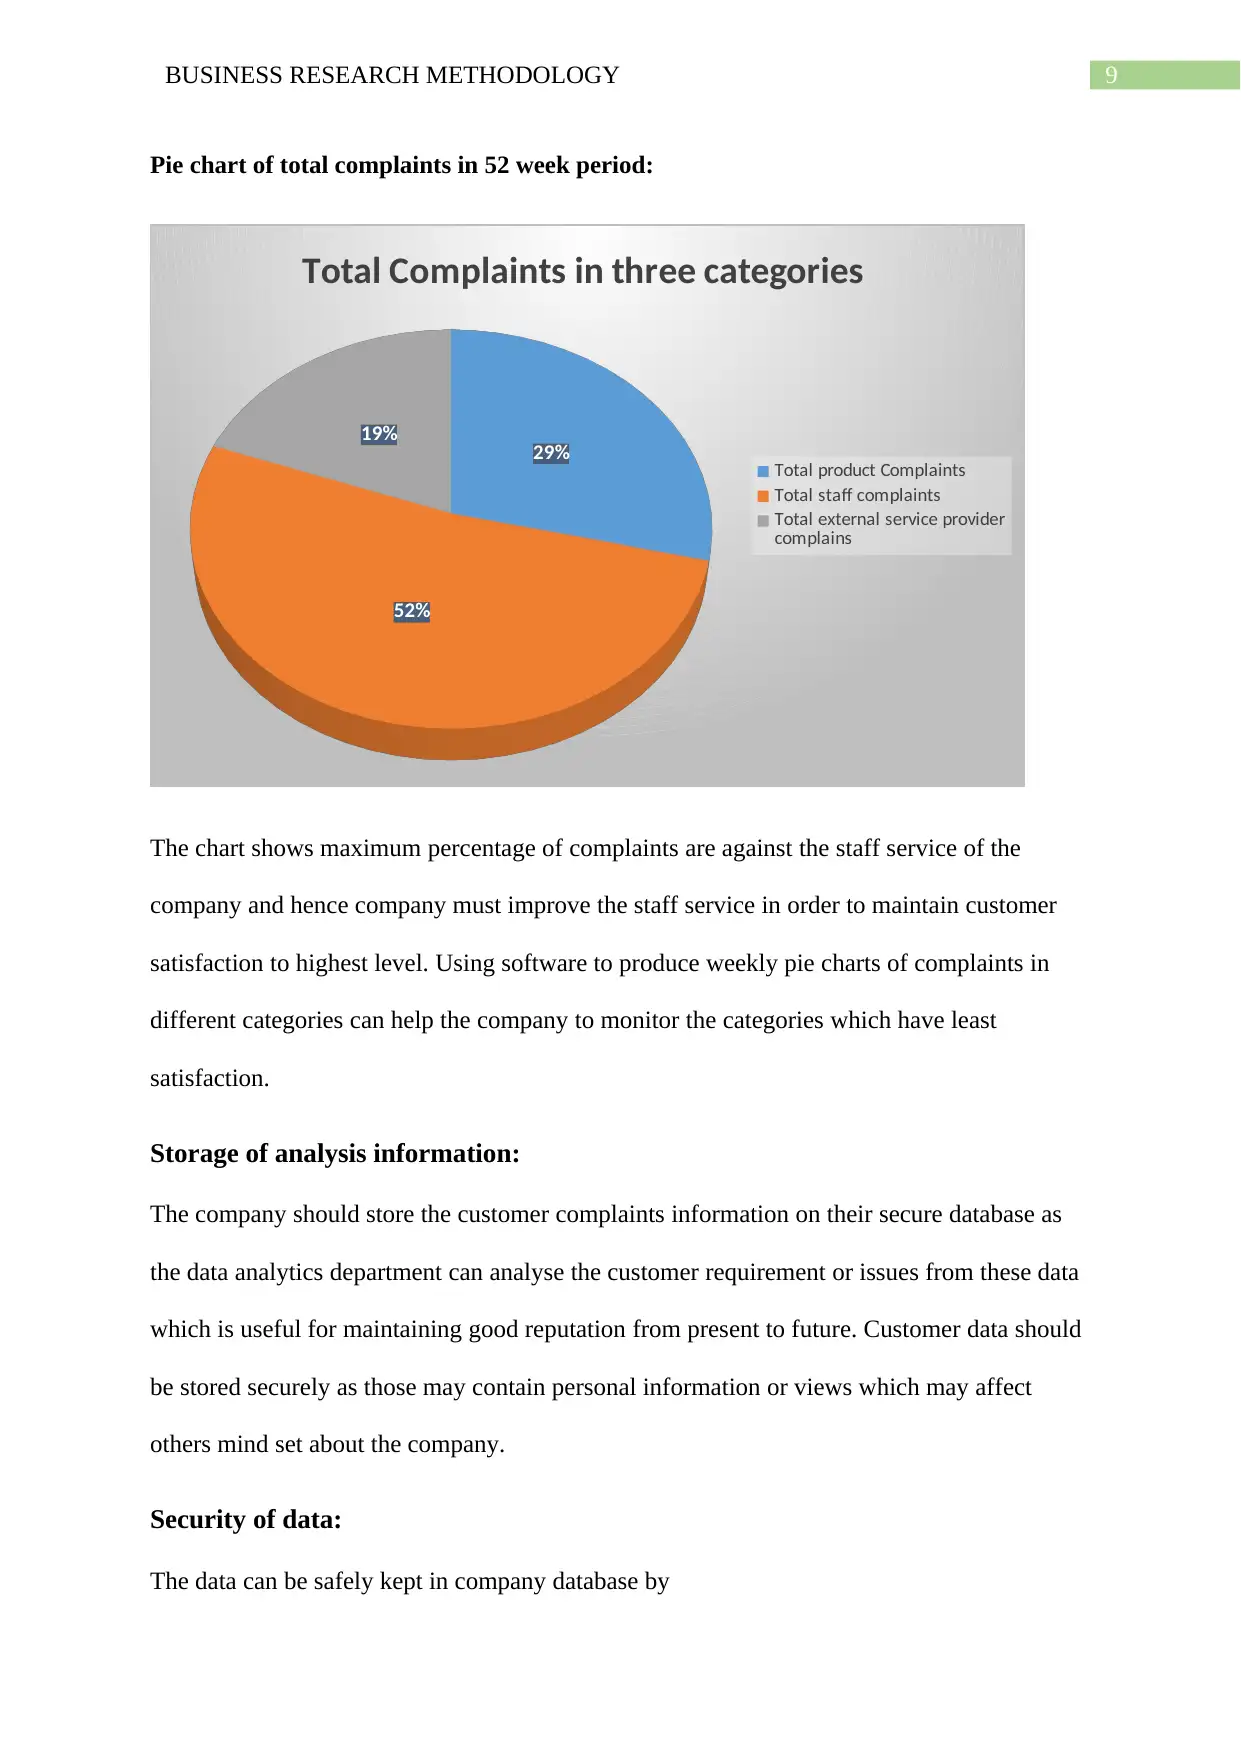
This report presents an analysis of customer complaints collected over a 52-week period, aiming to evaluate employee customer service skills. The methodology involves calculating weekly complaints for product, staff, and service provider categories. Descriptive statistics and ANOVA tests are applied to identify trends and significant differences. The analysis reveals that staff-related complaints, particularly against one staff member, are the most frequent. The report recommends improvements in staff training and product quality, and suggests a system for monitoring customer satisfaction. Data analysis methods used include Excel functions, descriptive statistics, ANOVA, and graphical representations. Security measures for storing customer data are also discussed. The findings underscore the importance of addressing staff performance and product issues to enhance customer satisfaction.

Running head: BUSINESS RESEARCH METHODOLOGY
BUSINESS RESEARCH METHODOLOGY
Name of the Student
Name of the University
Author Note
BUSINESS RESEARCH METHODOLOGY
Name of the Student
Name of the University
Author Note
Paraphrase This Document
Need a fresh take? Get an instant paraphrase of this document with our AI Paraphraser

1BUSINESS RESEARCH METHODOLOGY
Introduction:
In this particular assignment the objective is to use data analytics methods and excel to find
the key points in the business process. Basically from a gathered statistics of customer
complaints for a 52 week period (12 months) is to be analysed to review the customer service
skills of the employees. The gathered statistics contains responses of customers’ complaints
against product, staff or external service provider (Gardener 2017). The complaint against
staff is indicated by K, R or B corresponding to the initial of the name of staffs that are
Kasyme, Raquel and Basel respectively in the corresponding day. Similarly, P and S indicates
the number of Product complaint and Service provider complaint in that day.
Methodology:
Data findings and analysis:
At first the number of complaints for individual categories (staff, product and service
provider) for each week are calculated from the 52 week customer table of complaints. The
gathered complaints in each category on weekly basis are given in the following table.
Weekly
product
Complains
Weekly
staff
complains
Weekly
service
provider
complains
Weekly
Complains
against
staff
Kasyme
Weekly
Complains
against
staff
Raquel
Weekly
Complains
against
staff Basel
1 2 1 1 0 1
3 2 1 1 0 1
3 3 1 0 1 2
3 1 1 0 0 1
2 1 1 1 0 0

2BUSINESS RESEARCH METHODOLOGY
2 3 0 1 0 2
1 5 1 0 1 4
0 1 1 1 0 0
1 1 0 0 1 0
0 2 1 1 1 0
3 4 2 0 1 3
1 1 0 1 0 0
1 1 1 0 1 0
1 1 1 1 0 0
2 3 0 0 0 3
0 0 1 0 0 0
1 1 0 0 1 0
1 0 1 0 0 0
3 4 1 0 1 3
1 1 0 0 0 1
0 1 1 1 0 0
1 2 0 0 1 1
0 2 1 1 1 0
2 2 1 0 0 2
0 1 0 1 0 0
0 1 1 0 1 0
1 2 0 0 1 1
2 4 0 1 0 3
0 1 1 0 0 1
2 3 0 1 0 2
1 5 1 0 1 4
0 1 1 1 0 0
1 1 0 0 1 0
0 2 1 1 1 0
3 4 2 0 1 3
1 1 0 1 0 0
1 1 1 0 1 0
1 1 1 1 0 0
2 3 0 0 0 3
0 0 1 0 0 0
1 1 0 0 1 0
1 0 1 0 0 0
3 4 1 0 1 3
1 1 0 0 0 1
0 1 1 1 0 0
1 2 0 0 1 1
0 2 1 1 1 0
2 2 1 0 0 2
0 1 0 1 0 0
0 1 1 0 1 0
1 2 0 0 1 1
2 4 0 1 0 3
0 1 1 0 0 1
⊘ This is a preview!⊘
Do you want full access?
Subscribe today to unlock all pages.

Trusted by 1+ million students worldwide

3BUSINESS RESEARCH METHODOLOGY
1 2 0 1 0 1
0 2 0 0 1 1
1 3 1 0 0 3
1 1 1 1 0 0
0 0 1 0 0 0
0 1 0 0 1 0
1 3 1 0 0 3
1 1 0 1 0 0
0 1 0 0 1 0
0 1 1 0 1 0
1 3 2 1 0 2
1 1 0 0 0 1
0 1 1 0 0 1
1 0 0 0 0 0
1 3 1 0 0 3
1 1 1 1 0 0
1 3 1 1 1 1
0 1 1 0 0 1
1 3 1 0 0 3
0 1 0 0 1 0
1 3 0 1 1 1
1 1 1 0 0 1
2 5 1 1 1 3
1 2 0 1 0 1
0 2 0 0 1 1
1 3 1 0 0 3
1 1 1 1 0 0
0 0 1 0 0 0
0 1 0 0 1 0
1 3 1 0 0 3
1 1 0 1 0 0
0 1 0 0 1 0
0 1 1 0 1 0
1 3 2 1 0 2
1 1 0 0 0 1
0 1 1 0 0 1
1 0 0 0 0 0
1 3 1 0 0 3
1 1 1 1 0 0
1 3 1 1 1 1
0 1 1 0 0 1
1 3 1 0 0 3
0 1 0 0 1 0
1 3 0 1 1 1
1 1 1 0 0 1
2 5 1 1 1 3
Paraphrase This Document
Need a fresh take? Get an instant paraphrase of this document with our AI Paraphraser

4BUSINESS RESEARCH METHODOLOGY
Furthermore the descriptive statistics of the weekly complaints data is given below.
Descriptive Weekly product
Complains
Weekly staff
complains
Weekly service provider
complains
Total 52 94 35
Average 1 1.807692308 0.673076923
maximum 3 5 2
minimum 0 0 0
standard
deviation
0.907485213 1.237303544 0.550263888
Now, in order to see whether the average number of complaints in a week throughout the
year is same for all categories i.e. (product Complains, staff complains, external service
provider complains) an ANOVA test(with 0.05 significance level) is conducted with the
following hypothesis statements.
Null hypothesis (H0): The average number of complaints in a week throughout the year is
same for all categories in the population.
Alternative hypothesis (H1): The average number of complaints in a week throughout the
year is not same for all categories in the population.
Here, the population is the number of complaints in a week for all years of the operation.
ANOVA table:
Anova: Single Factor
SUMMARY

5BUSINESS RESEARCH METHODOLOGY
Groups Count Sum Averag
e
Varianc
e
Weekly product Complains 52 52 1 0.82352
9
Weekly staff complains 52 94 1.80769
2
1.53092
Weekly service provider
complains
52 35 0.67307
7
0.30279
ANOVA
Source of Variation SS df MS F P-
value
F crit
Between Groups 35.4743
6
2 17.7371
8
20.0251
2
1.88E-
08
3.05516
2
Within Groups 135.519
2
153 0.88574
7
Total 170.993
6
155
Hence, as the p value of the F statistics is less than the significance value of 0.05, it can be
concluded that the result is significant or alternative hypothesis is true.
Findings from data analysis and its impact on company:
⊘ This is a preview!⊘
Do you want full access?
Subscribe today to unlock all pages.

Trusted by 1+ million students worldwide

6BUSINESS RESEARCH METHODOLOGY
From the obtained data it can be stated that the average weekly complaints against product is
1, against staff is 1.8 and against service provider is 0.67. Also, the maximum number of
complaints are received against staffs and among the staff maximum customers complained
against Basel (Mark 2018). Lowest number of complaints are against external service
providers in the 1 year period which is 35.
Thus the main impact on the company from the findings are on the staffs or specifically to
staff named Basel as he received most of the complaints from the customers. The staffs need
to have some proper justification to the company for receiving maximum number of
complaints. Also, the ANOVA results show that the average number of complaints to three
categories are different in the population and thus the complaints in three categories have not
the same root causes (Zhang et al. 2019).
Applied Data analysis methods:
For finding the weekly data for each unique response of the customers, excel functions len
and substitute are used in combination to extract total weekly complaints per category. Then
the descriptive statistics and ANOVA methods are applied to find the characteristics of
weekly complaints for each category. These two data analysis methods are quantitative
methods as the analysis is performed based on their quantities and these are appropriate to
understand the weekly complaints in each of three segments of operation and their
interrelation (Kim 2017). The ANOVA table is produced by the data analysis tool in excel
and the descriptive statistics is produced by using suitable excel formulas as given in
spreadsheet.
Graphical representation weekly complaints for different categories:
Paraphrase This Document
Need a fresh take? Get an instant paraphrase of this document with our AI Paraphraser

7BUSINESS RESEARCH METHODOLOGY
0 10 20 30 40 50 60
0
0.5
1
1.5
2
2.5
3
3.5
Weekly product Complains
Week number
Complaints in the week
0 10 20 30 40 50 60
0
1
2
3
4
5
6
Weekly staff complains
Week number
Complaints in the week
0 10 20 30 40 50 60
0
0.5
1
1.5
2
2.5
3
3.5
Weekly product Complains
Week number
Complaints in the week
0 10 20 30 40 50 60
0
1
2
3
4
5
6
Weekly staff complains
Week number
Complaints in the week

8BUSINESS RESEARCH METHODOLOGY
0 10 20 30 40 50 60
0
0.5
1
1.5
2
2.5
Weekly service provider complains
Week number
Complaints in the week
Monitoring strategy of customer satisfaction in future:
Now, for monitoring the customer satisfaction in the future year to see whether the
satisfaction is up to certain level the company must develop an application which
dynamically produces the complaints graphs on weekly basis and the company needs to take
necessary actions toward the department/s (product manufacturing, staff service, external
service providers) if the number of complaints in a week exceeds a predefined limit.
⊘ This is a preview!⊘
Do you want full access?
Subscribe today to unlock all pages.

Trusted by 1+ million students worldwide

9BUSINESS RESEARCH METHODOLOGY
Pie chart of total complaints in 52 week period:
29%
52%
19%
Total Complaints in three categories
Total product Complaints
Total staff complaints
Total external service provider
complains
The chart shows maximum percentage of complaints are against the staff service of the
company and hence company must improve the staff service in order to maintain customer
satisfaction to highest level. Using software to produce weekly pie charts of complaints in
different categories can help the company to monitor the categories which have least
satisfaction.
Storage of analysis information:
The company should store the customer complaints information on their secure database as
the data analytics department can analyse the customer requirement or issues from these data
which is useful for maintaining good reputation from present to future. Customer data should
be stored securely as those may contain personal information or views which may affect
others mind set about the company.
Security of data:
The data can be safely kept in company database by
Paraphrase This Document
Need a fresh take? Get an instant paraphrase of this document with our AI Paraphraser

10BUSINESS RESEARCH METHODOLOGY
1) Separating the database and web servers.
2) Encrypting the information with a private and public key (Bertino 2015).
3) Enabling modern security controls like updated Anti-virus software in the systems (Bertino
2016).
4) Minimizing the use of 3rd party apps in the system.
Required policies and procedures:
It is found from the data analysis that most of the complaints against the staff service and so
as the average and standard deviation. Thus the company needs to change their policy for
staff performance evaluation and needs to take necessary actions if the performance of staffs
are found to be unsatisfactory for a long period of time. Also, the ANOVA test suggest that
the average complaints in each category are not same thus the company needs to individually
inspect the causes of customer complaints in each segment.
Recommendation and conclusion:
Thus analysing the customer complaints data in historical year it is found that customers are
least satisfied with the staffs of the company and mostly satisfied with the external service
providers as only 0.67 complaints in this category is expected from the customers. Thus the
company needs to improve product quality and staff service by changing staff members and
the product manufacturing team. An effective training to the team before introducing them in
the service can be helpful for company as the overall quality of service and products are
increased.
References:
Kim, T.K., 2017. Understanding one-way ANOVA using conceptual figures. Korean journal
of anesthesiology, 70(1), p.22.

11BUSINESS RESEARCH METHODOLOGY
Zhang, J.T., Cheng, M.Y., Wu, H.T. and Zhou, B., 2019. A new test for functional one-way
ANOVA with applications to ischemic heart screening. Computational Statistics & Data
Analysis, 132, pp.3-17.
Gardener, M., 2017. Statistics for ecologists using R and Excel: Data collection, exploration,
analysis and presentation. Pelagic Publishing Ltd.
Mark, K., 2018. Introduction to Data Analysis Using Excel and Lab Report Writing Using
LaGCC Institution Data.
Bertino, E., 2015, June. Big data-security and privacy. In 2015 IEEE International Congress
on Big Data (pp. 757-761). IEEE.
Bertino, E., 2016, June. Data security and privacy: concepts, approaches, and research
directions. In 2016 IEEE 40th Annual Computer Software and Applications Conference
(COMPSAC) (Vol. 1, pp. 400-407). IEEE.
⊘ This is a preview!⊘
Do you want full access?
Subscribe today to unlock all pages.

Trusted by 1+ million students worldwide
1 out of 12
Related Documents

Your All-in-One AI-Powered Toolkit for Academic Success.
 +13062052269
info@desklib.com
Available 24*7 on WhatsApp / Email
Unlock your academic potential
Copyright © 2020–2025 A2Z Services. All Rights Reserved. Developed and managed by ZUCOL.