Business Research Methods (BA5004) Report: Customer Behavior Analysis
VerifiedAdded on  2023/01/10
|27
|4491
|57
Report
AI Summary
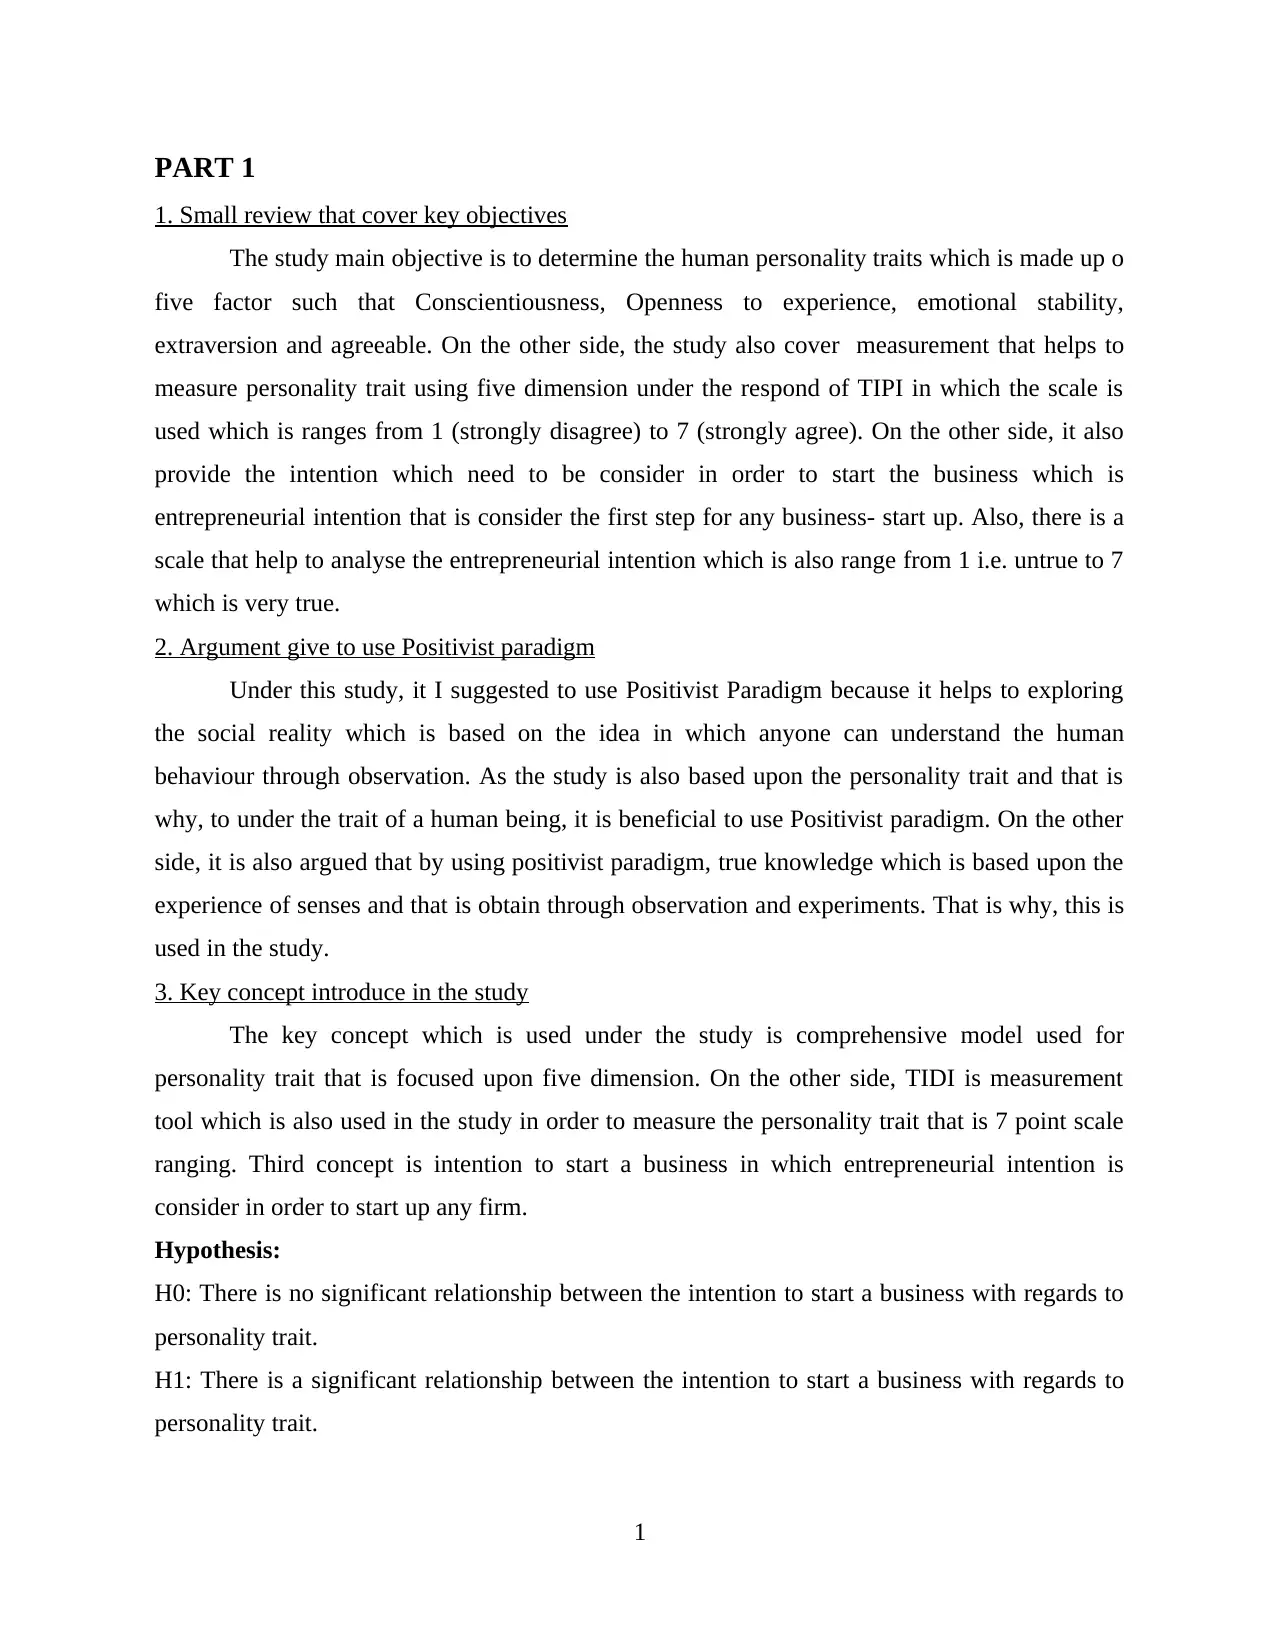
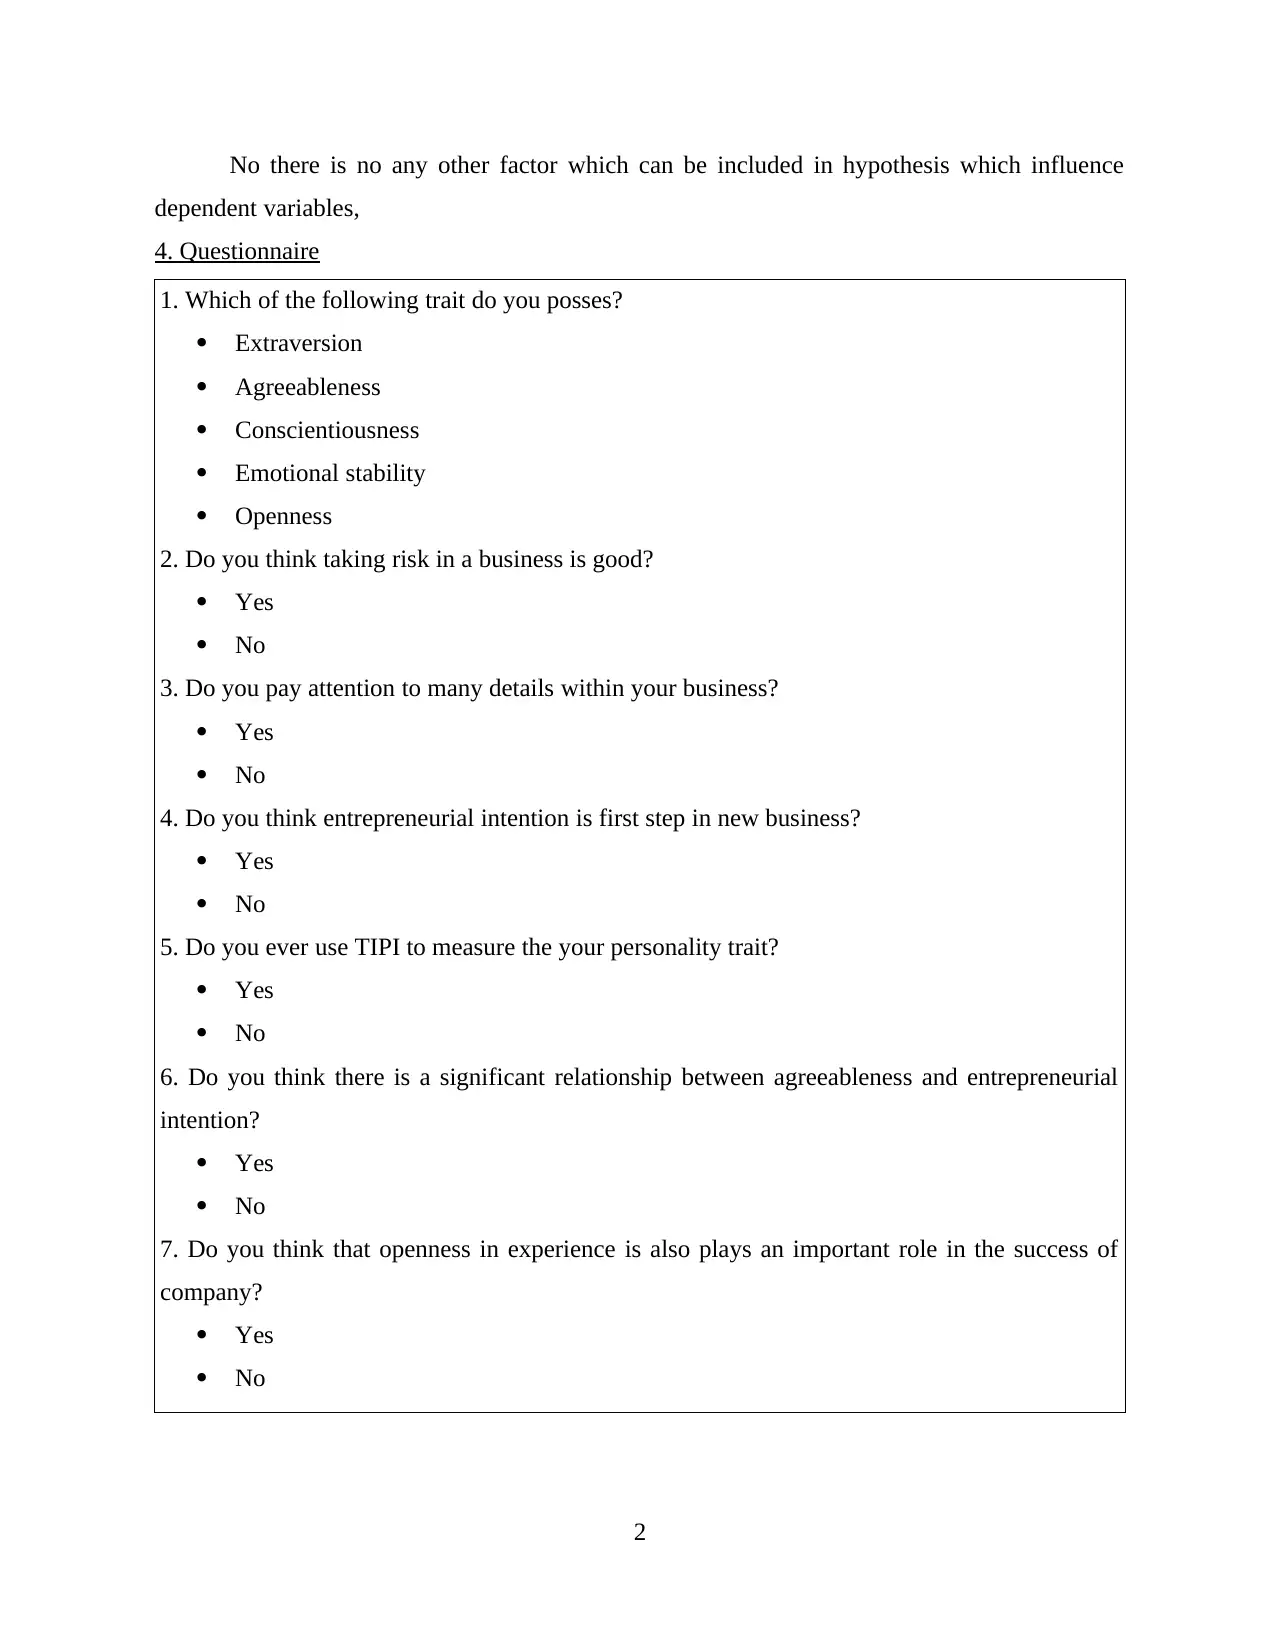
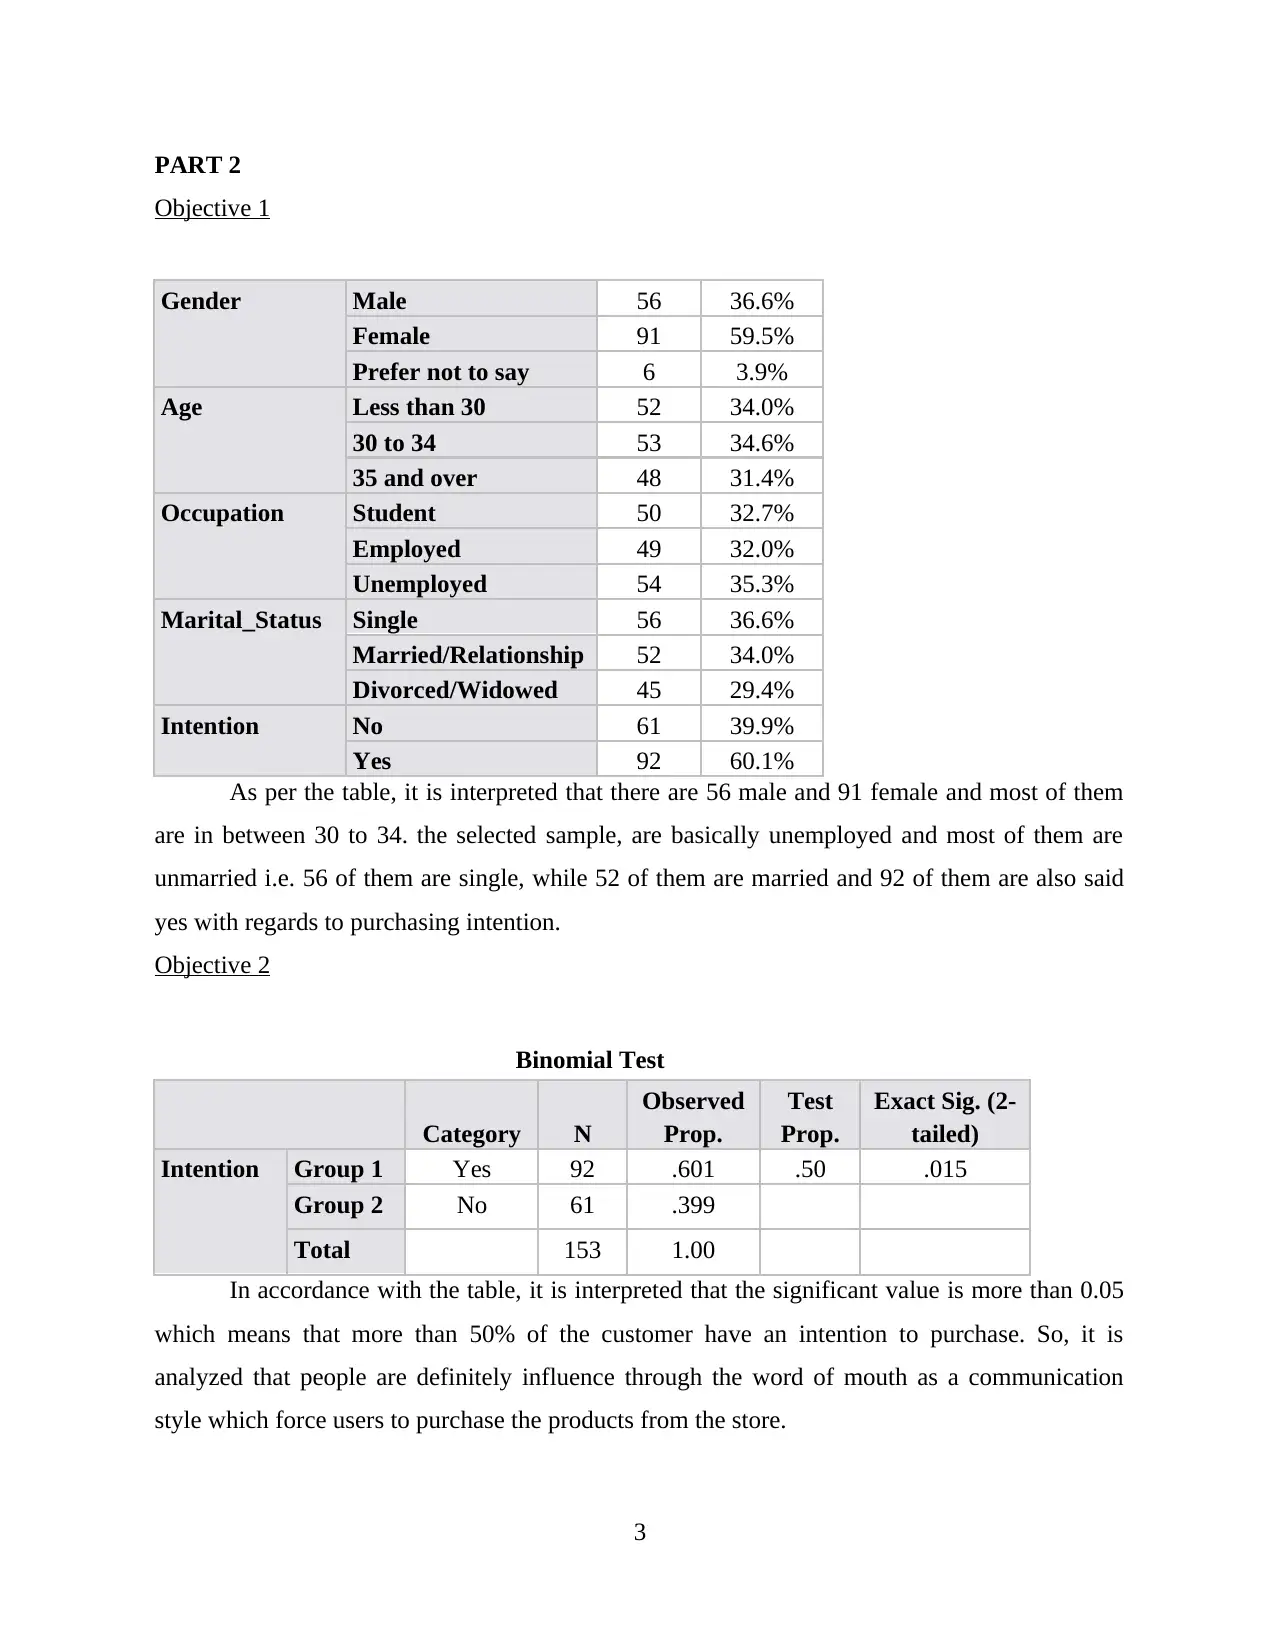
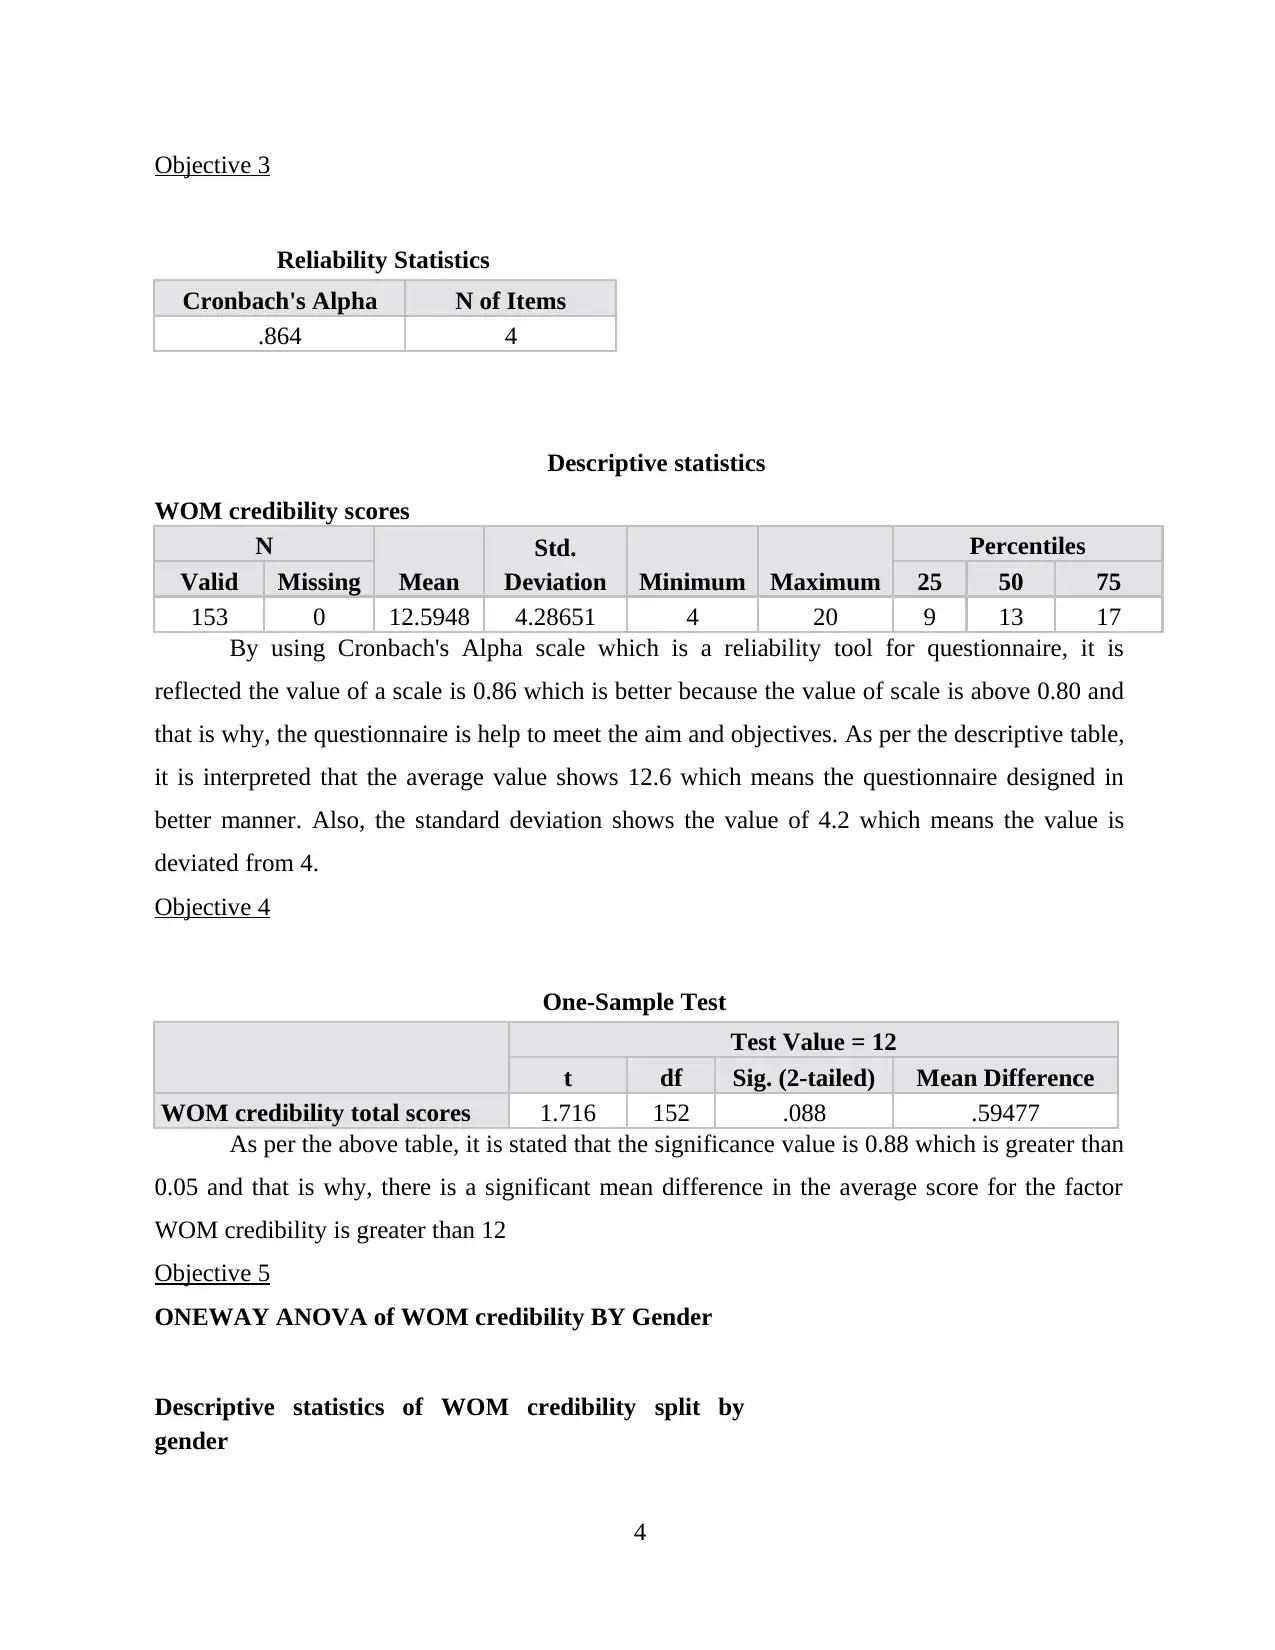
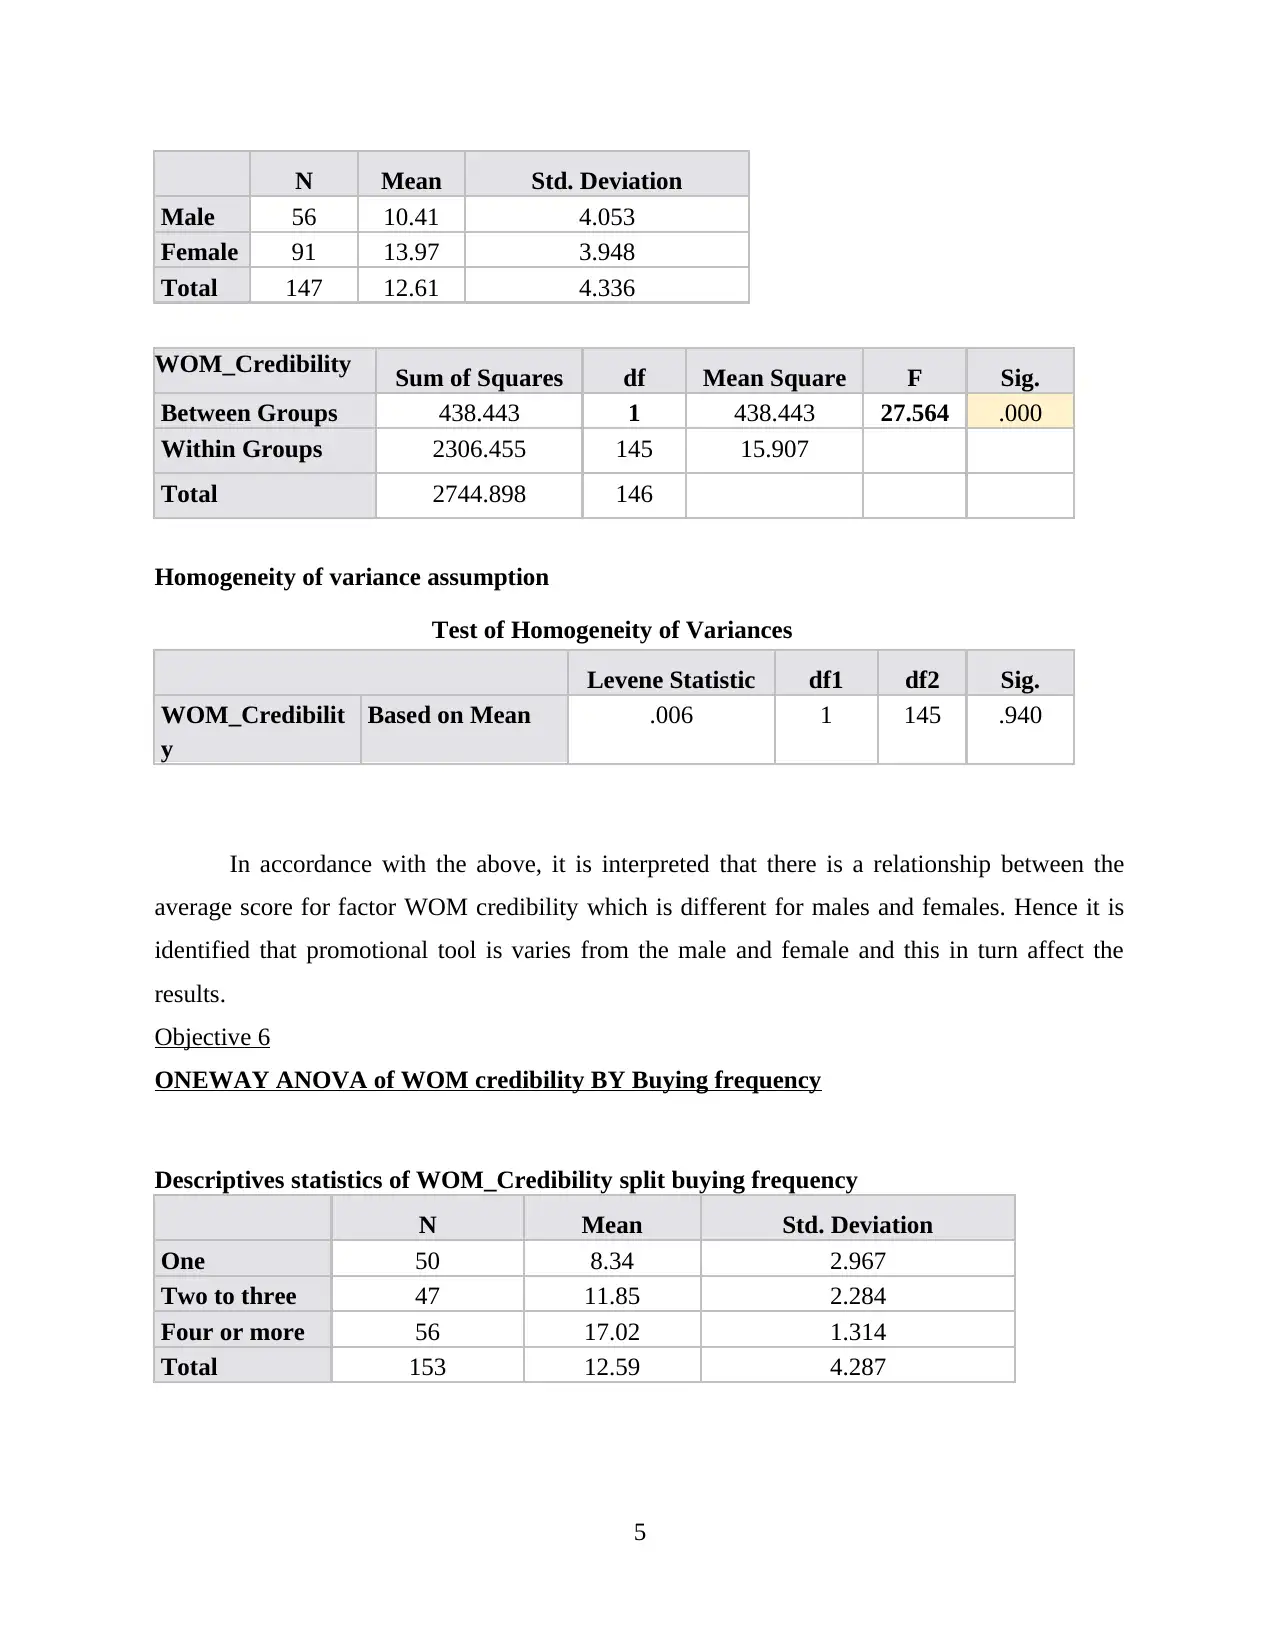
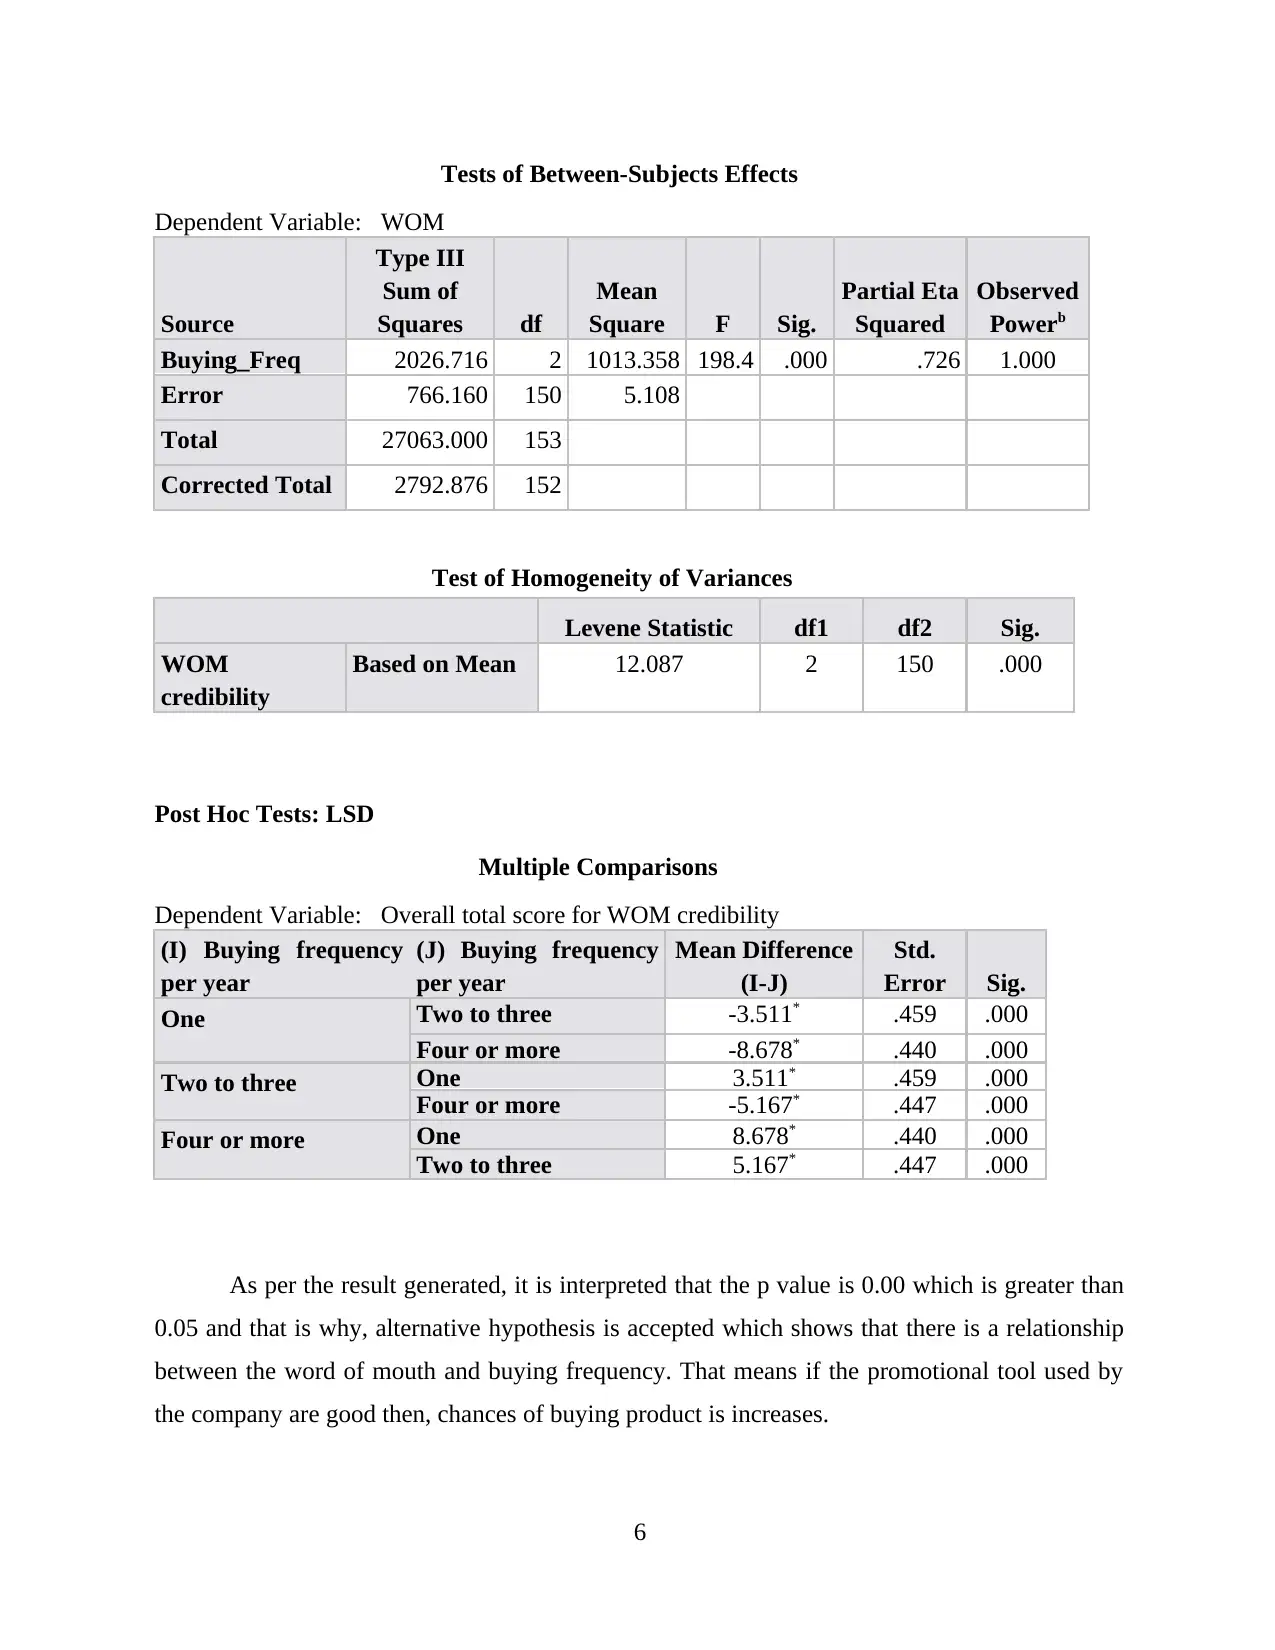
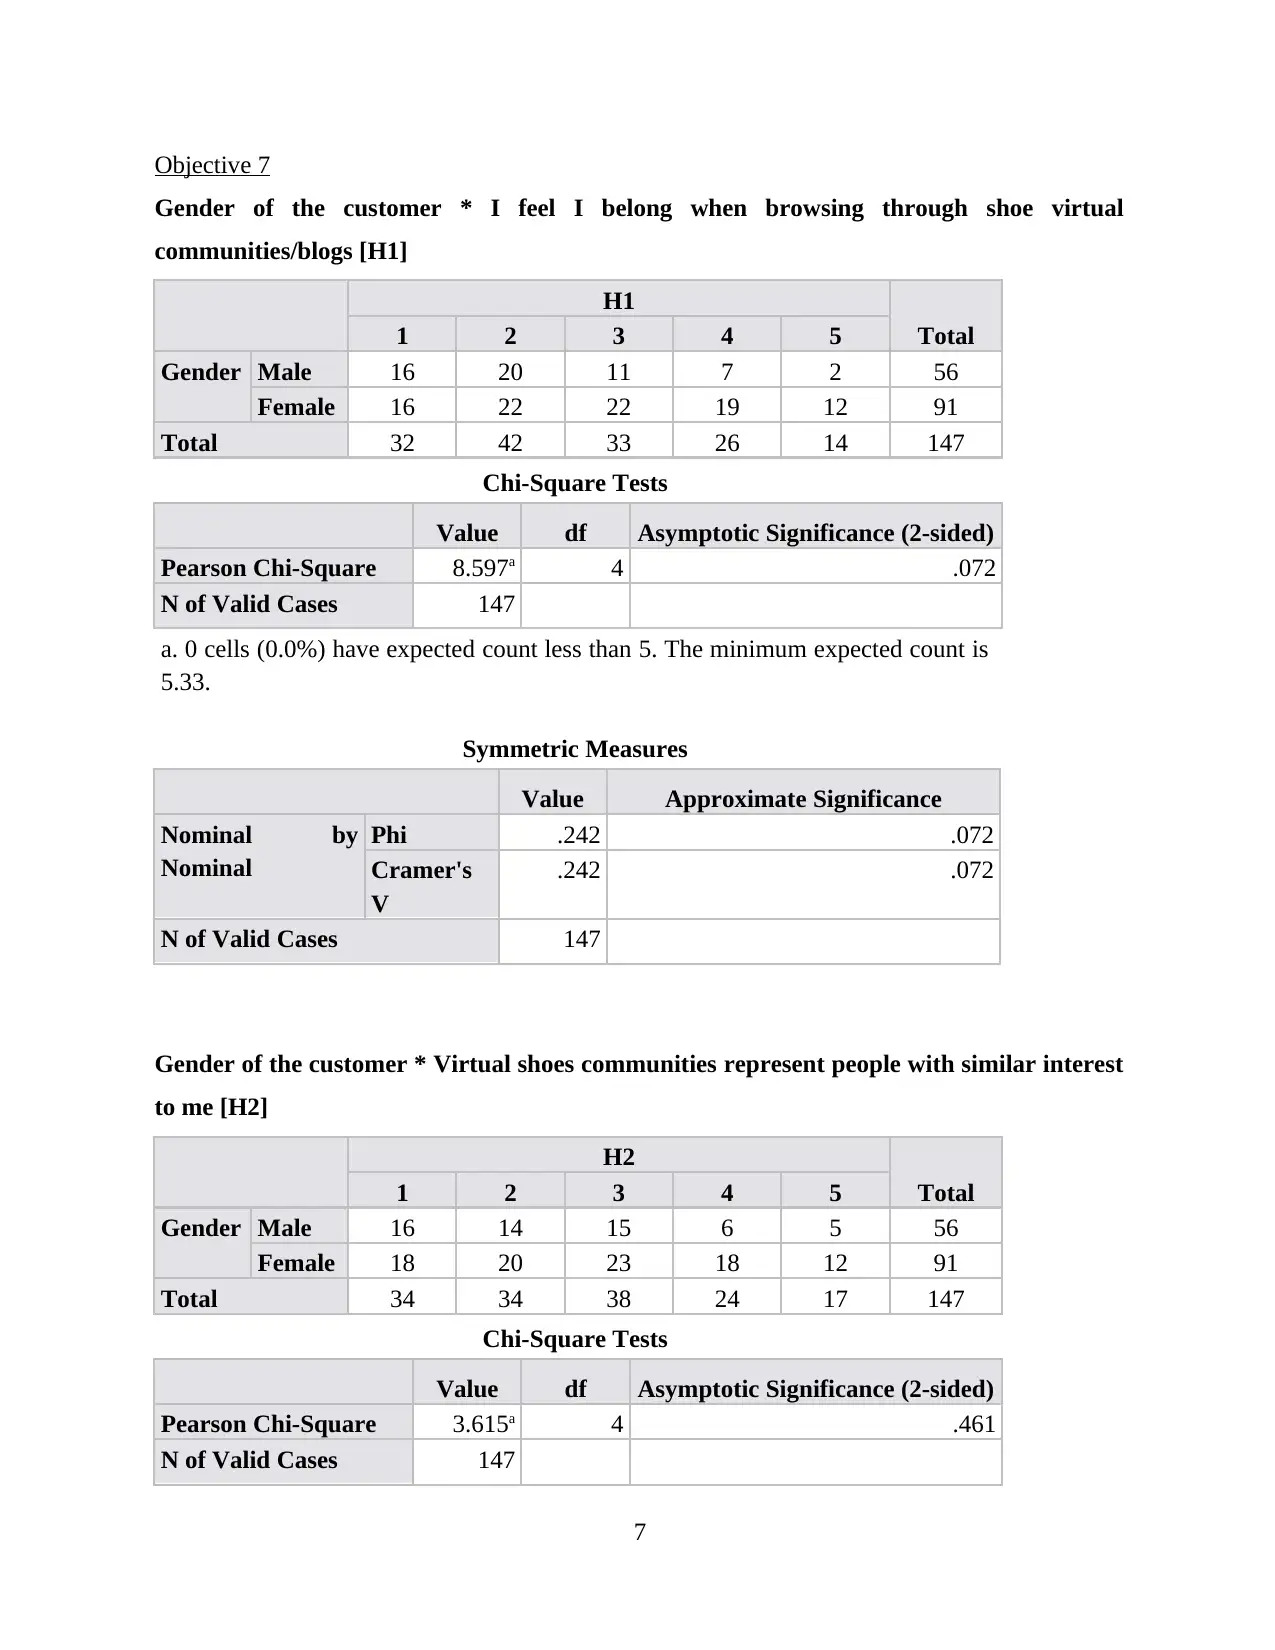
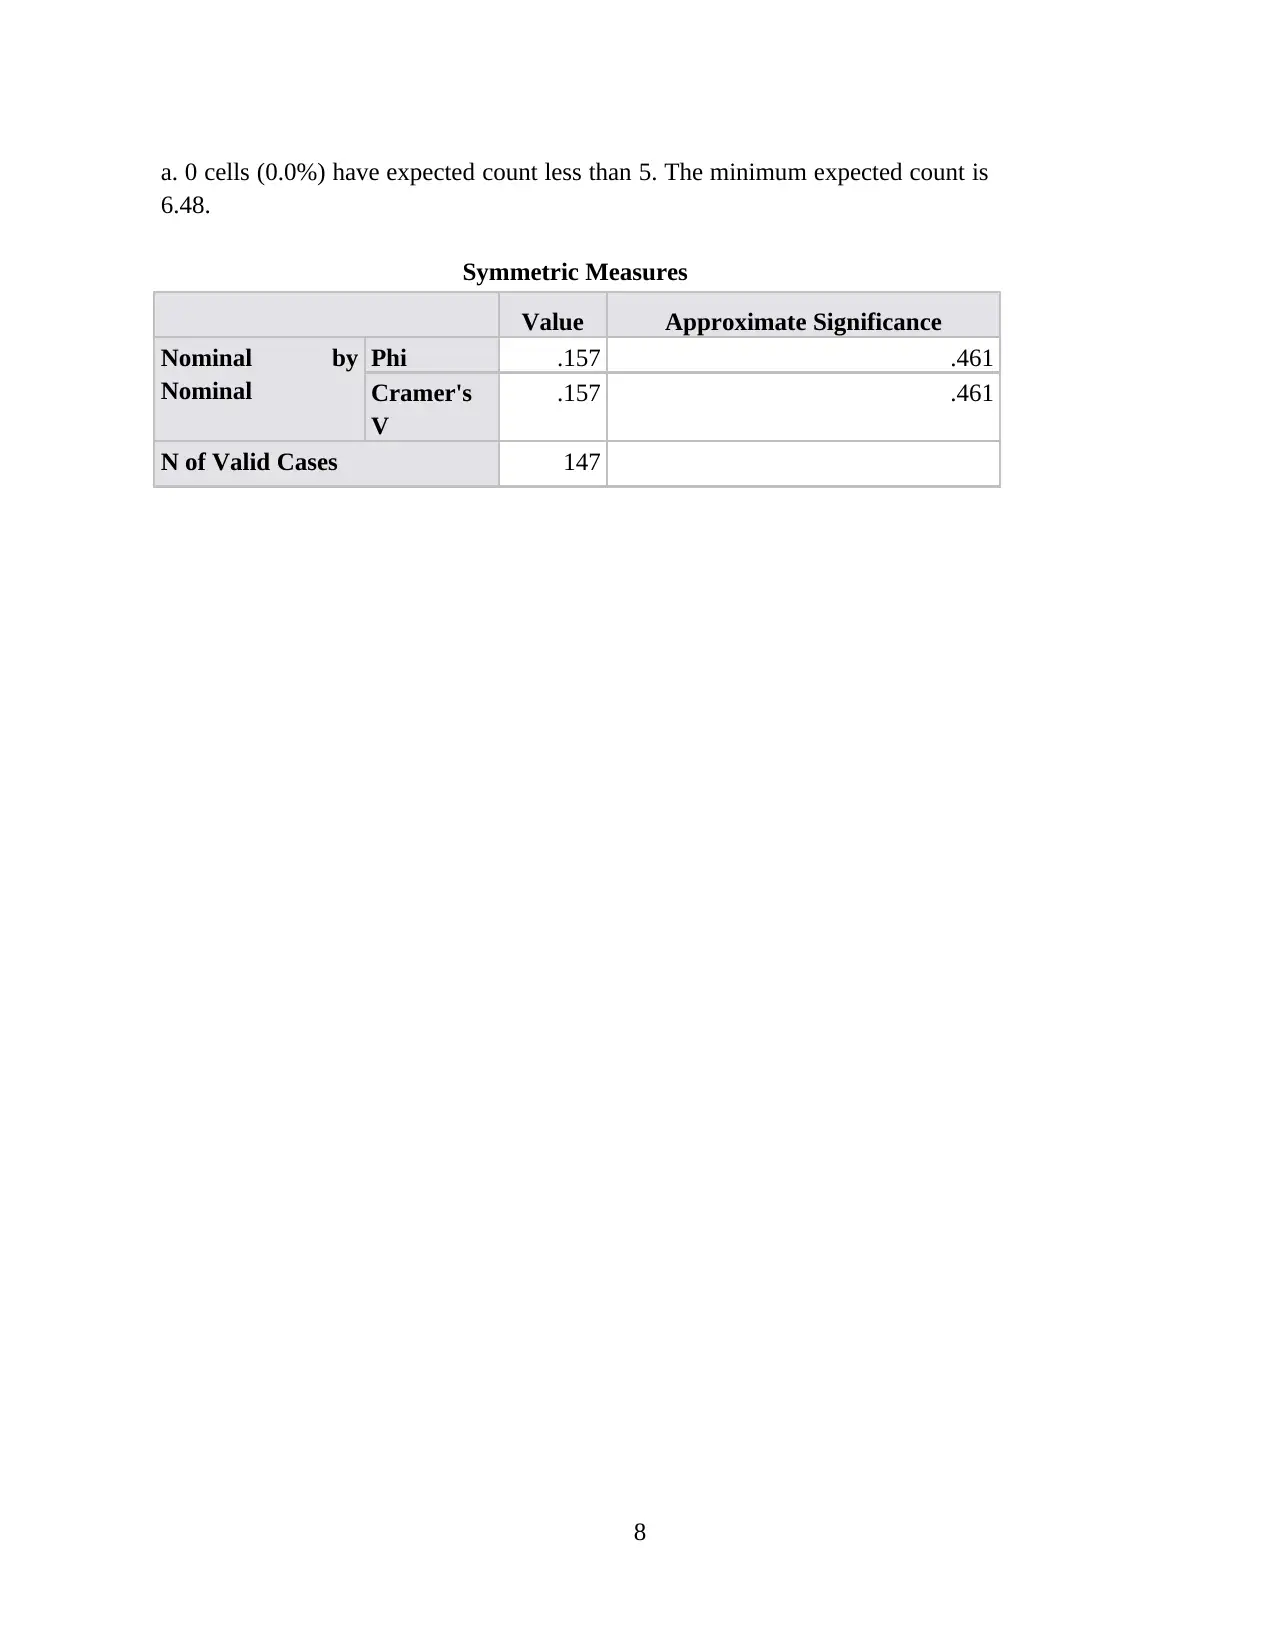
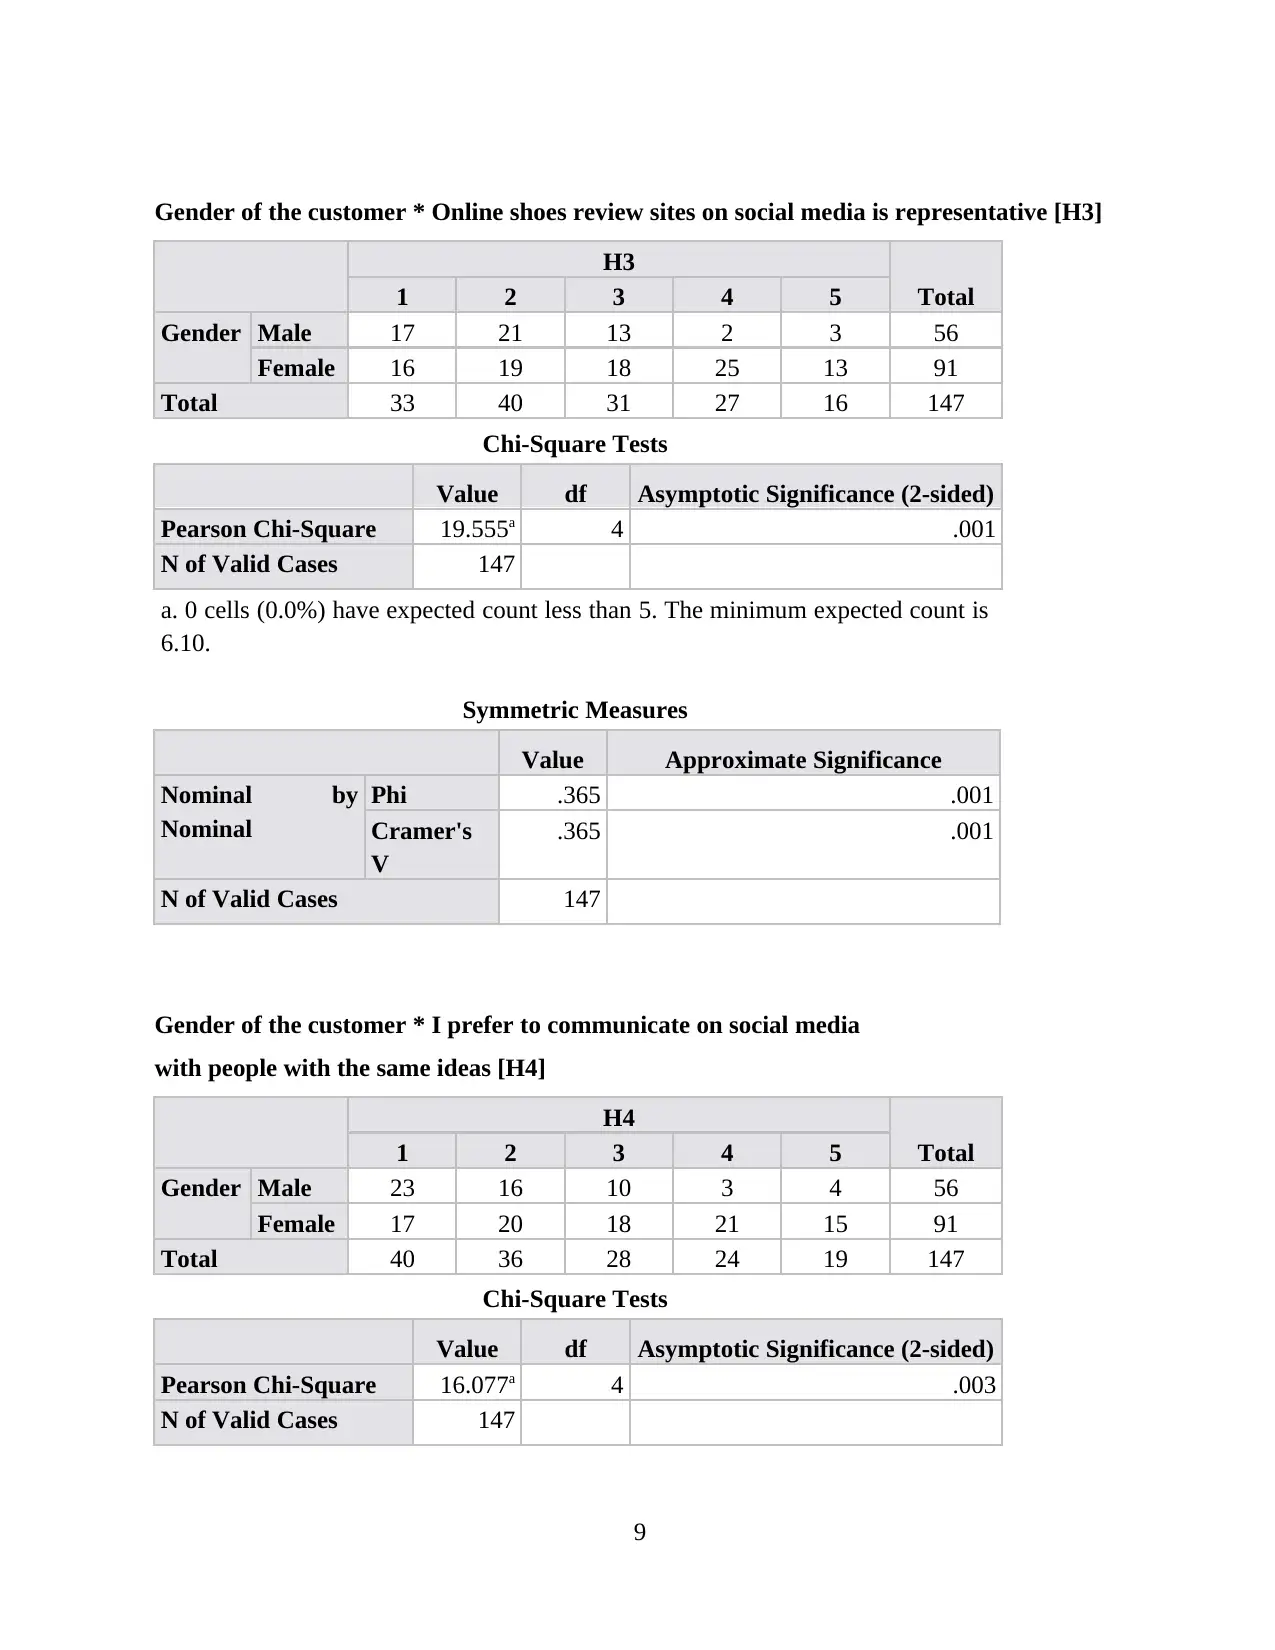
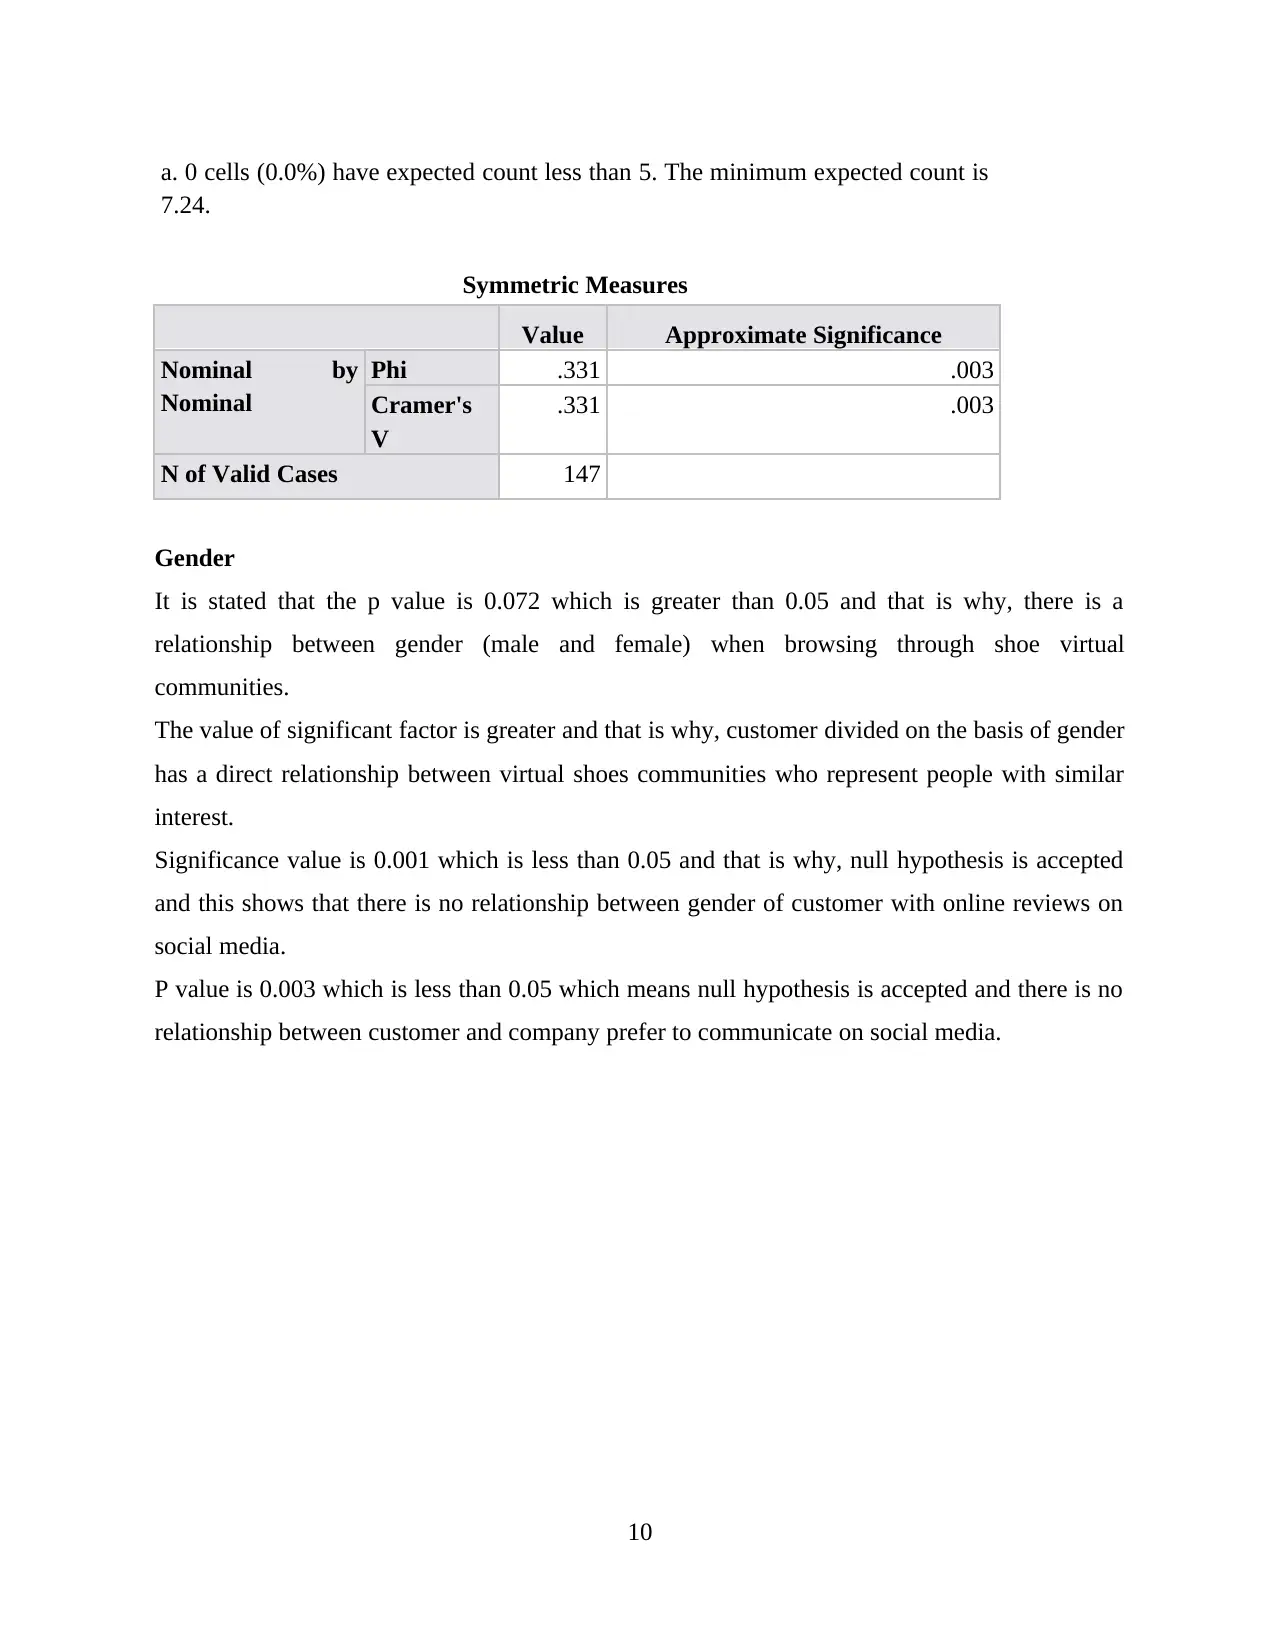
This report, submitted for BA5004 Business Research Methods, investigates customer behavior within a shoe shop context. The study explores the relationship between personality traits and entrepreneurial intention, employing the Positivist paradigm for data analysis. Key concepts include the five-factor model of personality, the TIPI measurement tool, and entrepreneurial intention. The report presents a questionnaire assessing customer demographics, purchasing intentions, and perceptions of word-of-mouth (WOM) credibility. Statistical analyses, including binomial tests, reliability tests, t-tests, and ANOVA, are used to analyze the data. Findings reveal significant relationships between gender, buying frequency, and WOM credibility. Furthermore, chi-square tests examine the association between customer demographics (gender and occupation) and their engagement with online shoe communities and social media reviews. The analysis provides valuable insights into customer behavior and the factors influencing purchasing decisions, offering a comprehensive overview of the research methodology and findings.

BA5004: Business Reserach Methods
Paraphrase This Document
Need a fresh take? Get an instant paraphrase of this document with our AI Paraphraser

Table of Contents
PART 1............................................................................................................................................1
1. Small review that cover key objectives...................................................................................1
2. Argument give to use Positivist paradigm..............................................................................1
3. Key concept introduce in the study.........................................................................................1
4. Questionnaire..........................................................................................................................2
PART 2............................................................................................................................................3
Objective 1..................................................................................................................................3
Objective 2..................................................................................................................................3
Objective 3..................................................................................................................................3
Objective 4..................................................................................................................................4
Objective 5..................................................................................................................................4
Objective 6..................................................................................................................................5
Objective 7..................................................................................................................................6
Objective 8................................................................................................................................21

PART 1
1. Small review that cover key objectives
The study main objective is to determine the human personality traits which is made up o
five factor such that Conscientiousness, Openness to experience, emotional stability,
extraversion and agreeable. On the other side, the study also cover measurement that helps to
measure personality trait using five dimension under the respond of TIPI in which the scale is
used which is ranges from 1 (strongly disagree) to 7 (strongly agree). On the other side, it also
provide the intention which need to be consider in order to start the business which is
entrepreneurial intention that is consider the first step for any business- start up. Also, there is a
scale that help to analyse the entrepreneurial intention which is also range from 1 i.e. untrue to 7
which is very true.
2. Argument give to use Positivist paradigm
Under this study, it I suggested to use Positivist Paradigm because it helps to exploring
the social reality which is based on the idea in which anyone can understand the human
behaviour through observation. As the study is also based upon the personality trait and that is
why, to under the trait of a human being, it is beneficial to use Positivist paradigm. On the other
side, it is also argued that by using positivist paradigm, true knowledge which is based upon the
experience of senses and that is obtain through observation and experiments. That is why, this is
used in the study.
3. Key concept introduce in the study
The key concept which is used under the study is comprehensive model used for
personality trait that is focused upon five dimension. On the other side, TIDI is measurement
tool which is also used in the study in order to measure the personality trait that is 7 point scale
ranging. Third concept is intention to start a business in which entrepreneurial intention is
consider in order to start up any firm.
Hypothesis:
H0: There is no significant relationship between the intention to start a business with regards to
personality trait.
H1: There is a significant relationship between the intention to start a business with regards to
personality trait.
1
⊘ This is a preview!⊘
Do you want full access?
Subscribe today to unlock all pages.

Trusted by 1+ million students worldwide

No there is no any other factor which can be included in hypothesis which influence
dependent variables,
4. Questionnaire
1. Which of the following trait do you posses?
ï‚· Extraversion
ï‚· Agreeableness
ï‚· Conscientiousness
ï‚· Emotional stability
ï‚· Openness
2. Do you think taking risk in a business is good?
ï‚· Yes
ï‚· No
3. Do you pay attention to many details within your business?
ï‚· Yes
ï‚· No
4. Do you think entrepreneurial intention is first step in new business?
ï‚· Yes
ï‚· No
5. Do you ever use TIPI to measure the your personality trait?
ï‚· Yes
ï‚· No
6. Do you think there is a significant relationship between agreeableness and entrepreneurial
intention?
ï‚· Yes
ï‚· No
7. Do you think that openness in experience is also plays an important role in the success of
company?
ï‚· Yes
ï‚· No
2
Paraphrase This Document
Need a fresh take? Get an instant paraphrase of this document with our AI Paraphraser

PART 2
Objective 1
Gender Male 56 36.6%
Female 91 59.5%
Prefer not to say 6 3.9%
Age Less than 30 52 34.0%
30 to 34 53 34.6%
35 and over 48 31.4%
Occupation Student 50 32.7%
Employed 49 32.0%
Unemployed 54 35.3%
Marital_Status Single 56 36.6%
Married/Relationship 52 34.0%
Divorced/Widowed 45 29.4%
Intention No 61 39.9%
Yes 92 60.1%
As per the table, it is interpreted that there are 56 male and 91 female and most of them
are in between 30 to 34. the selected sample, are basically unemployed and most of them are
unmarried i.e. 56 of them are single, while 52 of them are married and 92 of them are also said
yes with regards to purchasing intention.
Objective 2
Binomial Test
Category N
Observed
Prop.
Test
Prop.
Exact Sig. (2-
tailed)
Intention Group 1 Yes 92 .601 .50 .015
Group 2 No 61 .399
Total 153 1.00
In accordance with the table, it is interpreted that the significant value is more than 0.05
which means that more than 50% of the customer have an intention to purchase. So, it is
analyzed that people are definitely influence through the word of mouth as a communication
style which force users to purchase the products from the store.
3

Objective 3
Reliability Statistics
Cronbach's Alpha N of Items
.864 4
Descriptive statistics
WOM credibility scores
N
Mean
Std.
Deviation Minimum Maximum
Percentiles
Valid Missing 25 50 75
153 0 12.5948 4.28651 4 20 9 13 17
By using Cronbach's Alpha scale which is a reliability tool for questionnaire, it is
reflected the value of a scale is 0.86 which is better because the value of scale is above 0.80 and
that is why, the questionnaire is help to meet the aim and objectives. As per the descriptive table,
it is interpreted that the average value shows 12.6 which means the questionnaire designed in
better manner. Also, the standard deviation shows the value of 4.2 which means the value is
deviated from 4.
Objective 4
One-Sample Test
Test Value = 12
t df Sig. (2-tailed) Mean Difference
WOM credibility total scores 1.716 152 .088 .59477
As per the above table, it is stated that the significance value is 0.88 which is greater than
0.05 and that is why, there is a significant mean difference in the average score for the factor
WOM credibility is greater than 12
Objective 5
ONEWAY ANOVA of WOM credibility BY Gender
Descriptive statistics of WOM credibility split by
gender
4
⊘ This is a preview!⊘
Do you want full access?
Subscribe today to unlock all pages.

Trusted by 1+ million students worldwide

N Mean Std. Deviation
Male 56 10.41 4.053
Female 91 13.97 3.948
Total 147 12.61 4.336
WOM_Credibility Sum of Squares df Mean Square F Sig.
Between Groups 438.443 1 438.443 27.564 .000
Within Groups 2306.455 145 15.907
Total 2744.898 146
Homogeneity of variance assumption
Test of Homogeneity of Variances
Levene Statistic df1 df2 Sig.
WOM_Credibilit
y
Based on Mean .006 1 145 .940
In accordance with the above, it is interpreted that there is a relationship between the
average score for factor WOM credibility which is different for males and females. Hence it is
identified that promotional tool is varies from the male and female and this in turn affect the
results.
Objective 6
ONEWAY ANOVA of WOM credibility BY Buying frequency
Descriptives statistics of WOM_Credibility split buying frequency
N Mean Std. Deviation
One 50 8.34 2.967
Two to three 47 11.85 2.284
Four or more 56 17.02 1.314
Total 153 12.59 4.287
5
Paraphrase This Document
Need a fresh take? Get an instant paraphrase of this document with our AI Paraphraser

Tests of Between-Subjects Effects
Dependent Variable: WOM
Source
Type III
Sum of
Squares df
Mean
Square F Sig.
Partial Eta
Squared
Observed
Powerb
Buying_Freq 2026.716 2 1013.358 198.4 .000 .726 1.000
Error 766.160 150 5.108
Total 27063.000 153
Corrected Total 2792.876 152
Test of Homogeneity of Variances
Levene Statistic df1 df2 Sig.
WOM
credibility
Based on Mean 12.087 2 150 .000
Post Hoc Tests: LSD
Multiple Comparisons
Dependent Variable: Overall total score for WOM credibility
(I) Buying frequency
per year
(J) Buying frequency
per year
Mean Difference
(I-J)
Std.
Error Sig.
One Two to three -3.511* .459 .000
Four or more -8.678* .440 .000
Two to three One 3.511* .459 .000
Four or more -5.167* .447 .000
Four or more One 8.678* .440 .000
Two to three 5.167* .447 .000
As per the result generated, it is interpreted that the p value is 0.00 which is greater than
0.05 and that is why, alternative hypothesis is accepted which shows that there is a relationship
between the word of mouth and buying frequency. That means if the promotional tool used by
the company are good then, chances of buying product is increases.
6

Objective 7
Gender of the customer * I feel I belong when browsing through shoe virtual
communities/blogs [H1]
H1
Total1 2 3 4 5
Gender Male 16 20 11 7 2 56
Female 16 22 22 19 12 91
Total 32 42 33 26 14 147
Chi-Square Tests
Value df Asymptotic Significance (2-sided)
Pearson Chi-Square 8.597a 4 .072
N of Valid Cases 147
a. 0 cells (0.0%) have expected count less than 5. The minimum expected count is
5.33.
Symmetric Measures
Value Approximate Significance
Nominal by
Nominal
Phi .242 .072
Cramer's
V
.242 .072
N of Valid Cases 147
Gender of the customer * Virtual shoes communities represent people with similar interest
to me [H2]
H2
Total1 2 3 4 5
Gender Male 16 14 15 6 5 56
Female 18 20 23 18 12 91
Total 34 34 38 24 17 147
Chi-Square Tests
Value df Asymptotic Significance (2-sided)
Pearson Chi-Square 3.615a 4 .461
N of Valid Cases 147
7
⊘ This is a preview!⊘
Do you want full access?
Subscribe today to unlock all pages.

Trusted by 1+ million students worldwide

a. 0 cells (0.0%) have expected count less than 5. The minimum expected count is
6.48.
Symmetric Measures
Value Approximate Significance
Nominal by
Nominal
Phi .157 .461
Cramer's
V
.157 .461
N of Valid Cases 147
8
6.48.
Symmetric Measures
Value Approximate Significance
Nominal by
Nominal
Phi .157 .461
Cramer's
V
.157 .461
N of Valid Cases 147
8
Paraphrase This Document
Need a fresh take? Get an instant paraphrase of this document with our AI Paraphraser

Gender of the customer * Online shoes review sites on social media is representative [H3]
H3
Total1 2 3 4 5
Gender Male 17 21 13 2 3 56
Female 16 19 18 25 13 91
Total 33 40 31 27 16 147
Chi-Square Tests
Value df Asymptotic Significance (2-sided)
Pearson Chi-Square 19.555a 4 .001
N of Valid Cases 147
a. 0 cells (0.0%) have expected count less than 5. The minimum expected count is
6.10.
Symmetric Measures
Value Approximate Significance
Nominal by
Nominal
Phi .365 .001
Cramer's
V
.365 .001
N of Valid Cases 147
Gender of the customer * I prefer to communicate on social media
with people with the same ideas [H4]
H4
Total1 2 3 4 5
Gender Male 23 16 10 3 4 56
Female 17 20 18 21 15 91
Total 40 36 28 24 19 147
Chi-Square Tests
Value df Asymptotic Significance (2-sided)
Pearson Chi-Square 16.077a 4 .003
N of Valid Cases 147
9

a. 0 cells (0.0%) have expected count less than 5. The minimum expected count is
7.24.
Symmetric Measures
Value Approximate Significance
Nominal by
Nominal
Phi .331 .003
Cramer's
V
.331 .003
N of Valid Cases 147
Gender
It is stated that the p value is 0.072 which is greater than 0.05 and that is why, there is a
relationship between gender (male and female) when browsing through shoe virtual
communities.
The value of significant factor is greater and that is why, customer divided on the basis of gender
has a direct relationship between virtual shoes communities who represent people with similar
interest.
Significance value is 0.001 which is less than 0.05 and that is why, null hypothesis is accepted
and this shows that there is no relationship between gender of customer with online reviews on
social media.
P value is 0.003 which is less than 0.05 which means null hypothesis is accepted and there is no
relationship between customer and company prefer to communicate on social media.
10
⊘ This is a preview!⊘
Do you want full access?
Subscribe today to unlock all pages.

Trusted by 1+ million students worldwide
1 out of 27
Related Documents

Your All-in-One AI-Powered Toolkit for Academic Success.
 +13062052269
info@desklib.com
Available 24*7 on WhatsApp / Email
Unlock your academic potential
Copyright © 2020–2025 A2Z Services. All Rights Reserved. Developed and managed by ZUCOL.