BA5004QA Business Research Methods: Retail Self-Checkout Analysis
VerifiedAdded on 2023/06/09
|20
|2695
|313
Project
AI Summary
This project examines the use of self-checkout counters in the retail industry, focusing on demographic differences between users and non-users and their perceptions of self-checkout characteristics in Singapore. The study employs a survey instrument divided into three sections: user identification and demographics, perception measurement using a five-point Likert scale, and likelihood of using self-checkout systems in various contexts. Convenience sampling was used, and statistical tests, including independent t-tests and ANOVA, were conducted to analyze the data. The findings suggest no significant difference in perception between users and non-users. Two case studies are also included, one analyzing shopping behavior at Amazon Fresh and the other exploring the relationship between entrepreneurship intention and knowledge of entrepreneurship modules. The analysis involves hypothesis testing, regression analysis, and descriptive statistics to draw conclusions about consumer behavior and entrepreneurial tendencies.
BA5004QA Business Research
Methods project 3
Methods project 3
Paraphrase This Document
Need a fresh take? Get an instant paraphrase of this document with our AI Paraphraser
TABLE OF CONTENTS
PART ONE......................................................................................................................................3
1...................................................................................................................................................3
2...................................................................................................................................................3
3...................................................................................................................................................4
4...................................................................................................................................................4
5...................................................................................................................................................5
PART TWO.....................................................................................................................................6
CASE STUDY 1..............................................................................................................................6
1...................................................................................................................................................6
2...................................................................................................................................................6
3...................................................................................................................................................6
4...................................................................................................................................................7
CASE STUDY 2..............................................................................................................................8
1...................................................................................................................................................8
2...................................................................................................................................................8
3...................................................................................................................................................8
4...................................................................................................................................................8
REFERENCES..............................................................................................................................10
APPENDIX....................................................................................................................................11
PART ONE
1
The aim of the study is to analyse the use of self- checkout counters being installed
within the retail industry. This is necessary to be evaluated because it assist the company in
providing better consumer services so that majority of the people are attracted towards this
service (Xian and Meng-Lewis, 2018). The major research question of the current study is that
analyse the demographic difference is present within the user and non- user relating to the self-
checkout counters. Along with this another research question being answered in the present study
is that whether there is any of the difference being present in the user and non- user relating to
the self- checkout counters and how the people perceive the characteristic relating to the self-
checkout counters present in Singapore.
2
A
The survey instrument being present in the study is being divided into three different
section. The first section is the one which was aimed to measure the fact that whether the
respondent is a user of the self- checkout system or not. It also involves the demographic
information like the educational qualification, gender, age and others. Along with this another
section consisted the five point Likert scale questions which deals with measuring the perception
of the self- checkout counters. In the end the last section includes the seven five point Likert
scale statements which includes the questions relating to the likelihood of using the self-
checkout systems in different situational context.
B
The second section of this instrument included the five point Likert scale which aimed to
measure the perception of the people relating to the use of self- checkout counters. This
instrument was organised in different sections and it included the following-
Relative advantage
Perceived Complexity
Reliability
Fun
C
⊘ This is a preview!⊘
Do you want full access?
Subscribe today to unlock all pages.
Trusted by 1+ million students worldwide
The Cronbach alpha is a method with help of which the researcher in analysing the
authenticity and reliability of the data in better manner. This is very important to be used because
of the reason that it will be helping the researcher in analysing the fact that whether the data used
is reliable and will it generate the accurate results or not (Mitchell and Rich, 2020). It is
necessary for the researcher that it includes the same in the research paper as it will make other
think that the data used was appropriate and properly relating to the research topic.
3
With respect to the sampling, the use of convenience sample was undertaken for the
accomplishment of the objectives of the study. This method is being undertaken for gathering the
sample because of the reason that it includes the selection of the sample on the basis of the
convenience of the researcher and purpose of the study. the responses selected were not random
as this method of sample is non- probabilistic and because of this no random sample is being
selected for the study to be accomplished. The major reason for the selection of the convenience
sampling is that it provides quick results and because of this the time taken for the research is
less and objectives are attained on time.
4
A
The evidence being provided for stating that there is not any difference in the use of self-
checkout system across the different demographic segment is that the p value was provided in
this section. This p value outlines the fact that whether the difference is being present in the two
variables or not. In the present segment the p value is more than 0.05 and because of this the
conclusion has been made that there is not any difference in the use of self- checkout counters
among the various demographic segment.
B
The 4 in this present report and segment outlines the number of trial the test has been
undertaken. this is because of the reason that the tests are being conducted many a times and it is
not necessary that every time the same result is generated (Bell, Harley and Bryman, 2022).
Thus, for this it is necessary that researcher mention the number of trial which is being
undertaken. So in the equation, 4 implies that this is the fourth time the test is being run.
C
Paraphrase This Document
Need a fresh take? Get an instant paraphrase of this document with our AI Paraphraser
With regards to the section ‘Evaluation of the self- checkout counters’ the independent t-
test was used for the comparison of average scores of measures between the user and non- user
of the self- checkout counters. This is concluded because of the reason that p < 0.01 and this
implies that the test results were statistically significant.
5
In the end it is concluded that there is not any difference being present in the perception
of the user and non- users of the self- checkout system. Also the recent study highlighted the fact
that more technology is being used in the self- checkout system such that the work is being
managed and improved in better manner. Also the recent study highlighted the fact that there is
also some of the resistance from the people and this can affect the implementation of the self-
checkout counters to a great extent.
PART TWO
CASE STUDY 1
1
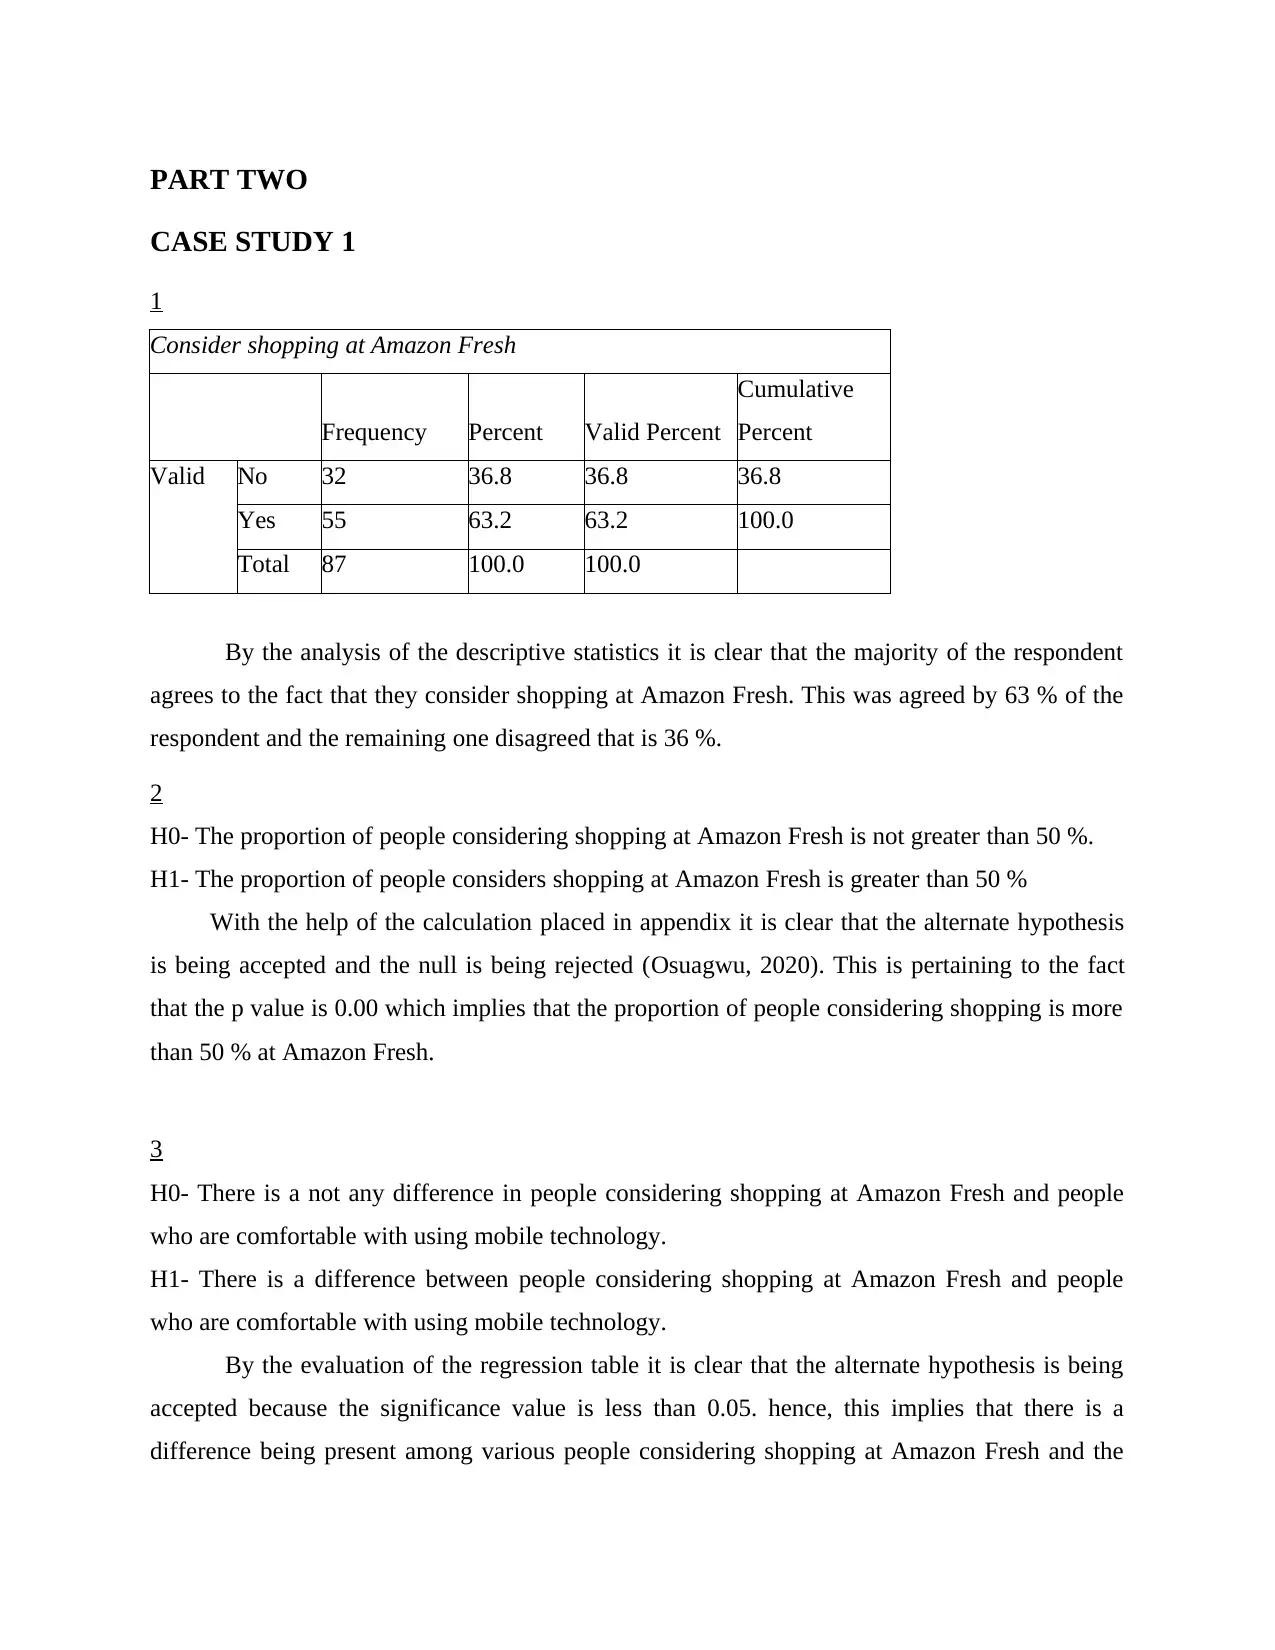
Consider shopping at Amazon Fresh
Frequency Percent Valid Percent
Cumulative
Percent
Valid No 32 36.8 36.8 36.8
Yes 55 63.2 63.2 100.0
Total 87 100.0 100.0
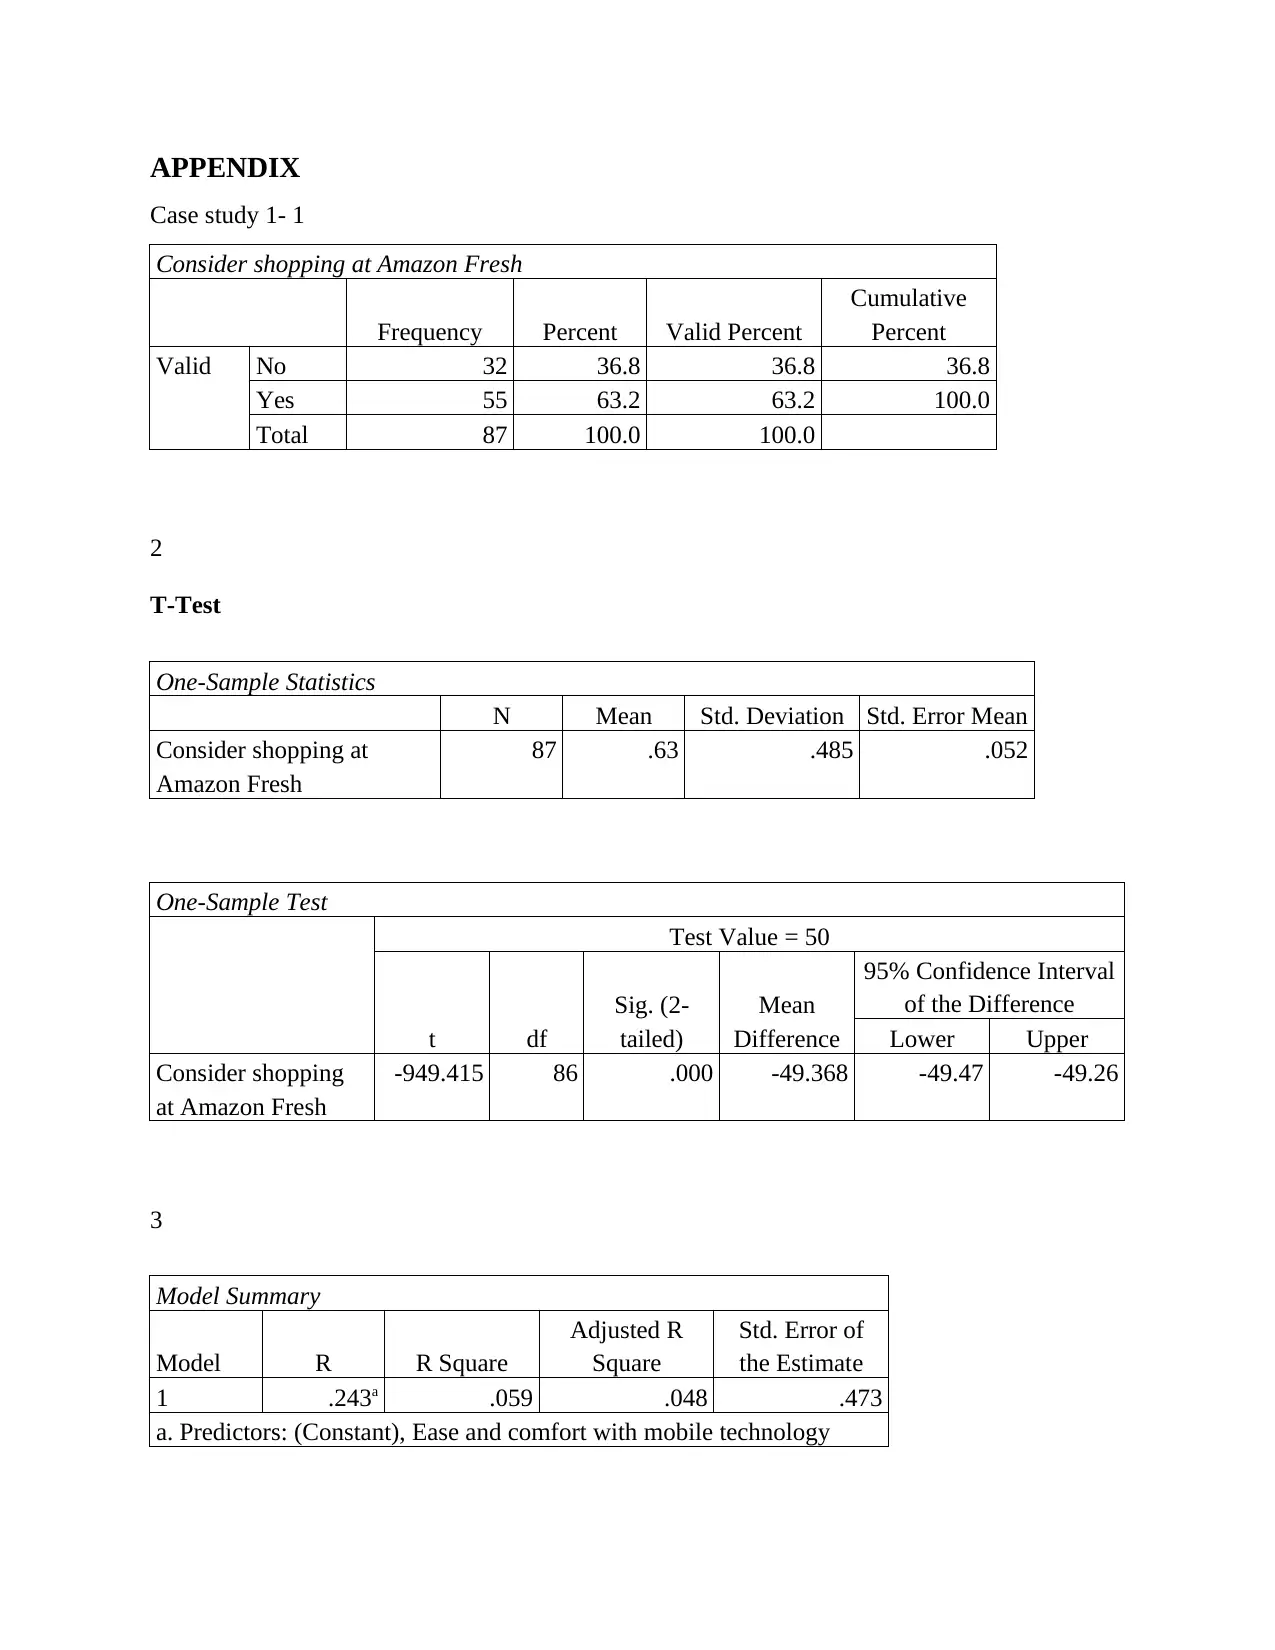
By the analysis of the descriptive statistics it is clear that the majority of the respondent
agrees to the fact that they consider shopping at Amazon Fresh. This was agreed by 63 % of the
respondent and the remaining one disagreed that is 36 %.
2
H0- The proportion of people considering shopping at Amazon Fresh is not greater than 50 %.
H1- The proportion of people considers shopping at Amazon Fresh is greater than 50 %
With the help of the calculation placed in appendix it is clear that the alternate hypothesis
is being accepted and the null is being rejected (Osuagwu, 2020). This is pertaining to the fact
that the p value is 0.00 which implies that the proportion of people considering shopping is more
than 50 % at Amazon Fresh.
3
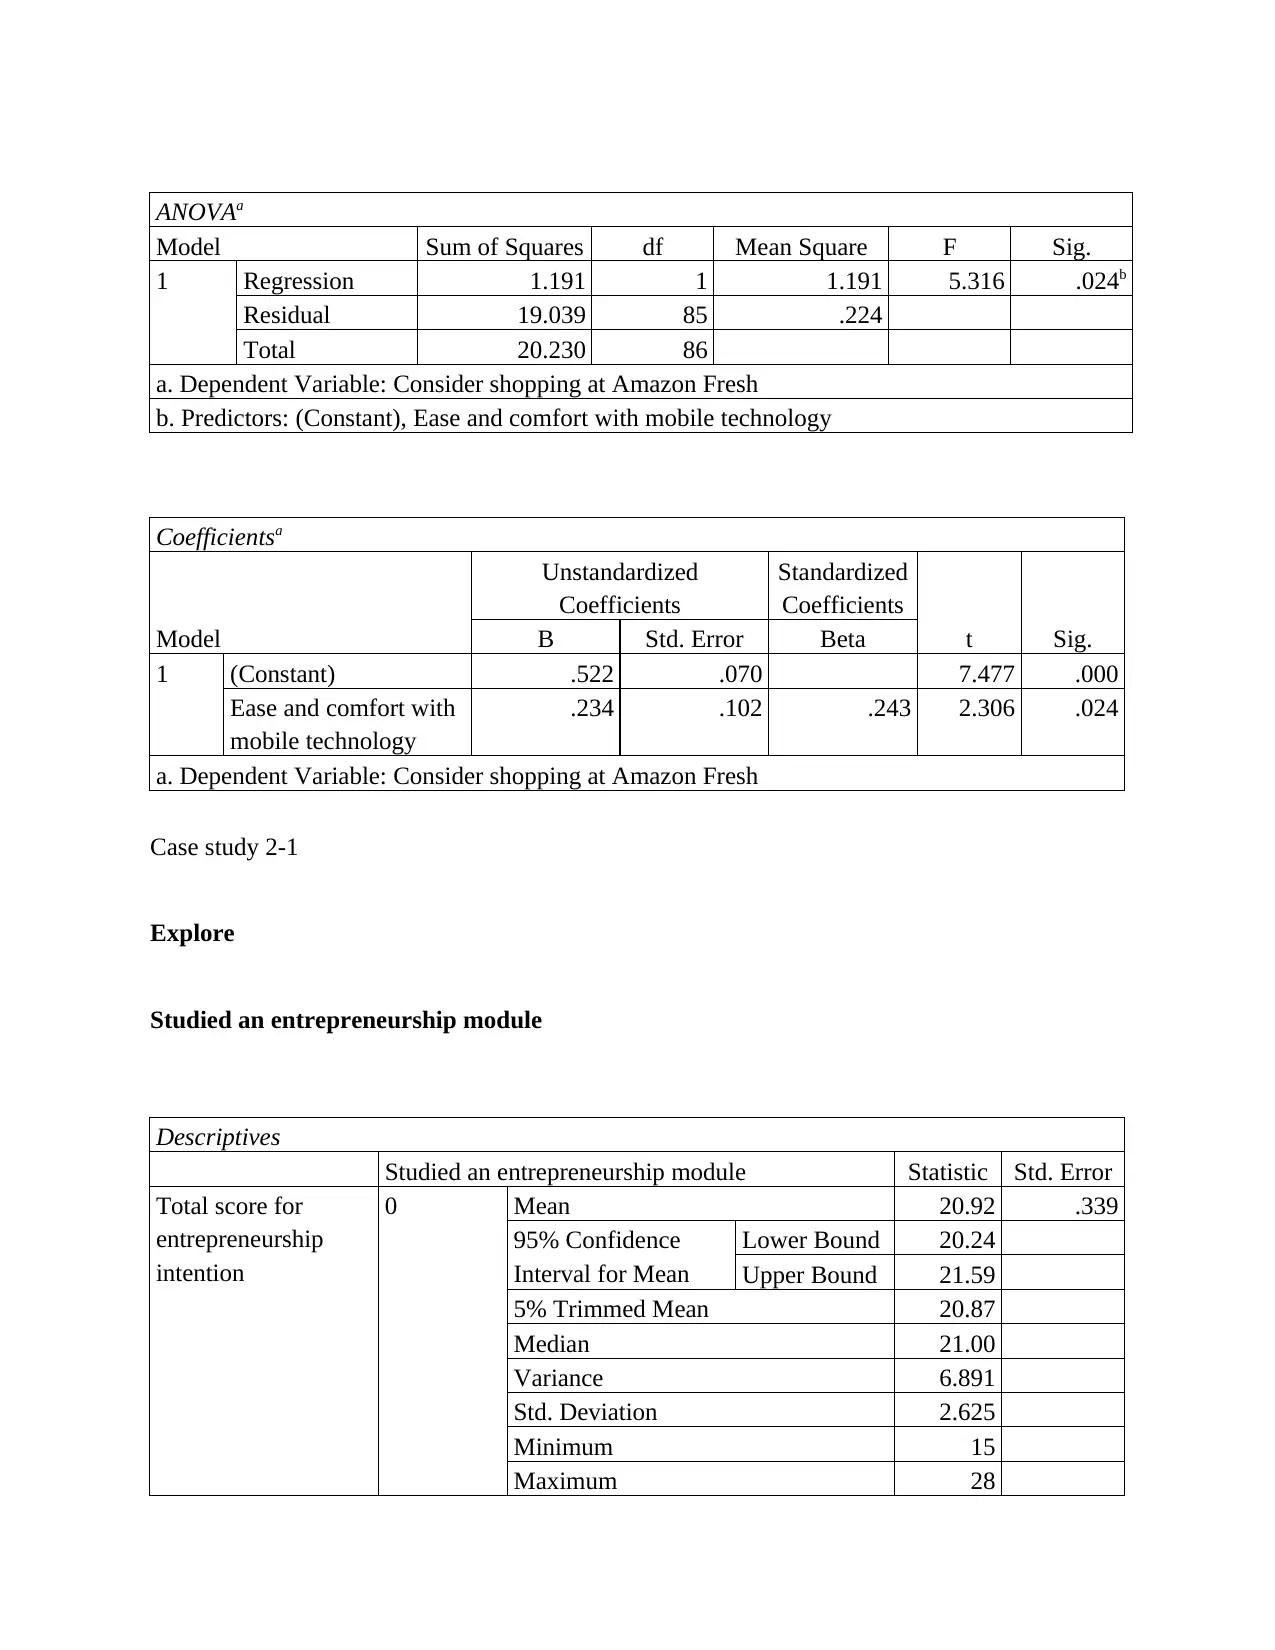
H0- There is a not any difference in people considering shopping at Amazon Fresh and people
who are comfortable with using mobile technology.
H1- There is a difference between people considering shopping at Amazon Fresh and people
who are comfortable with using mobile technology.
By the evaluation of the regression table it is clear that the alternate hypothesis is being
accepted because the significance value is less than 0.05. hence, this implies that there is a
difference being present among various people considering shopping at Amazon Fresh and the
CASE STUDY 1
1
Consider shopping at Amazon Fresh
Frequency Percent Valid Percent
Cumulative
Percent
Valid No 32 36.8 36.8 36.8
Yes 55 63.2 63.2 100.0
Total 87 100.0 100.0
By the analysis of the descriptive statistics it is clear that the majority of the respondent
agrees to the fact that they consider shopping at Amazon Fresh. This was agreed by 63 % of the
respondent and the remaining one disagreed that is 36 %.
2
H0- The proportion of people considering shopping at Amazon Fresh is not greater than 50 %.
H1- The proportion of people considers shopping at Amazon Fresh is greater than 50 %
With the help of the calculation placed in appendix it is clear that the alternate hypothesis
is being accepted and the null is being rejected (Osuagwu, 2020). This is pertaining to the fact
that the p value is 0.00 which implies that the proportion of people considering shopping is more
than 50 % at Amazon Fresh.
3
H0- There is a not any difference in people considering shopping at Amazon Fresh and people
who are comfortable with using mobile technology.
H1- There is a difference between people considering shopping at Amazon Fresh and people
who are comfortable with using mobile technology.
By the evaluation of the regression table it is clear that the alternate hypothesis is being
accepted because the significance value is less than 0.05. hence, this implies that there is a
difference being present among various people considering shopping at Amazon Fresh and the
⊘ This is a preview!⊘
Do you want full access?
Subscribe today to unlock all pages.
Trusted by 1+ million students worldwide
people who are comfortable by using the mobile technology. the R is 24.3 % and this implies
that correlation between all the variable is only 23 which is low. Along with this R square is 5.9
% which indicates that the change in independent variable will be causing a change of 5.9 % in
the dependent variable.
4
The conducting of the hypothesis is very essential as compared to the simple statistical
calculation (Bougie and Sekaran, 2019). This is because of the reason that this hypothesis will be
providing better and precise outcome for the effective working and the hypothesis will be proved
correct.
Paraphrase This Document
Need a fresh take? Get an instant paraphrase of this document with our AI Paraphraser
CASE STUDY 2
1
By the examination of the descriptive statistics it is clear that total score for the intention
of entrepreneurship for the people not attending module was on an average 20.92. on the other
side, for the people attending the module was 22.23 (Carcary, 2020). with this it is clear that on
an average the people having knowledge of the module will be having more entrepreneurial
intention in better and effective manner. Also test of normality is proven correct as the
significance value is less than the standard of 0.05.
2
H0- There is no significant relation between average score for entrepreneurship intention and
knowledge of person.
H1- There is significant relation between average score for entrepreneurship intention and
knowledge of person.
By the analysis of the ANOVA table it is clear that the alternate hypothesis is being
accepted and the null is being rejected. This is because of the reason that the significance value is
0.009 which is less than the standard of 0.05. Also the average people attending the module is
22.23 and people not attending is 20.92. hence, this implies that the people attending the module
are more as compared to people not attending.
3
H0- There is not any significant effect being created by university department over the score for
entrepreneurship intention.
H1- There is a significant effect being created by university department over the score for
entrepreneurship intention.
On the evaluation of the data it is clear that there is a significant effect being created by
the university department over the score of entrepreneurship intention. This is because of the
reason that the significance value is 0.001 which is less than the standard of 0.05.
4
The p value within the hypothesis is the value against which the hypothesis is being
tested. In case the test value is less than the p value then the alternate hypothesis is being
accepted. On the other hand, in case the test value is more than the p value then it implies that the

null hypothesis is accepted and there is not any relation within the variables (Martinsuo, 2020).
The major limitation of p value is that it will be indicating the fact that how incompatible the
data is specified statistical models.
The major limitation of p value is that it will be indicating the fact that how incompatible the
data is specified statistical models.
⊘ This is a preview!⊘
Do you want full access?
Subscribe today to unlock all pages.
Trusted by 1+ million students worldwide
REFERENCES
Books and Journals
Bell, E., Harley, B. and Bryman, A., 2022. Business research methods. Oxford university press.
Bougie, R. and Sekaran, U., 2019. Research methods for business: A skill building approach.
John Wiley & Sons.
Carcary, M., 2020. The research audit trail: Methodological guidance for application in
practice. Electronic Journal of Business Research Methods. 18(2). pp.pp166-177.
Martinsuo, M., 2020. The management of values in project business: Adjusting beliefs to
transform project practices and outcomes. Project Management Journal. 51(4). pp.389-
399.
Mitchell, A. and Rich, M., 2020. Business School Teaching of Research Methods–A Review of
Literature and Initial Data Collection for Undergraduate Business School
Students. Electronic Journal of Business Research Methods. 18(2). pp.pp100-114.
Osuagwu, L., 2020. Research methods: Issues and research direction. Business and Management
Research. 9(3). pp.46-55.
Xian, H. and Meng-Lewis, Y., 2018. Business research methods for Chinese students: a
practical guide to your research project. Sage.
Paraphrase This Document
Need a fresh take? Get an instant paraphrase of this document with our AI Paraphraser
APPENDIX
Case study 1- 1
Consider shopping at Amazon Fresh
Frequency Percent Valid Percent
Cumulative
Percent
Valid No 32 36.8 36.8 36.8
Yes 55 63.2 63.2 100.0
Total 87 100.0 100.0
2
T-Test
One-Sample Statistics
N Mean Std. Deviation Std. Error Mean
Consider shopping at
Amazon Fresh
87 .63 .485 .052
One-Sample Test
Test Value = 50
t df
Sig. (2-
tailed)
Mean
Difference
95% Confidence Interval
of the Difference
Lower Upper
Consider shopping
at Amazon Fresh
-949.415 86 .000 -49.368 -49.47 -49.26
3
Model Summary
Model R R Square
Adjusted R
Square
Std. Error of
the Estimate
1 .243a .059 .048 .473
a. Predictors: (Constant), Ease and comfort with mobile technology
ANOVAa
Model Sum of Squares df Mean Square F Sig.
1 Regression 1.191 1 1.191 5.316 .024b
Residual 19.039 85 .224
Total 20.230 86
a. Dependent Variable: Consider shopping at Amazon Fresh
b. Predictors: (Constant), Ease and comfort with mobile technology
Coefficientsa
Model
Unstandardized
Coefficients
Standardized
Coefficients
t Sig.B Std. Error Beta
1 (Constant) .522 .070 7.477 .000
Ease and comfort with
mobile technology
.234 .102 .243 2.306 .024
a. Dependent Variable: Consider shopping at Amazon Fresh
Case study 2-1
Explore
Studied an entrepreneurship module
Descriptives
Studied an entrepreneurship module Statistic Std. Error
Total score for
entrepreneurship
intention
0 Mean 20.92 .339
95% Confidence
Interval for Mean
Lower Bound 20.24
Upper Bound 21.59
5% Trimmed Mean 20.87
Median 21.00
Variance 6.891
Std. Deviation 2.625
Minimum 15
Maximum 28
⊘ This is a preview!⊘
Do you want full access?
Subscribe today to unlock all pages.
Trusted by 1+ million students worldwide
1 out of 20
Related Documents


Your All-in-One AI-Powered Toolkit for Academic Success.
+13062052269
info@desklib.com
Available 24*7 on WhatsApp / Email
![[object Object]](/_next/static/media/star-bottom.7253800d.svg)
Unlock your academic potential
Copyright © 2020–2026 A2Z Services. All Rights Reserved. Developed and managed by ZUCOL.