Business Research Methodology Report: Questions and Gantt Chart
VerifiedAdded on 2022/10/17
|8
|1064
|12
Report
AI Summary
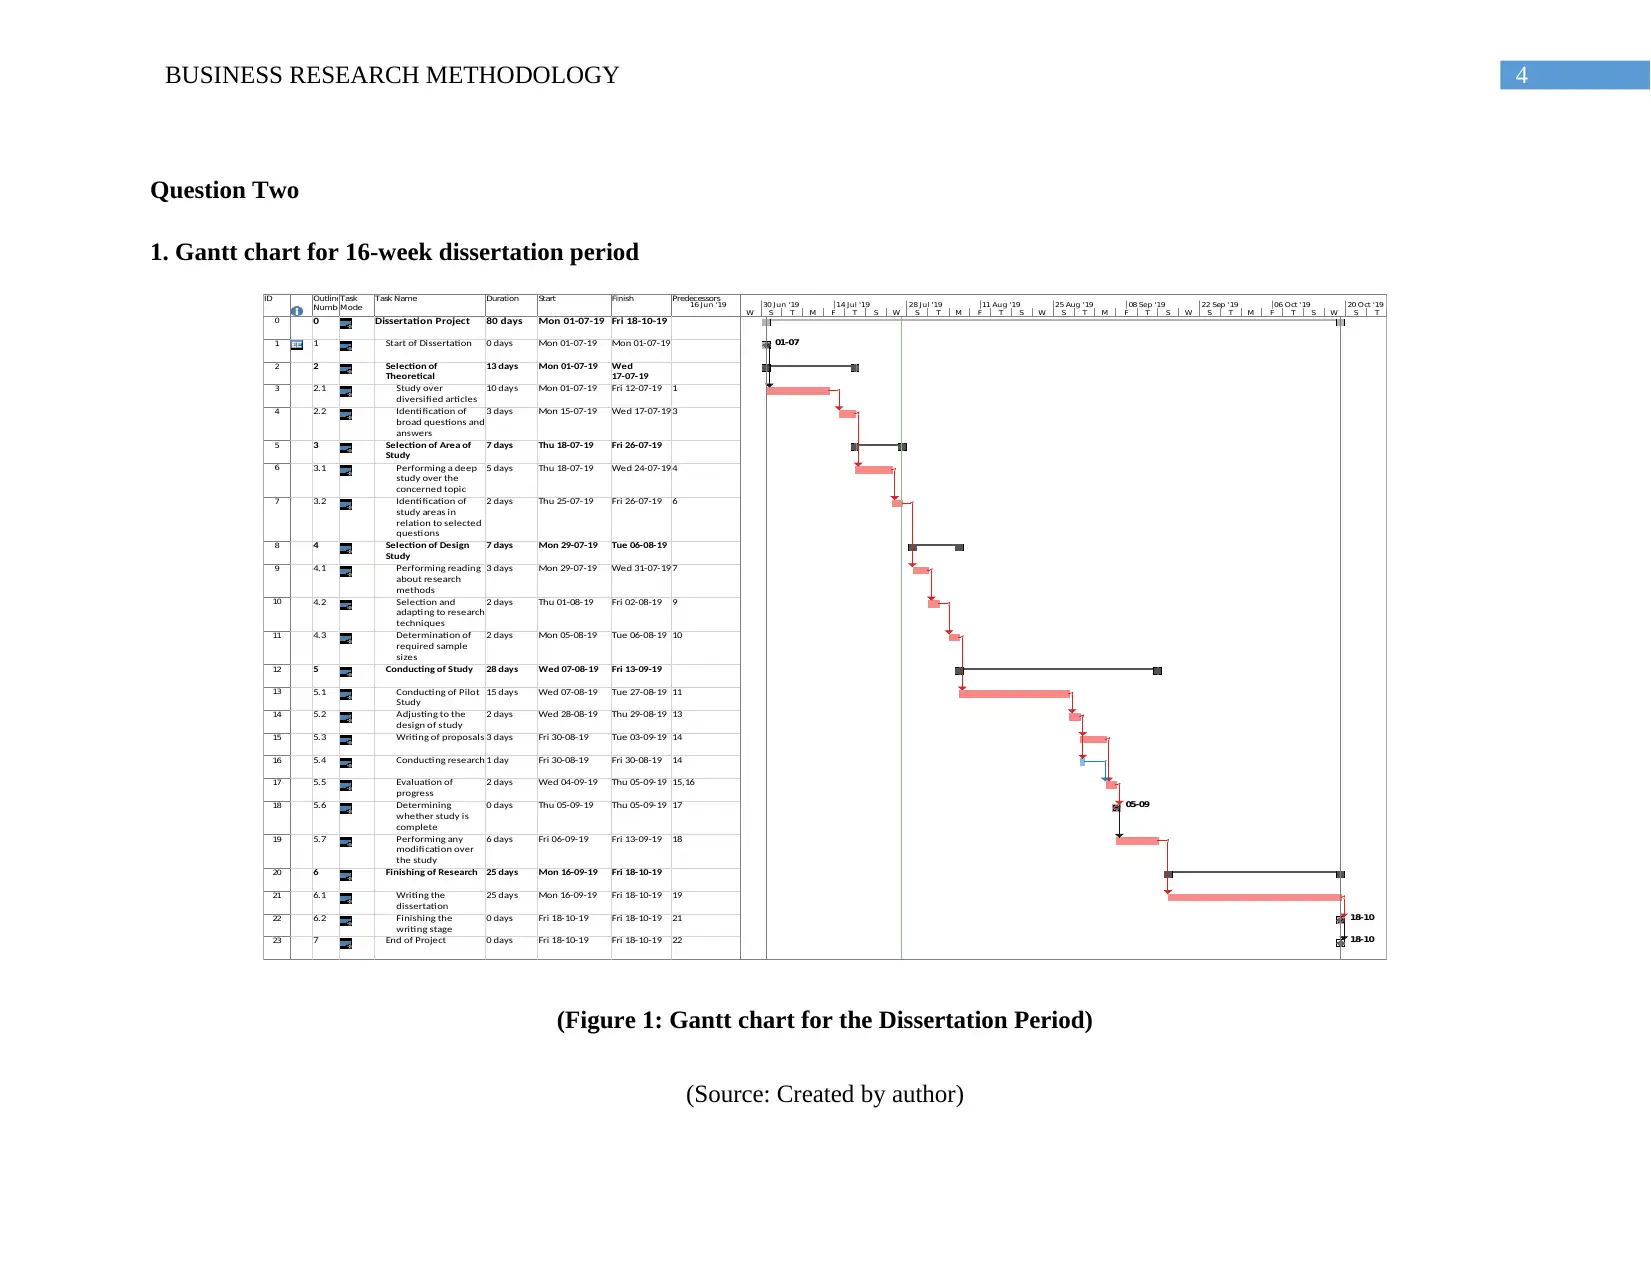
This report addresses key aspects of business research methodology. Question one delves into the qualities of a good research topic, comparing a student's perspective with established literature. It examines factors like clarity, appropriateness, and present importance, while also comparing and contrasting them with the list provided by Saunders et al. (2016). Question two focuses on Gantt charts as a project management tool, detailing their advantages in visualizing project schedules and outlining task activities against a timescale. The report includes a 16-week dissertation Gantt chart. It also discusses the disadvantages of Gantt charts, such as complexity and the need for constant updates. References are provided for all cited sources.

Running head: BUSINESS RESEARCH METHODOLOGY
Business Research Methodology
Name of the Student
Name of the University
Author note
Business Research Methodology
Name of the Student
Name of the University
Author note
Secure Best Marks with AI Grader
Need help grading? Try our AI Grader for instant feedback on your assignments.

1BUSINESS RESEARCH METHODOLOGY
Table of Contents
Question One...................................................................................................................................2
Question Two...................................................................................................................................4
1. Gantt chart for 16-week dissertation period............................................................................4
References........................................................................................................................................7

2BUSINESS RESEARCH METHODOLOGY
Question One
A research can be defined as a comprehensive task and it requires a great kind of effort to
perform deep work of research. There are certain qualities that should be incorporated for
presenting a good research. These qualities are listed as follows:
1. Clarity – The topic of research should have a clear form of outcome. It should be
easily understandable and future work of research could be performed over the topic (Krueger
2014). The research topic should comprise of a proper sense of direction that would be able to
guide the individual doing the research.
2. Appropriateness – The language within the research topic should be extremely simple
to understand. Technical terms should be used in proper manner wherever it would be necessary
(Mertens 2014). These terms should be properly relevant and thus the ethics should be
maintained.
3. Well-defined – The topic of research should be well-phrased and well-defined. Any
kind of biasness should not be indirectly, directly or willingly present within the research
problem or the topic of research.
4. Present Importance – The researcher who would propose the research topic should
consider the present value of research (Hart 2018). The topic should be beneficial for the
common good and thus be able to provide different kind of benefits towards the field of study.
Comparing with the list of Saunders et al., 2016, it could be discussed that I have added
the features of current importance of the topic and clarity. I have completely agreed with the list
proposed by the author. I have also questioned the importance of the quality of present topic
importance that has been incorporated by me. These are certain kind of benefits that could be

3BUSINESS RESEARCH METHODOLOGY
incurred with the help of bringing in clarity within the topic of research by detailing them. The
proposed factors by the author help in understanding the ways in which a good form of research
topic could be formed. It also discusses the fact that whether the research topic would prove to be
beneficial and thus match with the career prospects of the researcher.
Secure Best Marks with AI Grader
Need help grading? Try our AI Grader for instant feedback on your assignments.

4BUSINESS RESEARCH METHODOLOGY
Question Two
1. Gantt chart for 16-week dissertation period
ID Outline
Number
Task
Mode
Task Name Duration Start Finish Predecessors
0 0 Dissertation Project 80 days Mon 01-07-19 Fri 18-10-19
1 1 Start of Dissertation 0 days Mon 01-07-19 Mon 01-07-19
2 2 Selection of
Theoretical
Framework
13 days Mon 01-07-19 Wed
17-07-19
3 2.1 Study over
diversified articles
10 days Mon 01-07-19 Fri 12-07-19 1
4 2.2 Identification of
broad questions and
answers
3 days Mon 15-07-19 Wed 17-07-193
5 3 Selection of Area of
Study
7 days Thu 18-07-19 Fri 26-07-19
6 3.1 Performing a deep
study over the
concerned topic
5 days Thu 18-07-19 Wed 24-07-194
7 3.2 Identification of
study areas in
relation to selected
questions
2 days Thu 25-07-19 Fri 26-07-19 6
8 4 Selection of Design
Study
7 days Mon 29-07-19 Tue 06-08-19
9 4.1 Performing reading
about research
methods
3 days Mon 29-07-19 Wed 31-07-197
10 4.2 Selection and
adapting to research
techniques
2 days Thu 01-08-19 Fri 02-08-19 9
11 4.3 Determination of
required sample
sizes
2 days Mon 05-08-19 Tue 06-08-19 10
12 5 Conducting of Study 28 days Wed 07-08-19 Fri 13-09-19
13 5.1 Conducting of Pilot
Study
15 days Wed 07-08-19 Tue 27-08-19 11
14 5.2 Adjusting to the
design of study
2 days Wed 28-08-19 Thu 29-08-19 13
15 5.3 Writing of proposals 3 days Fri 30-08-19 Tue 03-09-19 14
16 5.4 Conducting research 1 day Fri 30-08-19 Fri 30-08-19 14
17 5.5 Evaluation of
progress
2 days Wed 04-09-19 Thu 05-09-19 15,16
18 5.6 Determining
whether study is
complete
0 days Thu 05-09-19 Thu 05-09-19 17
19 5.7 Performing any
modification over
the study
6 days Fri 06-09-19 Fri 13-09-19 18
20 6 Finishing of Research 25 days Mon 16-09-19 Fri 18-10-19
21 6.1 Writing the
dissertation
25 days Mon 16-09-19 Fri 18-10-19 19
22 6.2 Finishing the
writing stage
0 days Fri 18-10-19 Fri 18-10-19 21
23 7 End of Project 0 days Fri 18-10-19 Fri 18-10-19 22
01-07
05-09
18-10
18-10
W S T M F T S W S T M F T S W S T M F T S W S T M F T S W S T
16 Jun '19 30 Jun '19 14 Jul '19 28 Jul '19 11 Aug '19 25 Aug '19 08 Sep '19 22 Sep '19 06 Oct '19 20 Oct '19
(Figure 1: Gantt chart for the Dissertation Period)
(Source: Created by author)

5BUSINESS RESEARCH METHODOLOGY
Gantt charts help in producing a visual representation of the activities that are defined
with the help of project management. They primarily help in outlining of task activities that are
mainly involved within the project. They outline the order of activities against a timescale. The
timing of every kind of task is performed and visualized with a time scale (Skobelev 2015). With
the help of a Gantt chart, project managers working over any project would be helped with the
following areas:
1. Determining the start and end date of any project.
2. Understanding when a particular task would start or finish
3. Getting a sound knowledge about the duration of each task.
By understanding these aspects, it would become extremely easy for the project manager
to understand and cover each aspect of the concerned project within any mentioned time frame.
Some disadvantages of Gantt chart over any project could be discussed as:
1. Nature of Complexity – There can be some situations in which a large number of
tasks that would be undertaken might get piled off. Understanding the complexity of every
activity within the project could be critical for project managers in some aspects (Kostalova,
Tetrevova and Svedik 2015). Hence, the use of Gantt chart might not be beneficial for a small
enterprise.
2. Need of constant update – There might be several forms of changes within a project
during the undergoing of their related activities. Hence, the person responsible for maintaining
the project aspects should bring in agility within work in order to bring in changes within the
chart on a frequent basis.

6BUSINESS RESEARCH METHODOLOGY
3. Difficult in viewing – A computer screen is primarily required in order to view the
different task activities and the ways in which they are divided in proper segments (Hazır 2015).
These different segments cannot be fully viewed in a single portion of the screen and thus have
to be divided accordingly in order to bring in best form of view for the people or stakeholders.
4. Difficulty in estimating the amount of work – Every bar present within the Gantt
chart indicates the period of time over which certain particular tasks would need to be completed.
A user would not be able to understand the level of resources that would be required for the
achievement of the discussed tasks. Hence, a long bar might take 20 man hours while on the
other hand a shorter task might require 500 man hours.
Paraphrase This Document
Need a fresh take? Get an instant paraphrase of this document with our AI Paraphraser

7BUSINESS RESEARCH METHODOLOGY
References
Hart, C., 2018. Doing a literature review: Releasing the research imagination. Sage.
Hazır, Ö., 2015. A review of analytical models, approaches and decision support tools in project
monitoring and control. International Journal of Project Management, 33(4), pp.808-815.
Kostalova, J., Tetrevova, L. and Svedik, J., 2015. Support of project management methods by
project management information system. Procedia-Social and Behavioral Sciences, 210, pp.96-
104.
Krueger, R.A., 2014. Focus groups: A practical guide for applied research. Sage publications.
Mertens, D.M., 2014. Research and evaluation in education and psychology: Integrating
diversity with quantitative, qualitative, and mixed methods. Sage publications.
Skobelev, P., 2015. Multi-agent systems for real-time adaptive resource management.
In Industrial Agents (pp. 207-229). Morgan Kaufmann.
1 out of 8
Related Documents

Your All-in-One AI-Powered Toolkit for Academic Success.
+13062052269
info@desklib.com
Available 24*7 on WhatsApp / Email
Unlock your academic potential
© 2024 | Zucol Services PVT LTD | All rights reserved.