Business Research Case Study: Self-Checkout Counters and Amazon Fresh
VerifiedAdded on 2023/06/08
|18
|2539
|139
Case Study
AI Summary
This assignment presents a business research case study focusing on the analysis of self-checkout counters and consumer behavior related to Amazon Fresh. Part one includes the examination of users and non-users of self-checkout counters, focusing on demographic differences, perceptions, and situational factors affecting usage intention, employing convenience sampling and independent t-tests. Part two consists of two case studies: the first analyzes consumer shopping considerations at Amazon Fresh using hypothesis testing to determine if the proportion of people considering shopping there is greater than 50% and if there's a difference between those comfortable with mobile technology. The second case study evaluates the impact of studying an entrepreneurship module on students' entrepreneurial intentions, utilizing ANOVA to assess differences in average scores based on education and university department. The analysis includes descriptive statistics, normality tests, and p-value interpretations to validate hypotheses and provide insights into consumer behavior and entrepreneurial inclinations.

Business Research Methods
Paraphrase This Document
Need a fresh take? Get an instant paraphrase of this document with our AI Paraphraser

TABLE OF CONTENTS
PART ONE......................................................................................................................................1
1...................................................................................................................................................1
2...................................................................................................................................................1
3...................................................................................................................................................2
4...................................................................................................................................................2
5...................................................................................................................................................2
PART TWO.....................................................................................................................................3
CASE STUDY 1..............................................................................................................................3
1...................................................................................................................................................3
2...................................................................................................................................................3
3...................................................................................................................................................3
4...................................................................................................................................................4
CASE STUDY 2..............................................................................................................................4
1...................................................................................................................................................4
2...................................................................................................................................................4
3...................................................................................................................................................5
4...................................................................................................................................................5
REFERENCES................................................................................................................................6
APPENDIX......................................................................................................................................7
PART ONE
1
The main of the current study is to give emphasis on having the examination of the users
and non-users of self-checkout counters. The particular study has focused on gaining the depth
understanding about the highlighted subject matter (Bell, Harley and Bryman, 2022). The
research questions which are basically focused includes identifying the demographic differences
between users and non-users of self-checkout counters, how they
perceive the characteristics of self-checkout counters in Singapore and how situational factors
affect their intention to use the terminals. These are the questions which is focused in order to
meet the aim of investigation.
2
A
The survey instrument was categorised in three different stages which are as follows-
The first section involves measuring that whether respondent us user of self- checkout
counter or not.
The second section included the five- point Likert scale question relating to the
perception of respondent with regards to the self- checkout counters.
The last section included the seven five point Likert scale statement which included the
likelihood of using the self- checkout counters in different prevailing situation.
B
The second section was named five point Likert scale question which were asked in
order to measure the perception of self- checkout counters and their relative advantage over staff
cashier. This category was subdivided in to different categories and this included Relative
Advantage, Perceived Complexity, Reliability and Fun. All these variables were used in order to
meet the requirement of the company and prove the hypothesis correct.
C
The Cronbach alpha is a tool which assist the researcher in analysing and checking the
reliability of the data set. This test is important to be performed because it assist in measuring
the internal consistency of the data. It is important to include it within the paper because it
outlines that the data selected is reliable and accurate results will be gained.
1
1
The main of the current study is to give emphasis on having the examination of the users
and non-users of self-checkout counters. The particular study has focused on gaining the depth
understanding about the highlighted subject matter (Bell, Harley and Bryman, 2022). The
research questions which are basically focused includes identifying the demographic differences
between users and non-users of self-checkout counters, how they
perceive the characteristics of self-checkout counters in Singapore and how situational factors
affect their intention to use the terminals. These are the questions which is focused in order to
meet the aim of investigation.
2
A
The survey instrument was categorised in three different stages which are as follows-
The first section involves measuring that whether respondent us user of self- checkout
counter or not.
The second section included the five- point Likert scale question relating to the
perception of respondent with regards to the self- checkout counters.
The last section included the seven five point Likert scale statement which included the
likelihood of using the self- checkout counters in different prevailing situation.
B
The second section was named five point Likert scale question which were asked in
order to measure the perception of self- checkout counters and their relative advantage over staff
cashier. This category was subdivided in to different categories and this included Relative
Advantage, Perceived Complexity, Reliability and Fun. All these variables were used in order to
meet the requirement of the company and prove the hypothesis correct.
C
The Cronbach alpha is a tool which assist the researcher in analysing and checking the
reliability of the data set. This test is important to be performed because it assist in measuring
the internal consistency of the data. It is important to include it within the paper because it
outlines that the data selected is reliable and accurate results will be gained.
1
⊘ This is a preview!⊘
Do you want full access?
Subscribe today to unlock all pages.
Trusted by 1+ million students worldwide
3
In the current data collection, the emphasis has been provided on using the convenience
sampling techniques so that insights from the 778 respondents can be provided. This type of the
sampling technique is the part of the non- probability method which is easy to contact with the
targeted audience. In the obtained respondents there is 397 were female and rest of the other was
male.
4
A
With regards to the Demographic variables in the use of self-checkout counters the
independent t- test was conducted. The test concluded that there was a statistical related being
present within the variables (Lo, Rey-Martí and Botella-Carrubi, 2020). This can be interpreted
because of the reason that the significance value is 0.24 and this implies that there is not any
difference being present within the use of self- checkout counters across different demographic
segments.
B
This 4 is the number of trials that is the number up to which the test has been run over.
There is not any formula for calculating the trial as the trial are the number of time the test is
running.
C
In the section evaluation of self- checkout counters it was seen that the independent t-
test was used for comparing the average scores for all the measure between the users and the
non- users. With this test, the result highlighted that output was found to be statistically
significant but with the moderate size. This is because of the reason that the p value is less than
the standard of 0.05 and this implies that the statistically it is proven correct and because of this
the average scores are different for users and non- users.
5
The recent study has given emphasis on self- checkout counters is one of the significant
strategy that is related with gaining the ability by retailers to decline the operational cost. The
emphasis on further implication is given on having the effective level of focus on large sampling
size so that greater outcomes can be achieved to identified situational factors. Along with this it
was concluded that the use of technology is also reducing to a great extent among the
2
Paraphrase This Document
Need a fresh take? Get an instant paraphrase of this document with our AI Paraphraser
consumers. Hence, this will be affecting the consumer and the use of self- checkout counters. It
was also concluded that the use of self- checkout system was assistive in attracting the
consumers.
PART TWO
CASE STUDY 1
1
Consider shopping at Amazon Fresh
Frequency Percent Valid Percent
Cumulative
Percent
Valid No 32 36.8 36.8 36.8
Yes 55 63.2 63.2 100.0
Total 87 100.0 100.0
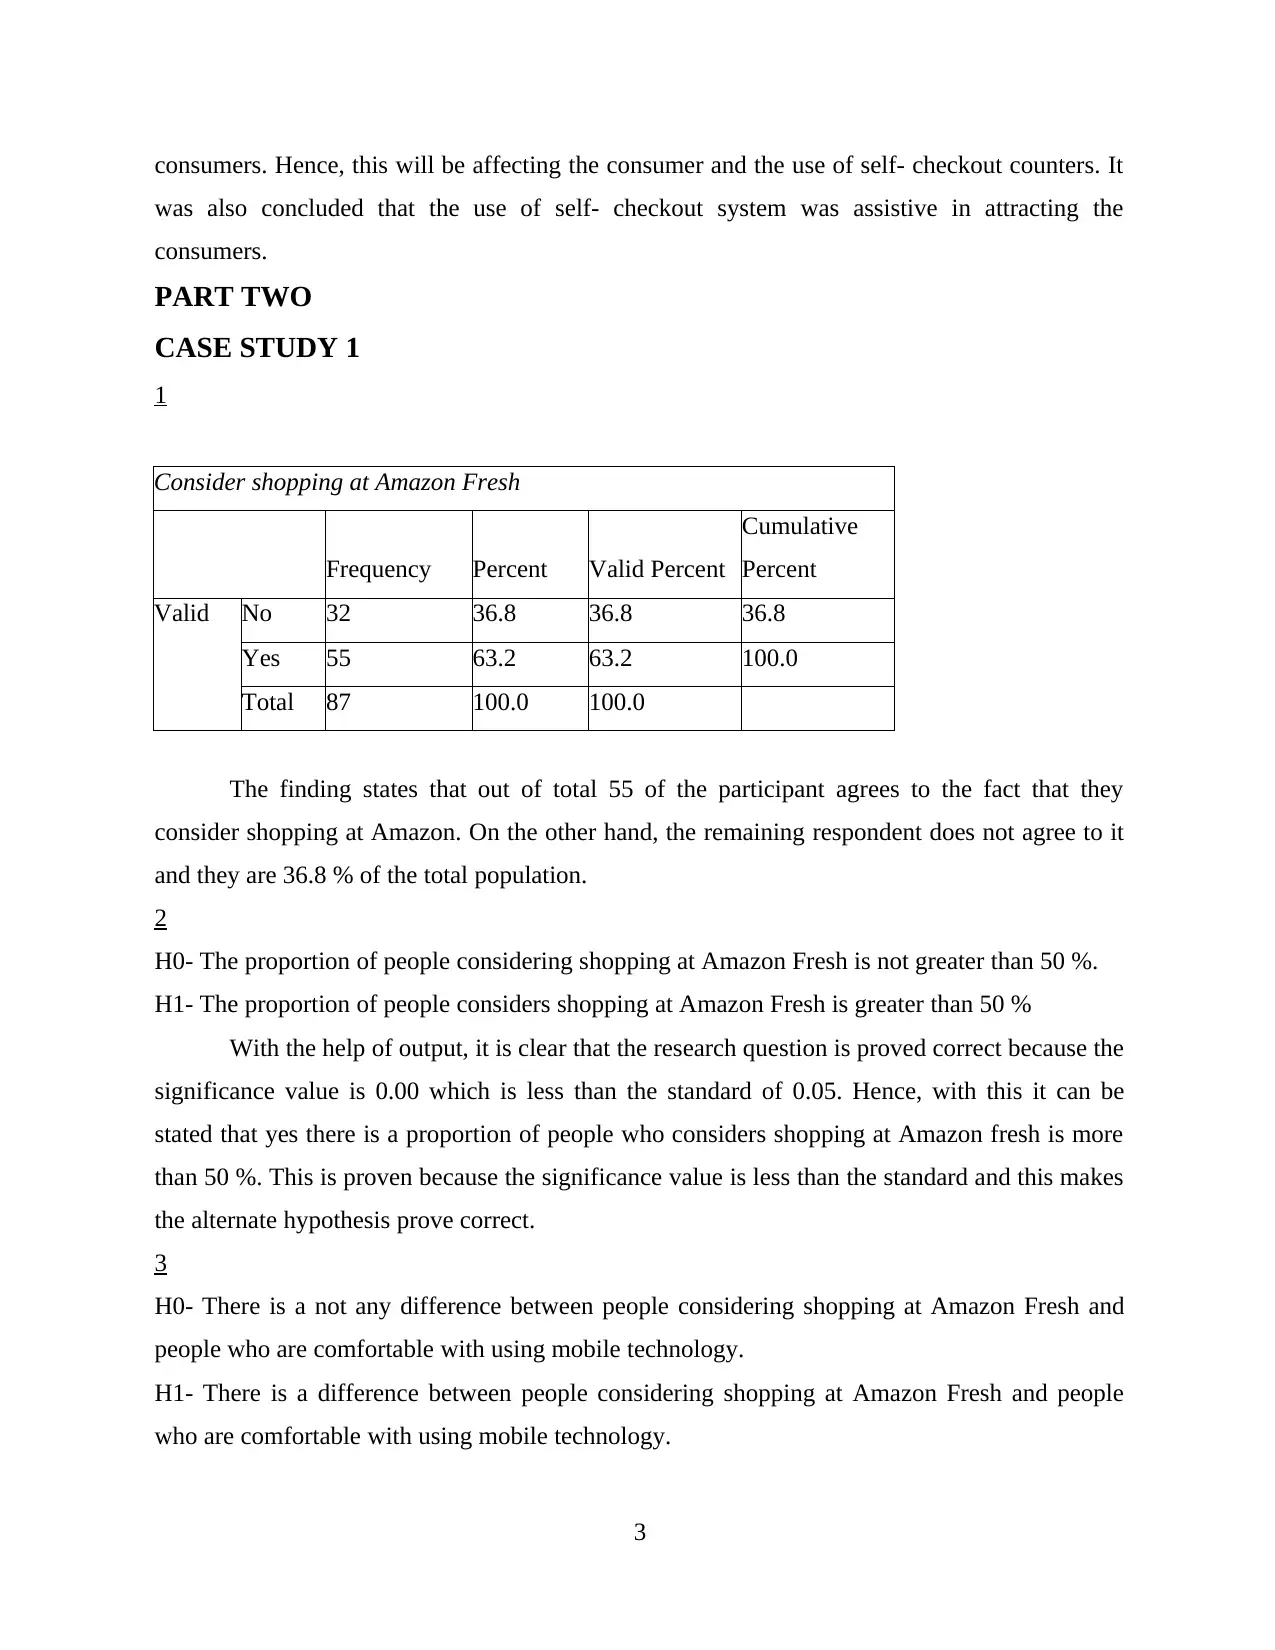
The finding states that out of total 55 of the participant agrees to the fact that they
consider shopping at Amazon. On the other hand, the remaining respondent does not agree to it
and they are 36.8 % of the total population.
2
H0- The proportion of people considering shopping at Amazon Fresh is not greater than 50 %.
H1- The proportion of people considers shopping at Amazon Fresh is greater than 50 %
With the help of output, it is clear that the research question is proved correct because the
significance value is 0.00 which is less than the standard of 0.05. Hence, with this it can be
stated that yes there is a proportion of people who considers shopping at Amazon fresh is more
than 50 %. This is proven because the significance value is less than the standard and this makes
the alternate hypothesis prove correct.
3
H0- There is a not any difference between people considering shopping at Amazon Fresh and
people who are comfortable with using mobile technology.
H1- There is a difference between people considering shopping at Amazon Fresh and people
who are comfortable with using mobile technology.
3
was also concluded that the use of self- checkout system was assistive in attracting the
consumers.
PART TWO
CASE STUDY 1
1
Consider shopping at Amazon Fresh
Frequency Percent Valid Percent
Cumulative
Percent
Valid No 32 36.8 36.8 36.8
Yes 55 63.2 63.2 100.0
Total 87 100.0 100.0
The finding states that out of total 55 of the participant agrees to the fact that they
consider shopping at Amazon. On the other hand, the remaining respondent does not agree to it
and they are 36.8 % of the total population.
2
H0- The proportion of people considering shopping at Amazon Fresh is not greater than 50 %.
H1- The proportion of people considers shopping at Amazon Fresh is greater than 50 %
With the help of output, it is clear that the research question is proved correct because the
significance value is 0.00 which is less than the standard of 0.05. Hence, with this it can be
stated that yes there is a proportion of people who considers shopping at Amazon fresh is more
than 50 %. This is proven because the significance value is less than the standard and this makes
the alternate hypothesis prove correct.
3
H0- There is a not any difference between people considering shopping at Amazon Fresh and
people who are comfortable with using mobile technology.
H1- There is a difference between people considering shopping at Amazon Fresh and people
who are comfortable with using mobile technology.
3
With the analysis of the output it is evident that RQ 2 is proved correct. This is because
of the reason that the significance value is 0.024 which is less than standard value. Thus, this
clearly states that there is a difference between the people who consider shopping at Amazon
Fresh as compared to the people who are comfortable with the use of mobile technology and
those who are not.
4
The reason for conducting the hypothesis test instead of comparing the statistics is that it
provides much better output. Hence, with this it can be stated that the hypothesis testing
provides a clear base to the researcher that which variable need to be tested and with which other
variable (Eden and Nielsen, 2020). Along with this the use of hypothesis testing will be
providing accurate and exact data that whether the objective or the hypothesis is being tested
correctly or not. The significance value assists the researcher in analysing the fact that whether
the variables are proving correct or not. In case it will not be proving correct then it implies that
the variables selected are not appropriate.
CASE STUDY 2
1
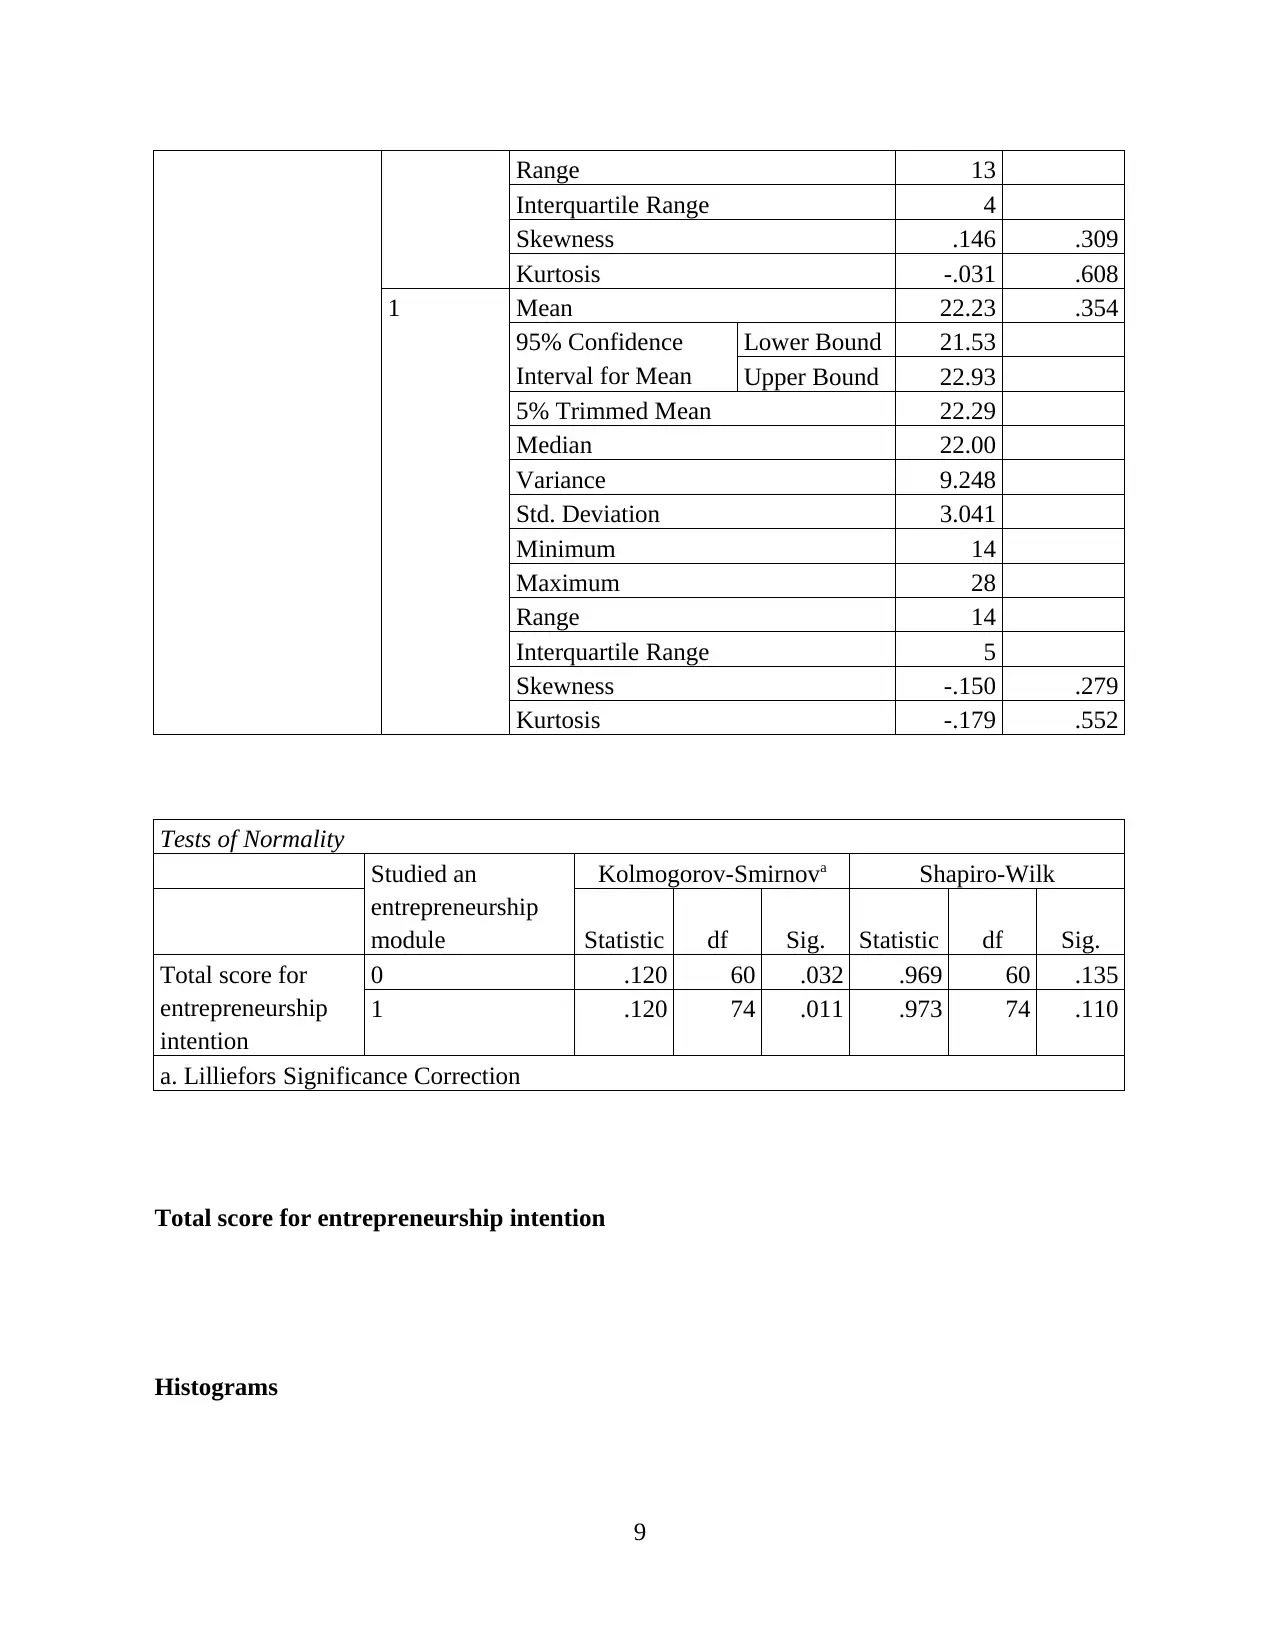
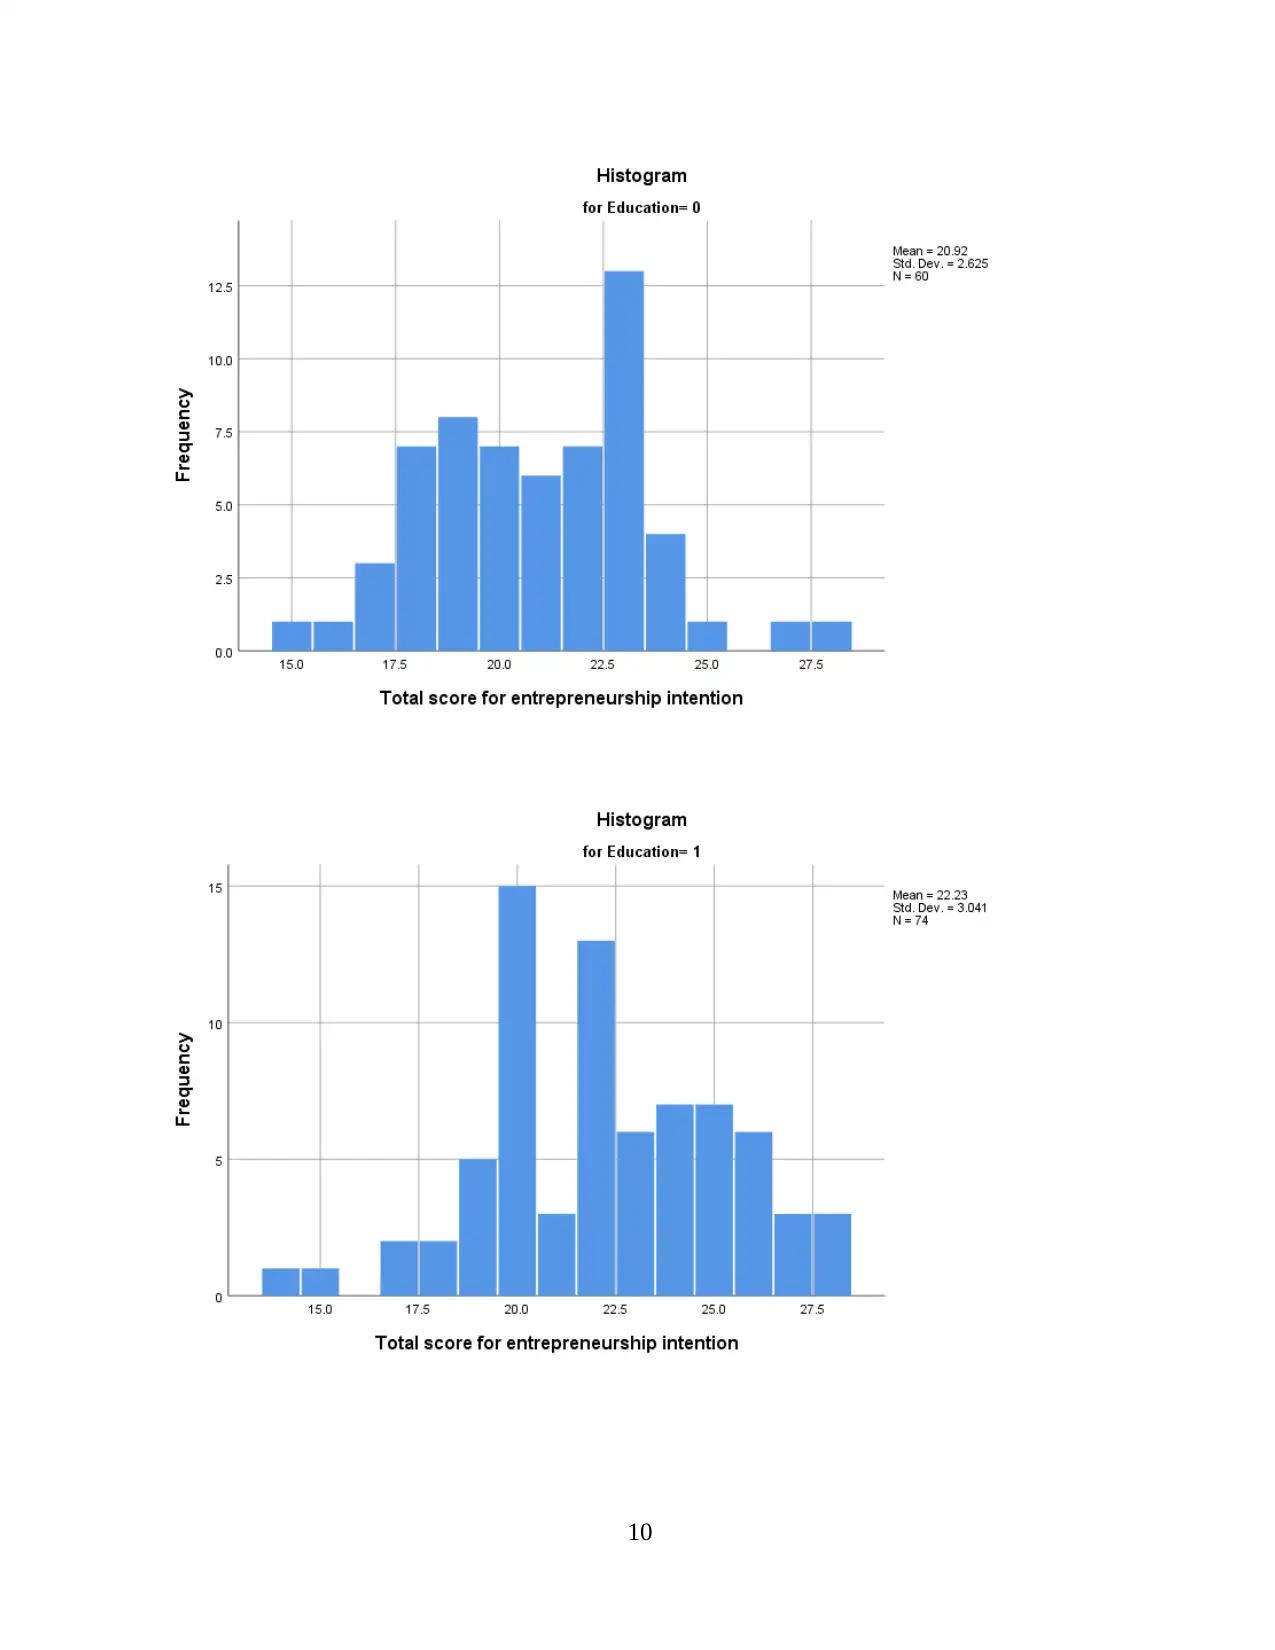
With the help of the descriptive statistics it is clear that the based on the student studying
entrepreneurship module and the total score of entrepreneurship intention is meeting. This is
because of the reason that test of normality listed the significance value less than the standard for
both the option. Hence, with this it can be stated that education and studying of the person
affects the entrepreneurship intention within the person. In case the person will be highly
educated then they will be having the better interest in creating and developing entrepreneurial
category.
2
By the evaluation of the one- way ANOVA it is clear that the alternate hypothesis is
being proven correct because the significance value is 0.009. thus, with this it can be stated that
average score of entrepreneurship intention is significantly different with the student who have
studied entrepreneurship and those who have not. Also the ANOVA output stated that average
score of the entrepreneurship is different in case when the person will be having knowledge of
entrepreneurship module then this will be providing a better base to them for bringing any
entrepreneurial venture.
4
of the reason that the significance value is 0.024 which is less than standard value. Thus, this
clearly states that there is a difference between the people who consider shopping at Amazon
Fresh as compared to the people who are comfortable with the use of mobile technology and
those who are not.
4
The reason for conducting the hypothesis test instead of comparing the statistics is that it
provides much better output. Hence, with this it can be stated that the hypothesis testing
provides a clear base to the researcher that which variable need to be tested and with which other
variable (Eden and Nielsen, 2020). Along with this the use of hypothesis testing will be
providing accurate and exact data that whether the objective or the hypothesis is being tested
correctly or not. The significance value assists the researcher in analysing the fact that whether
the variables are proving correct or not. In case it will not be proving correct then it implies that
the variables selected are not appropriate.
CASE STUDY 2
1
With the help of the descriptive statistics it is clear that the based on the student studying
entrepreneurship module and the total score of entrepreneurship intention is meeting. This is
because of the reason that test of normality listed the significance value less than the standard for
both the option. Hence, with this it can be stated that education and studying of the person
affects the entrepreneurship intention within the person. In case the person will be highly
educated then they will be having the better interest in creating and developing entrepreneurial
category.
2
By the evaluation of the one- way ANOVA it is clear that the alternate hypothesis is
being proven correct because the significance value is 0.009. thus, with this it can be stated that
average score of entrepreneurship intention is significantly different with the student who have
studied entrepreneurship and those who have not. Also the ANOVA output stated that average
score of the entrepreneurship is different in case when the person will be having knowledge of
entrepreneurship module then this will be providing a better base to them for bringing any
entrepreneurial venture.
4
⊘ This is a preview!⊘
Do you want full access?
Subscribe today to unlock all pages.
Trusted by 1+ million students worldwide
3
On the analysis of one- way ANOVA test it is clear that alternate hypothesis is accepted
and the null is rejected. This is pertaining to the fact that significance value is less than the
standard of 0.05. hence, it is evident that the university department also has an effect on the
average score for intention of entrepreneurship. There are different department within the
university and it is necessary that it can affect the average score of entrepreneurship to a great
extent.
4
The p- value is the number which outlines the fact that whether the set of observation
made is correct or not. The use of p- value is very necessary for testing the hypothesis that is
whether it is correct or not. In case the p- value will be in accordance to the standard criteria then
this will be proving the hypothesis correct and otherwise not (Bougie and Sekaran, 2019). The
lower the p- value then it implies that there is string statistical relation between the variables.
The limitation is that this value does not provide a good measure of evidence with regards to the
model which is being tested.
5
Paraphrase This Document
Need a fresh take? Get an instant paraphrase of this document with our AI Paraphraser
REFERENCES
Books and Journals
Bell, E., Harley, B. and Bryman, A., 2022. Business research methods. Oxford university press.
Bougie, R. and Sekaran, U., 2019. Research methods for business: A skill building approach.
John Wiley & Sons.
Eden, L. and Nielsen, B.B., 2020. Research methods in international business: The challenge of
complexity. Journal of International Business Studies. 51(9). pp.1609-1620.
Lo, F.Y., Rey-Martí, A. and Botella-Carrubi, D., 2020. Research methods in business:
Quantitative and qualitative comparative analysis. Journal of Business Research. 115.
pp.221-224.
6
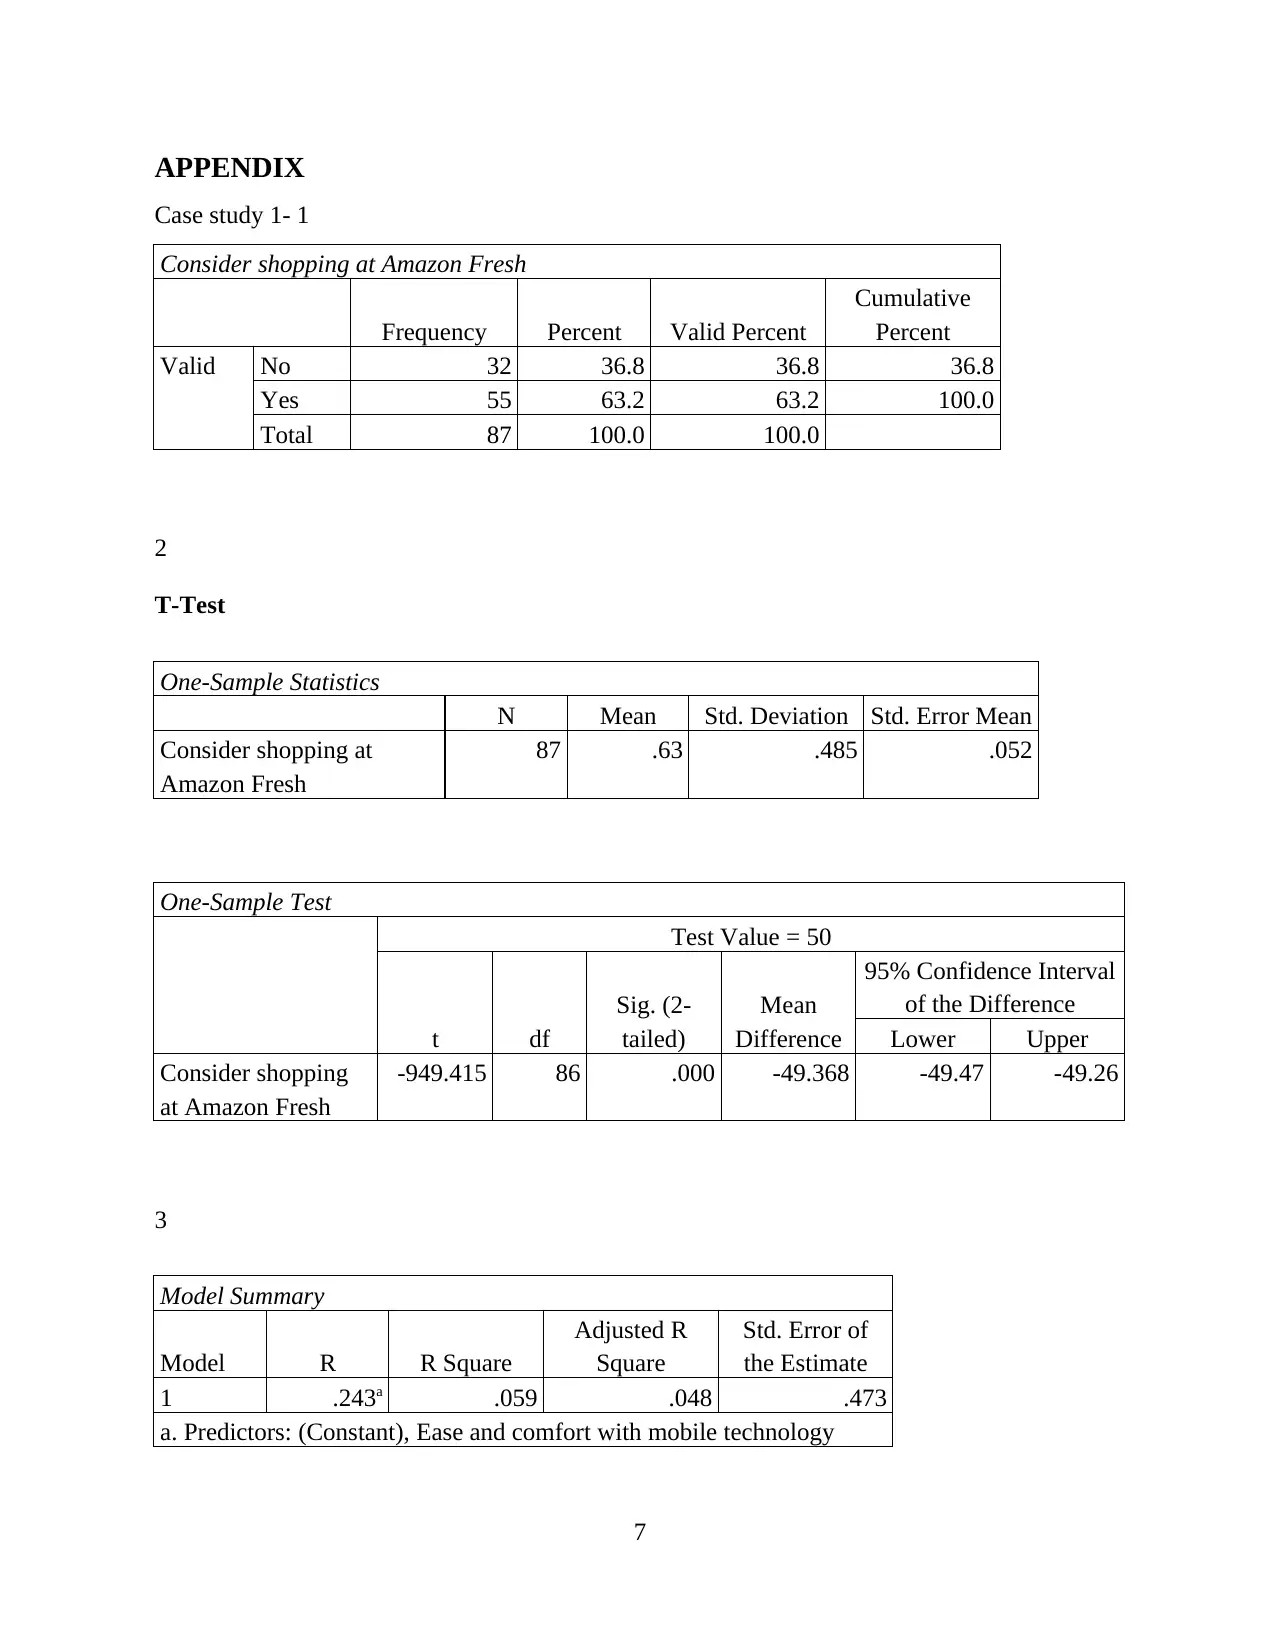
APPENDIX
Case study 1- 1
Consider shopping at Amazon Fresh
Frequency Percent Valid Percent
Cumulative
Percent
Valid No 32 36.8 36.8 36.8
Yes 55 63.2 63.2 100.0
Total 87 100.0 100.0
2
T-Test
One-Sample Statistics
N Mean Std. Deviation Std. Error Mean
Consider shopping at
Amazon Fresh
87 .63 .485 .052
One-Sample Test
Test Value = 50
t df
Sig. (2-
tailed)
Mean
Difference
95% Confidence Interval
of the Difference
Lower Upper
Consider shopping
at Amazon Fresh
-949.415 86 .000 -49.368 -49.47 -49.26
3
Model Summary
Model R R Square
Adjusted R
Square
Std. Error of
the Estimate
1 .243a .059 .048 .473
a. Predictors: (Constant), Ease and comfort with mobile technology
7
⊘ This is a preview!⊘
Do you want full access?
Subscribe today to unlock all pages.
Trusted by 1+ million students worldwide
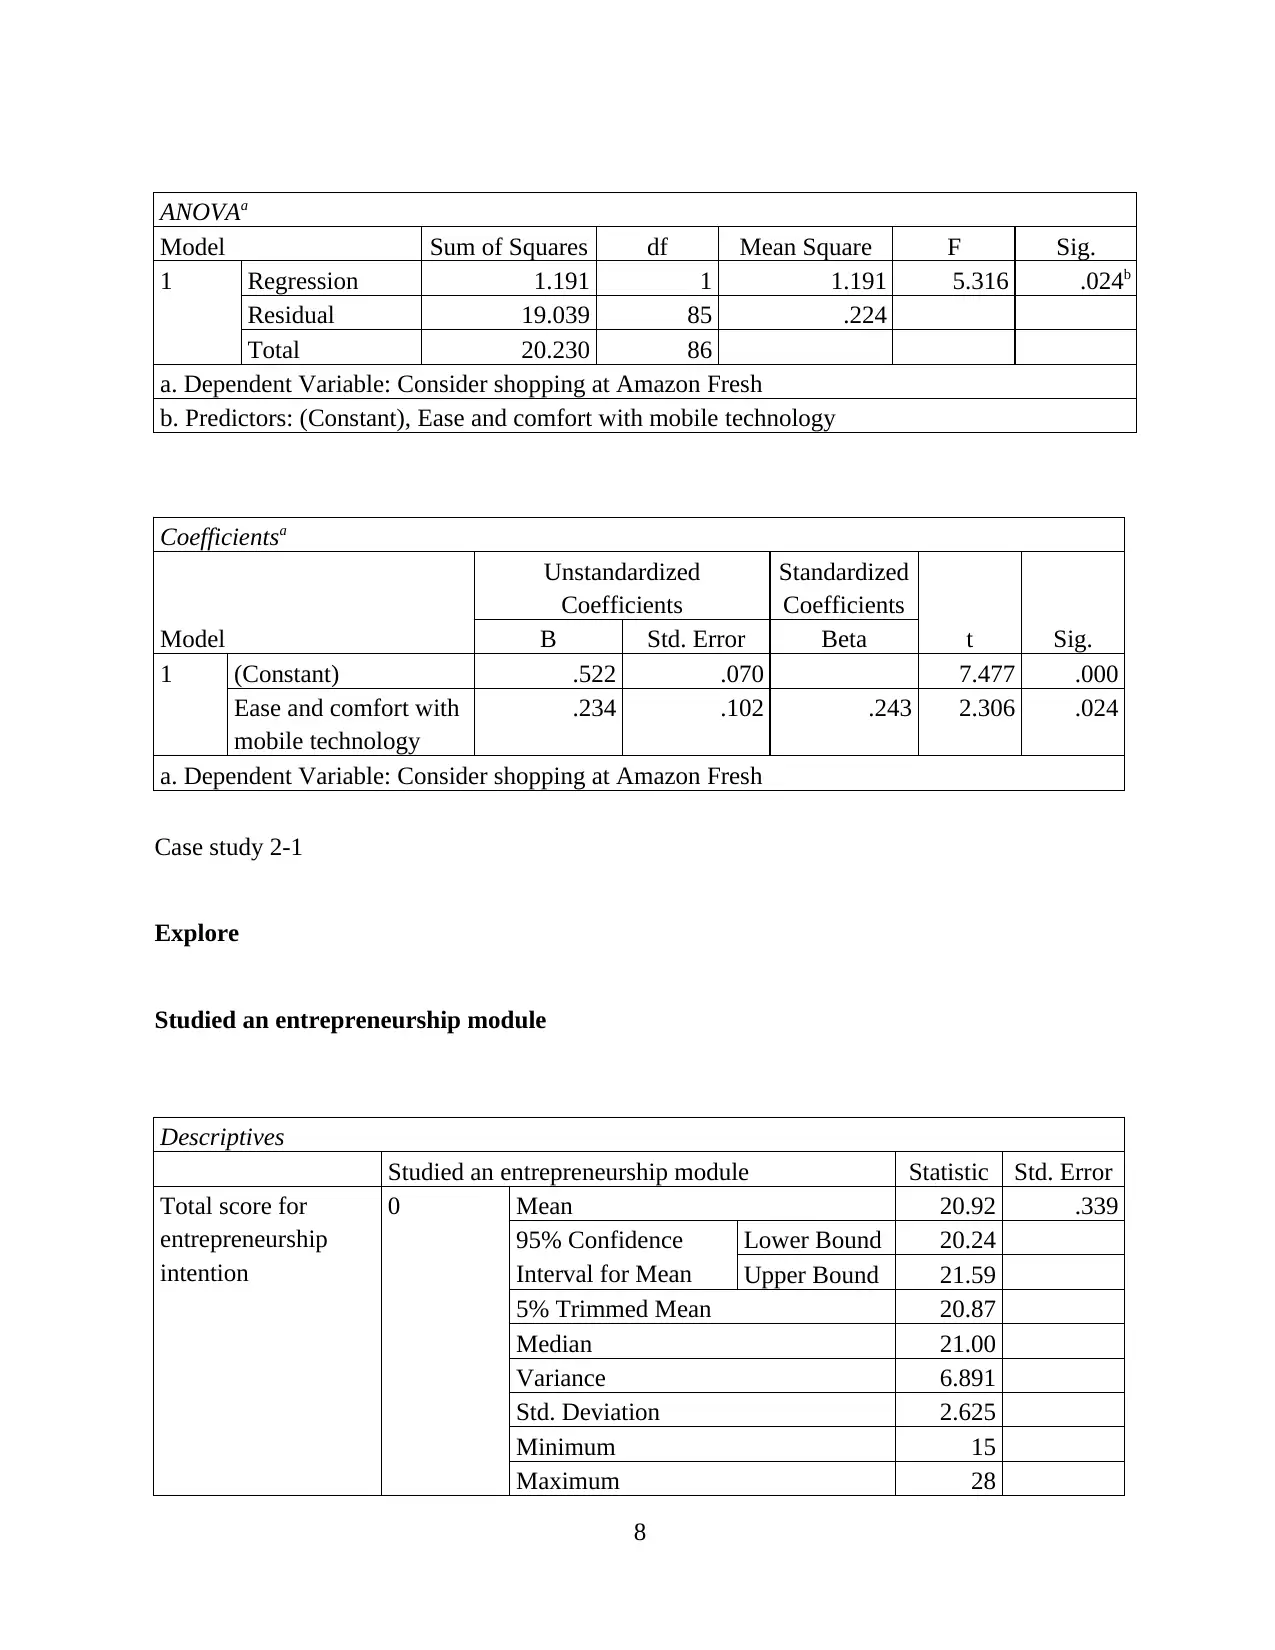
ANOVAa
Model Sum of Squares df Mean Square F Sig.
1 Regression 1.191 1 1.191 5.316 .024b
Residual 19.039 85 .224
Total 20.230 86
a. Dependent Variable: Consider shopping at Amazon Fresh
b. Predictors: (Constant), Ease and comfort with mobile technology
Coefficientsa
Model
Unstandardized
Coefficients
Standardized
Coefficients
t Sig.B Std. Error Beta
1 (Constant) .522 .070 7.477 .000
Ease and comfort with
mobile technology
.234 .102 .243 2.306 .024
a. Dependent Variable: Consider shopping at Amazon Fresh
Case study 2-1
Explore
Studied an entrepreneurship module
Descriptives
Studied an entrepreneurship module Statistic Std. Error
Total score for
entrepreneurship
intention
0 Mean 20.92 .339
95% Confidence
Interval for Mean
Lower Bound 20.24
Upper Bound 21.59
5% Trimmed Mean 20.87
Median 21.00
Variance 6.891
Std. Deviation 2.625
Minimum 15
Maximum 28
8
Paraphrase This Document
Need a fresh take? Get an instant paraphrase of this document with our AI Paraphraser
Range 13
Interquartile Range 4
Skewness .146 .309
Kurtosis -.031 .608
1 Mean 22.23 .354
95% Confidence
Interval for Mean
Lower Bound 21.53
Upper Bound 22.93
5% Trimmed Mean 22.29
Median 22.00
Variance 9.248
Std. Deviation 3.041
Minimum 14
Maximum 28
Range 14
Interquartile Range 5
Skewness -.150 .279
Kurtosis -.179 .552
Tests of Normality
Studied an
entrepreneurship
module
Kolmogorov-Smirnova Shapiro-Wilk
Statistic df Sig. Statistic df Sig.
Total score for
entrepreneurship
intention
0 .120 60 .032 .969 60 .135
1 .120 74 .011 .973 74 .110
a. Lilliefors Significance Correction
Total score for entrepreneurship intention
Histograms
9
10
⊘ This is a preview!⊘
Do you want full access?
Subscribe today to unlock all pages.
Trusted by 1+ million students worldwide
1 out of 18
Related Documents


Your All-in-One AI-Powered Toolkit for Academic Success.
+13062052269
info@desklib.com
Available 24*7 on WhatsApp / Email
![[object Object]](/_next/static/media/star-bottom.7253800d.svg)
Unlock your academic potential
Copyright © 2020–2026 A2Z Services. All Rights Reserved. Developed and managed by ZUCOL.