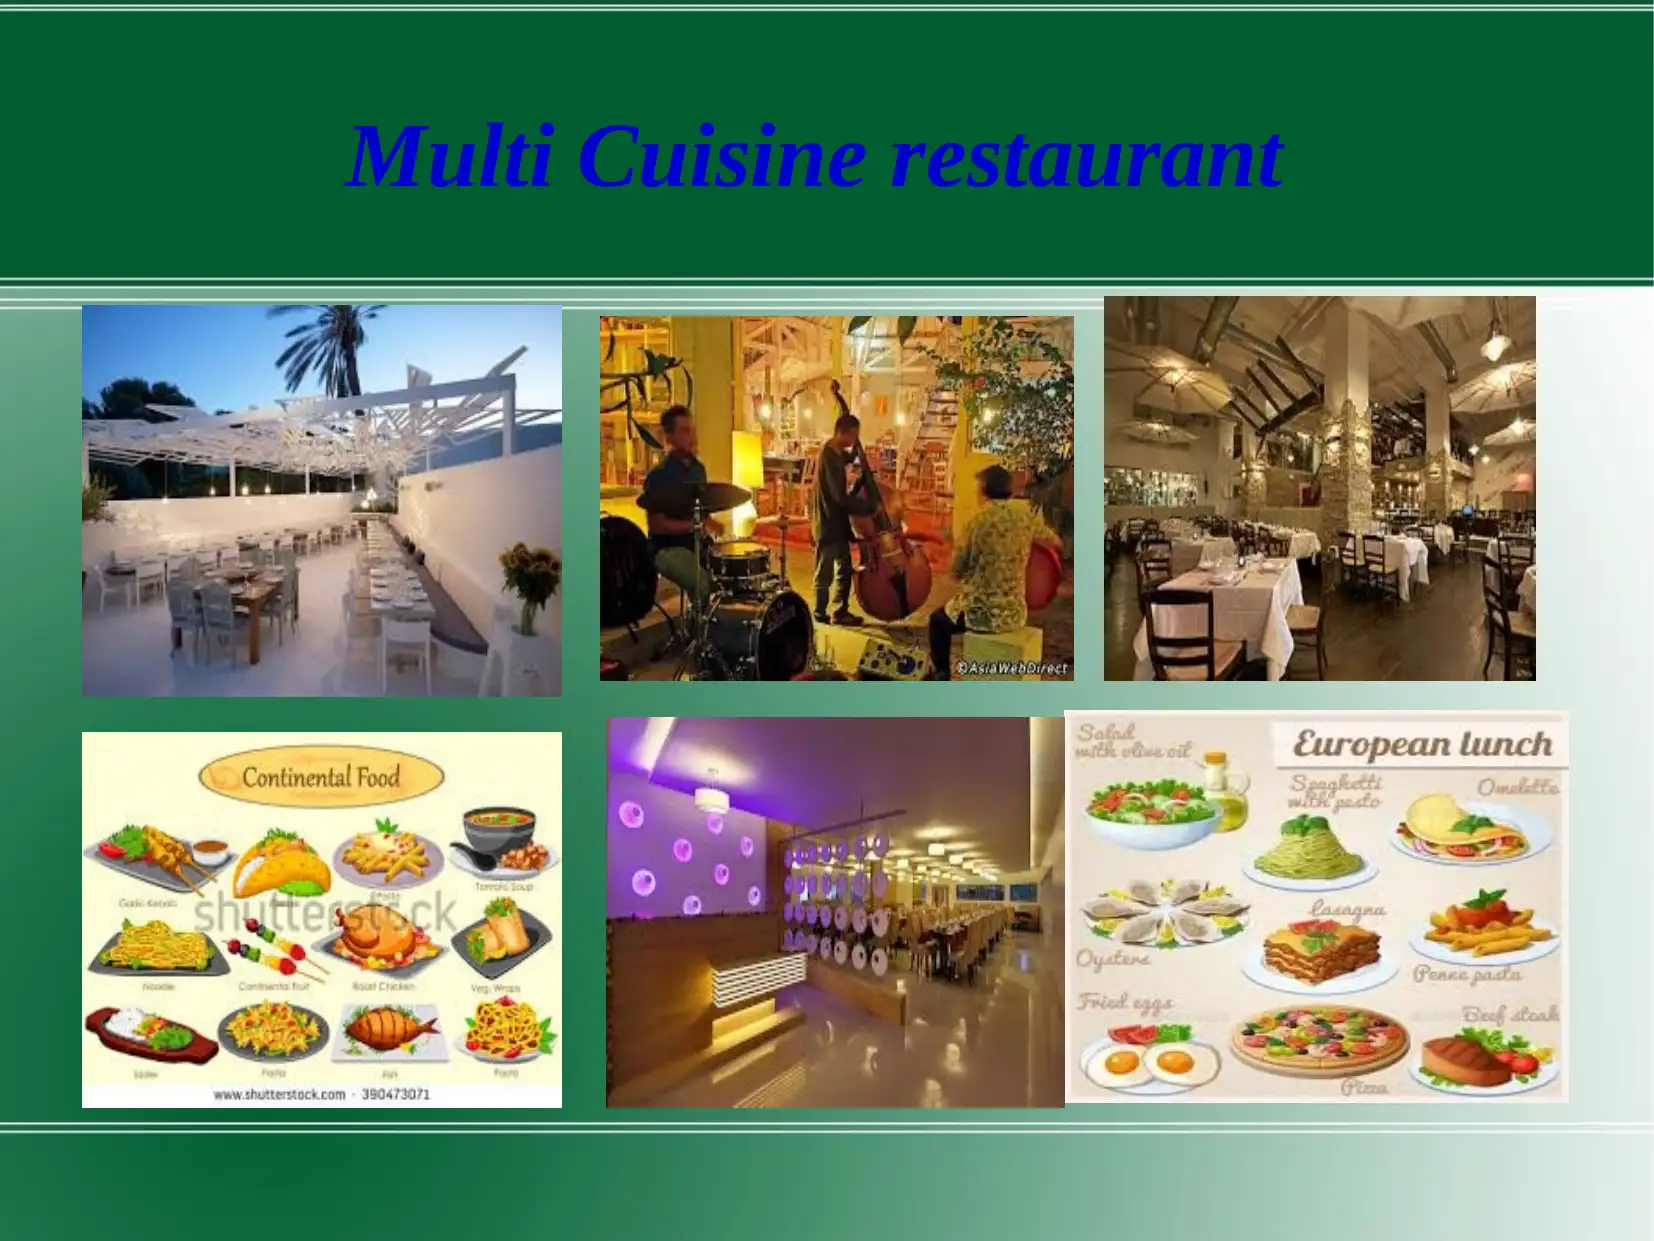
Business Decisions: Multi Cuisine Restaurant Sales and Profit Analysis

Verified

Added on  2023/04/21

|14
|623
|188
Report
AI Summary
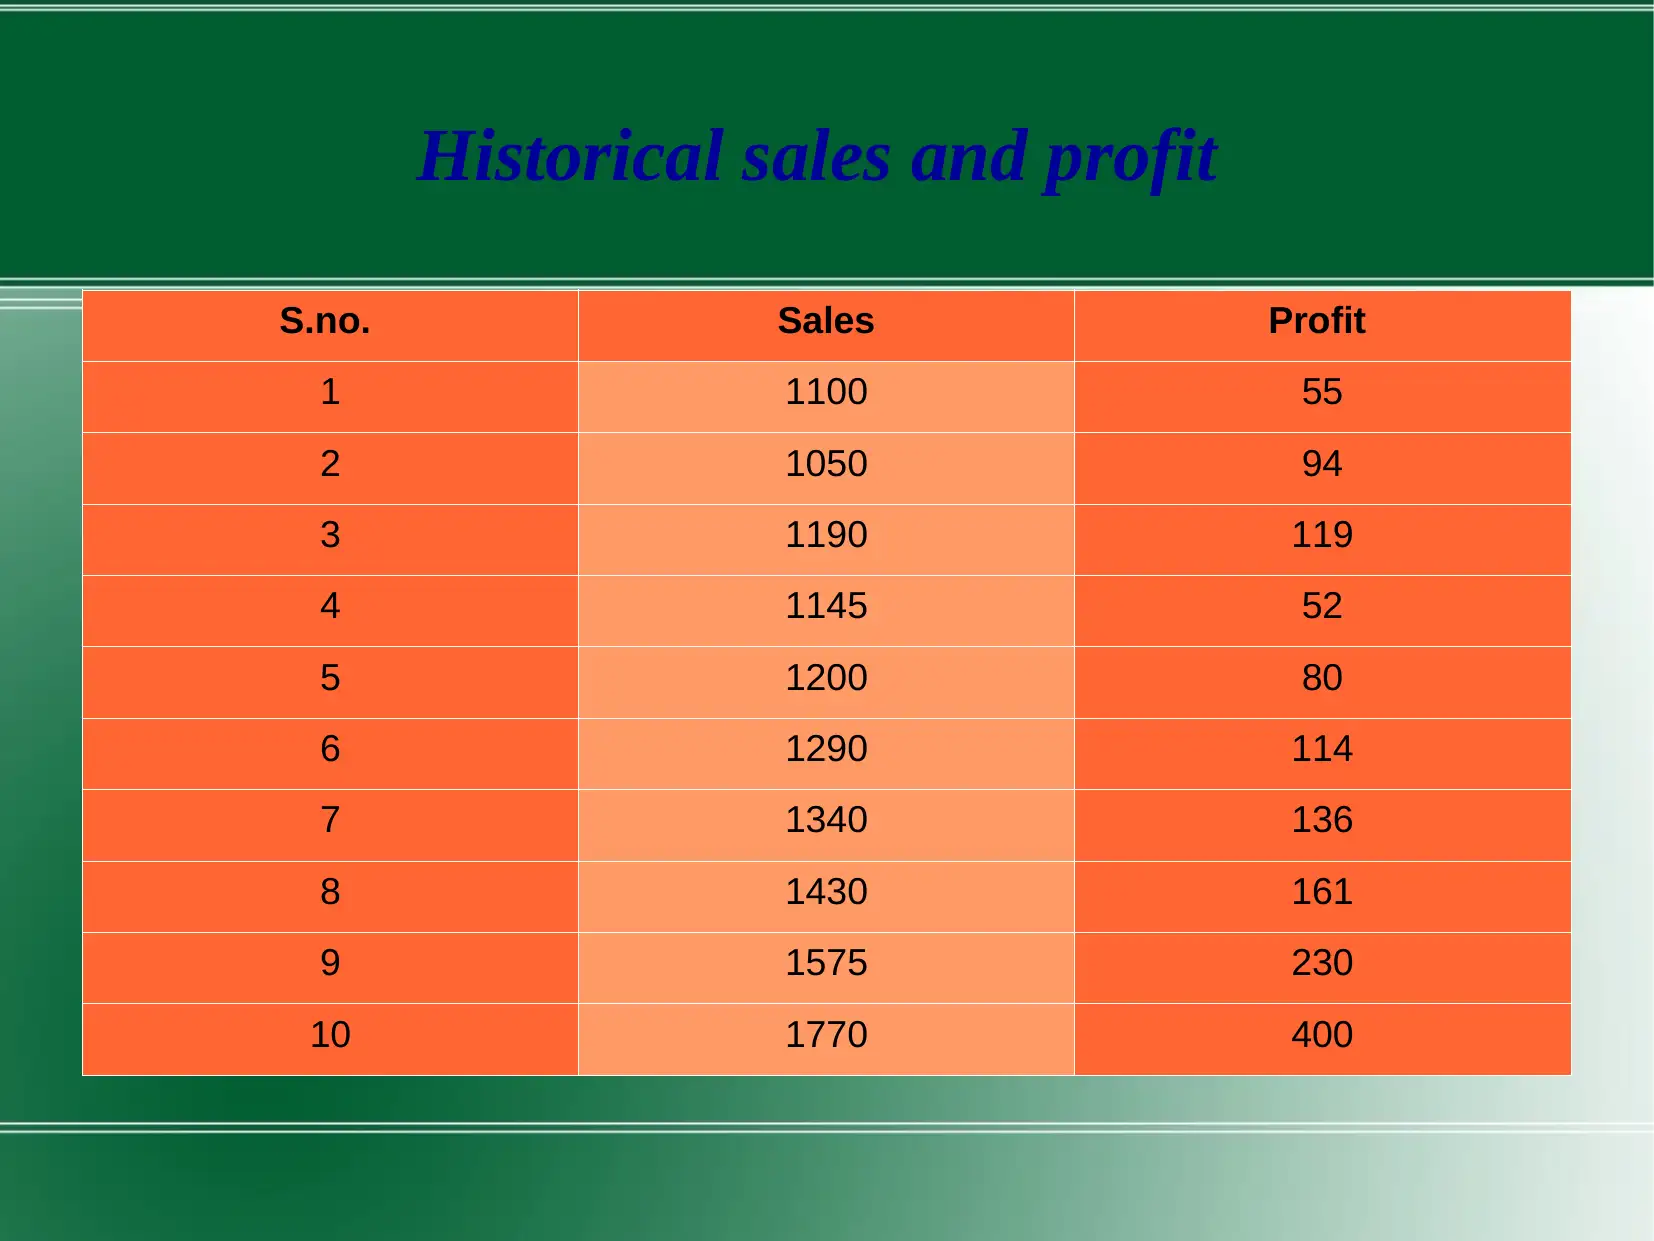
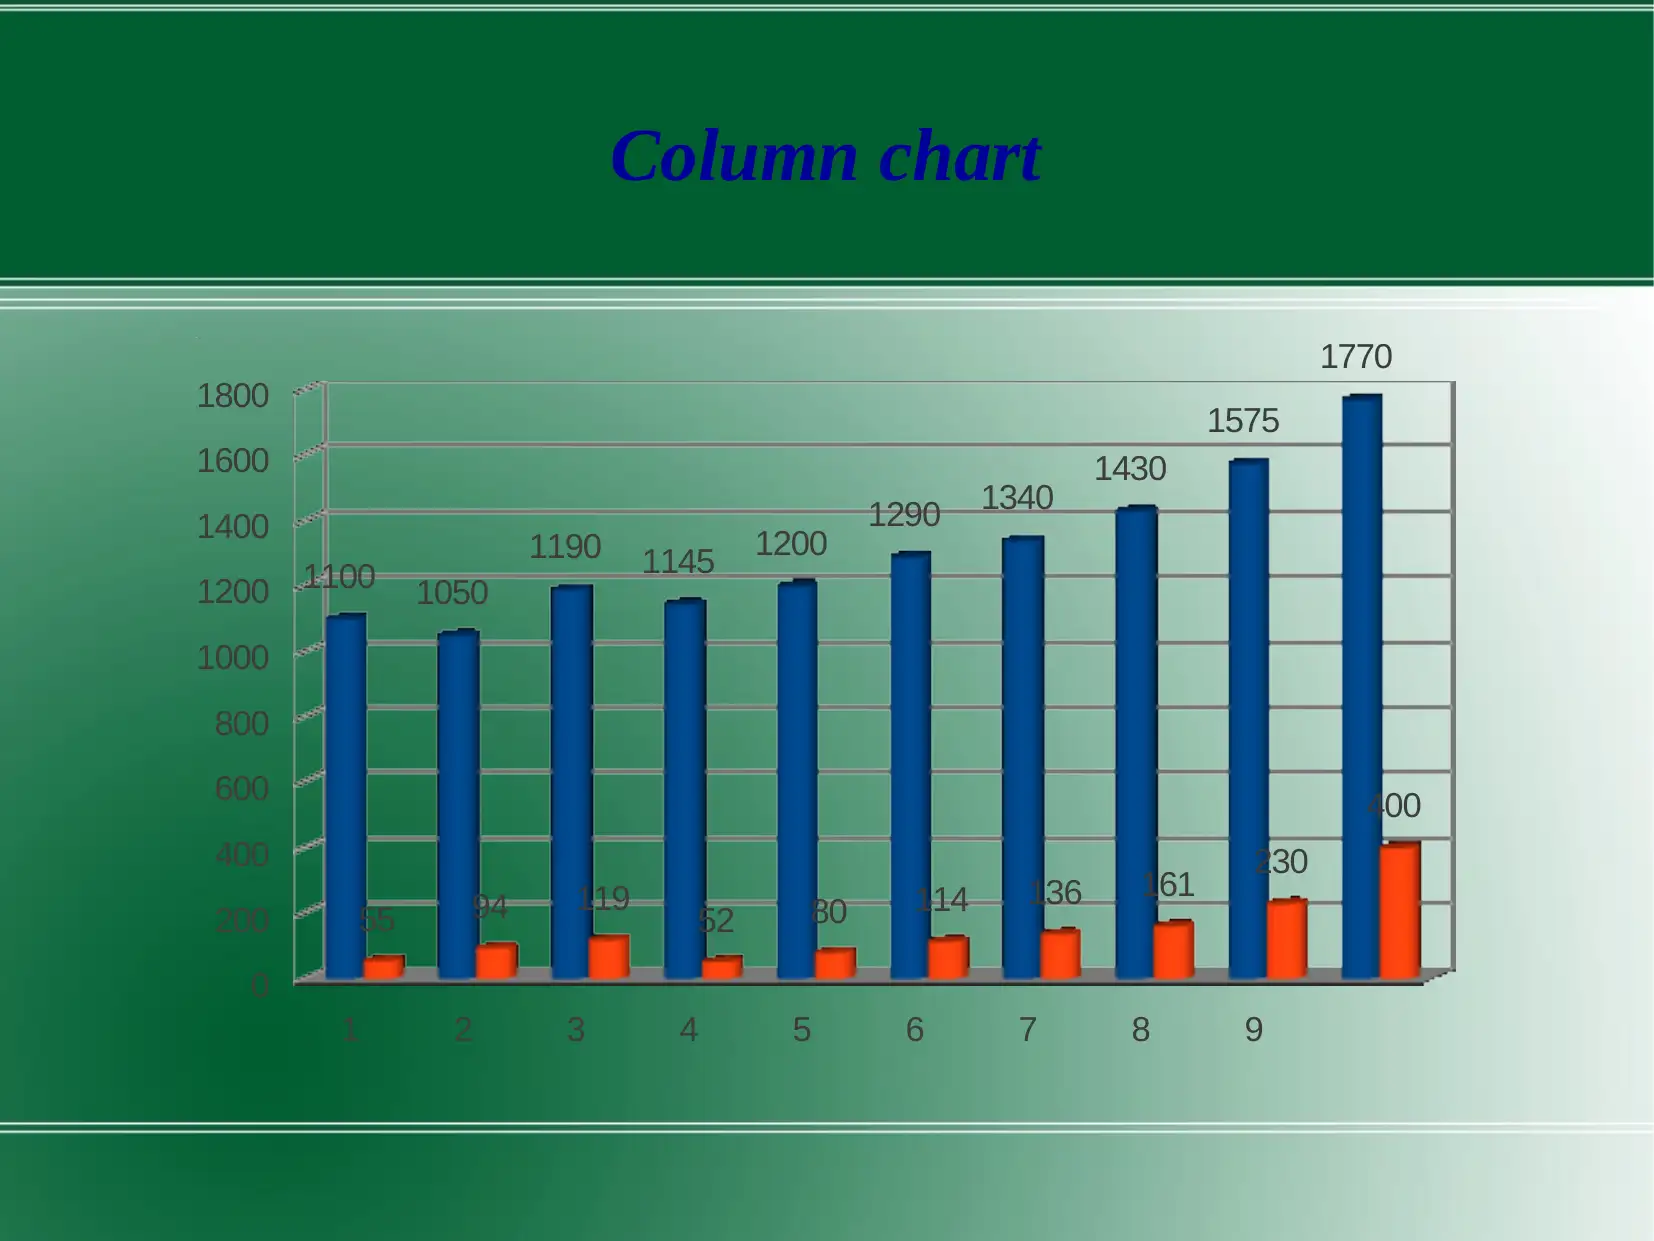
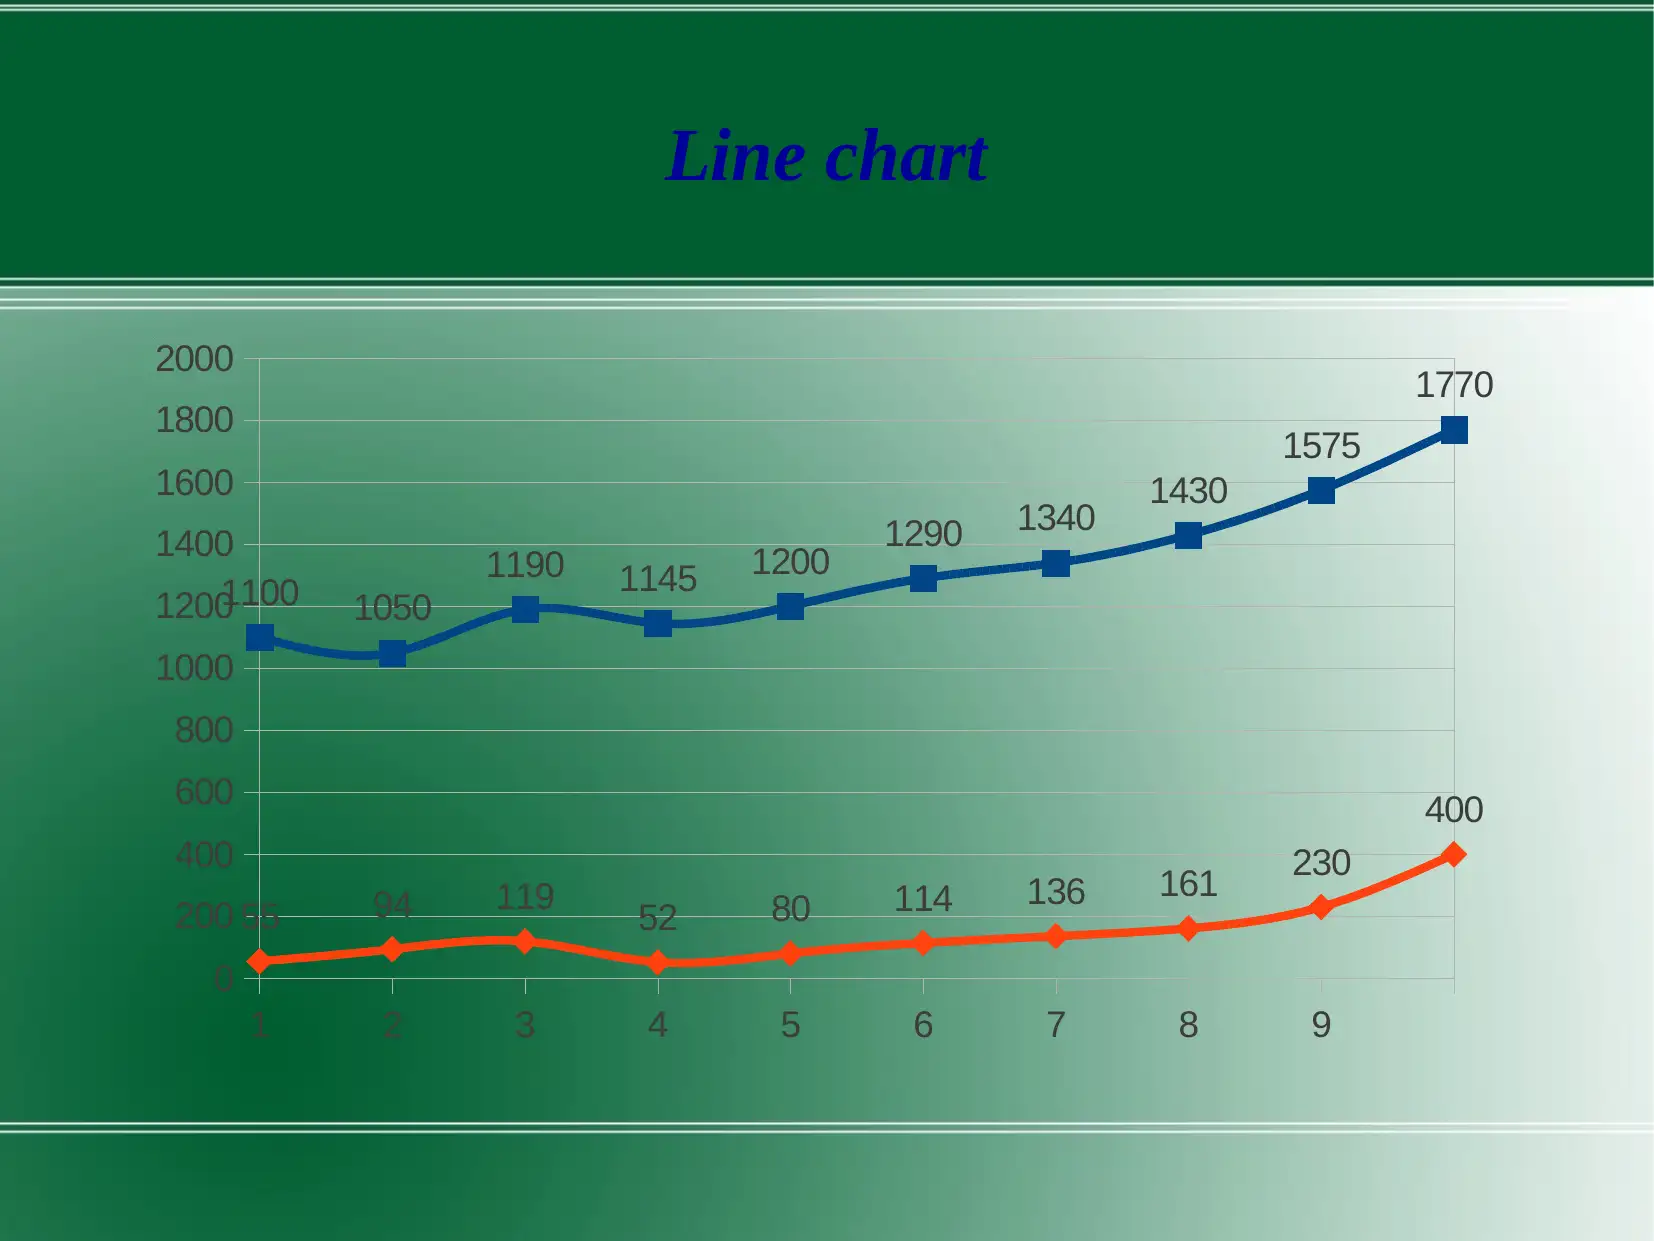
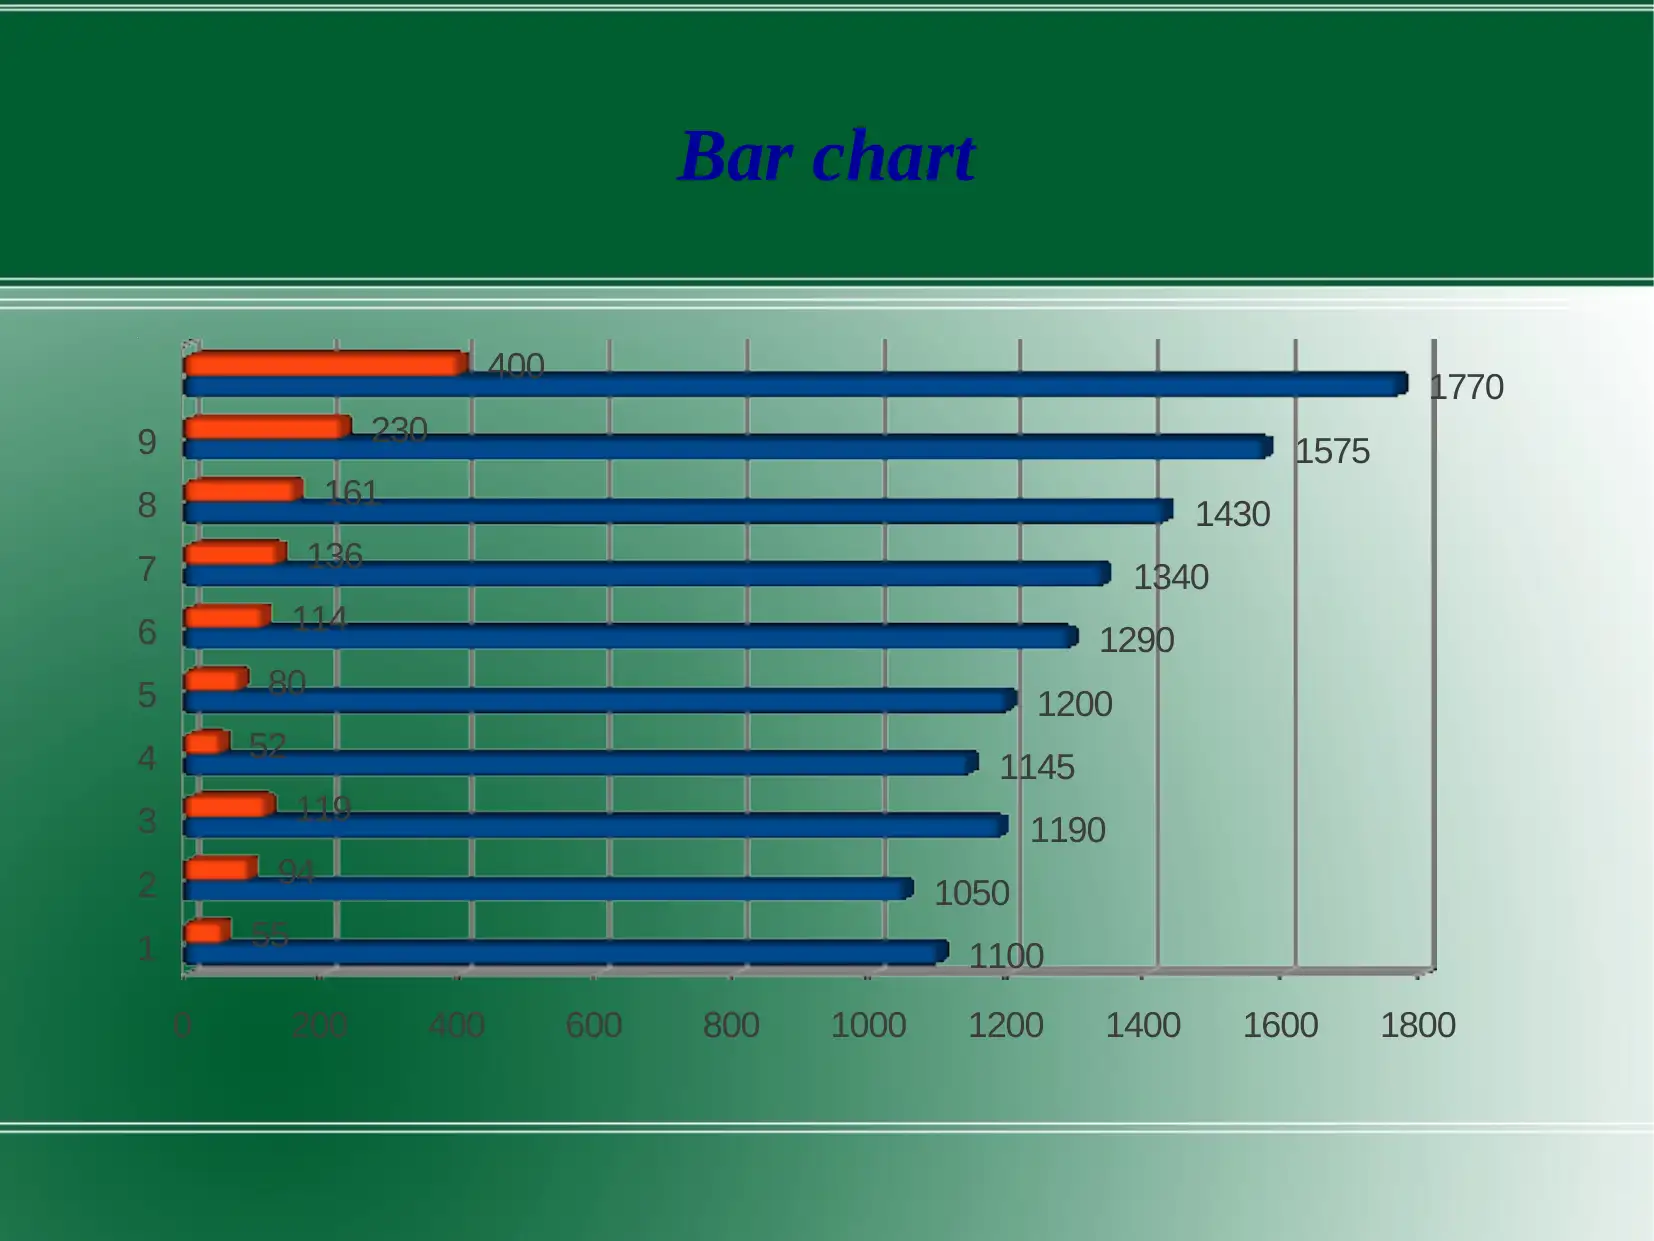
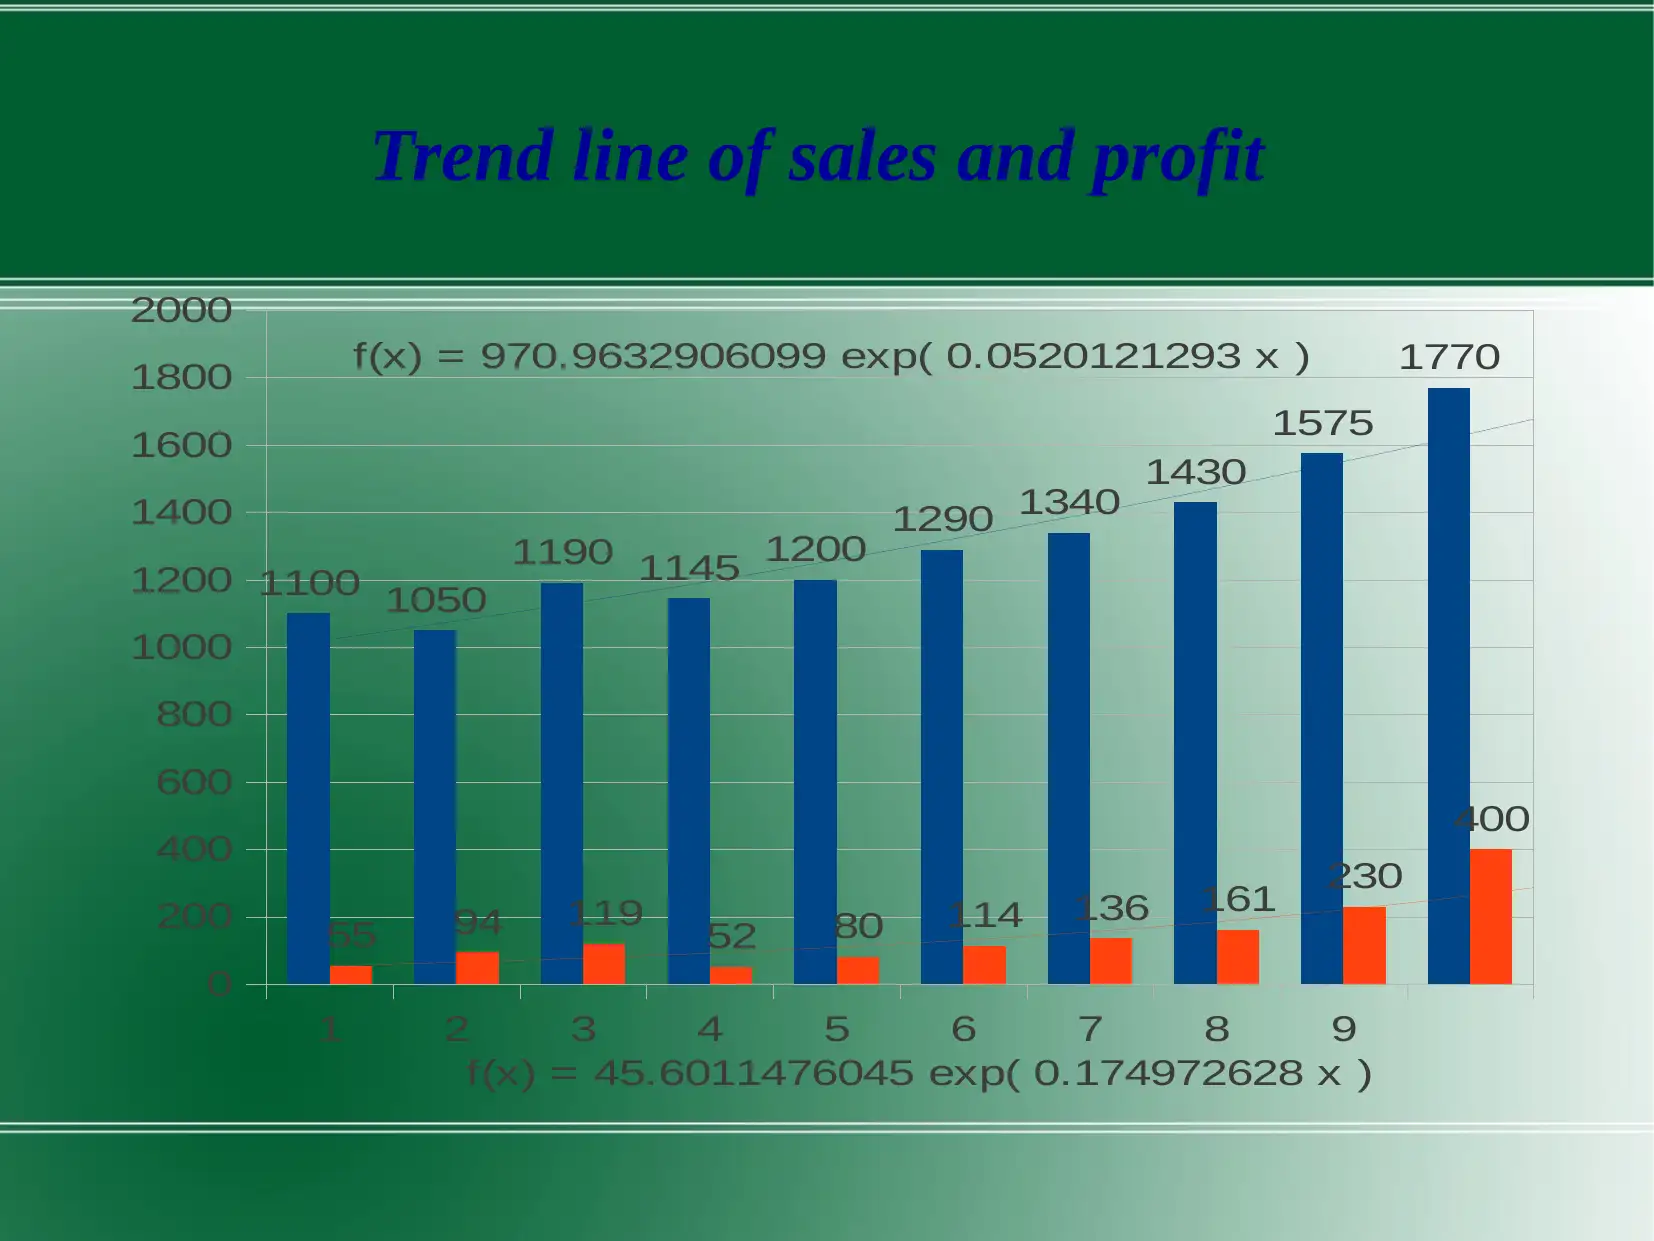
This report provides an analysis of a multi-cuisine restaurant's historical sales and profit data, utilizing column, line, and bar charts to visualize trends. The analysis reveals fluctuations in revenue and profitability, with an initial decline followed by an upward trend. The report highlights the correlation between sales and profit, noting that profit performance has improved in recent years. Key drivers behind high revenue and profitability include increased demand, a growing consumer base, business expansion, online operations, effective services, and competitive pricing. Trend lines are used to predict future sales and profit, indicating an expected increase in the coming years. Factors such as changing societal attitudes, increased income, consumer awareness, attractive offers, and improved services are cited as potential contributors to this positive trend. The report concludes with references to relevant academic sources.
tabler-icon-diamond-filled.svg

Contribute Materials

Your contribution can guide someone’s learning journey. Share your documents today.
Document Page
Business decisions making
tabler-icon-diamond-filled.svg

Secure Best Marks with AI Grader

Need help grading? Try our AI Grader for instant feedback on your assignments.
Document Page
Multi Cuisine restaurant
Document Page
Historical sales and profit
S.no. Sales Profit
1 1100 55
2 1050 94
3 1190 119
4 1145 52
5 1200 80
6 1290 114
7 1340 136
8 1430 161
9 1575 230
10 1770 400
Document Page
Column chart
1 2 3 4 5 6 7 8 9
0
200
400
600
800
1000
1200
1400
1600
1800
1100 1050
1190 1145 1200 1290 1340 1430
1575
1770
55 94 119 52 80 114 136 161 230
400
tabler-icon-diamond-filled.svg

Secure Best Marks with AI Grader

Need help grading? Try our AI Grader for instant feedback on your assignments.
Document Page
1 2 3 4 5 6 7 8 9
0
200
400
600
800
1000
1200
1400
1600
1800
2000
1100 1050
1190 1145 1200 1290 1340 1430
1575
1770
55 94 119 52 80 114 136 161 230
400
Line chart
Document Page
Bar chart
1
2
3
4
5
6
7
8
9
0 200 400 600 800 1000 1200 1400 1600 1800
1100
1050
1190
1145
1200
1290
1340
1430
1575
1770
55
94
119
52
80
114
136
161
230
400
Document Page
Interpretation:

From the above presented graphs, it can be seen that
nitially, restaurant's revenu has been declined to
1050 thereafter increased to 1190 than again
decreased to 1145.
Thereafter, the figures shows an rising trend but still
the rate of increase in fluctuating. For instance, it has
been increased to 1290 by 7.5% thereafter it has
been rose up to 1340 by 3.87%. nsumers,
tabler-icon-diamond-filled.svg

Paraphrase This Document

Need a fresh take? Get an instant paraphrase of this document with our AI Paraphraser
Document Page
Contd.
Whilst, after that, it is continuously rising at increased
rate by 6.72%, 10.14% and 11.02% respectively
which is good.
On the other side, profitability performance also has
been increased or decreased with the fluctuation in
sales. Due to this, in last three years, restaurant's
profit performance has been improved at increasing
rate by 18.38%, 42.86% and 73.91% respectively.
Document Page
Reasons behind high revenue and profitability
Growth in demand
Increasing number of consumers
Business expansion
Online operations
More effective services
Cheaper prices.
Document Page
Trend line
Trend line indicates potential movement of data on the
basis of their previous occurrences. Trend line may
shows three trend, that are given below:
Upward
Downward
Constant.
With regards to restaurant, trend line can be drafted to
predict future trend of sales and profit as well.
tabler-icon-diamond-filled.svg

Secure Best Marks with AI Grader

Need help grading? Try our AI Grader for instant feedback on your assignments.
Document Page
1 2 3 4 5 6 7 8 9
0
200
400
600
800
1000
1200
1400
1600
1800
2000
1100 1050
1190 1145 1200 1290 1340 1430
1575
1770
55 94 119 52 80 114 136 161 230
400
f(x) = 970.9632906099 exp( 0.0520121293 x )
f(x) = 45.6011476045 exp( 0.174972628 x )
Trend line of sales and profit
Document Page
Interpretation
Presented graph reflects upward slope of trend line which
indicates that restaurant's sales and profit will be increase in
upcoming years.
Changing society attitude and perception towards taking meal
out, increasing income, consumer awareness through
marketing, attractive discounting offers.
Moreover, improved life standard and additional services like
event planning etc. may be the reason behind such potential
occurrence.
Document Page
References
Fleischhacker, S. E. and et.al., 2013. Validity of secondary
retail food outlet data: a systematic review. American
journal of preventive medicine. 45(4). pp.462-473.
Patra, S. K., 2014. Data Visualization for Hybrid Application:
The Challenges in Choosing an Optimal Library for Line
chart. International Journal of Emerging Science and
Engineering.
tabler-icon-diamond-filled.svg

Paraphrase This Document

Need a fresh take? Get an instant paraphrase of this document with our AI Paraphraser
Document Page
Thank You!
chevron_up_icon
1 out of 14
circle_padding
hide_on_mobile
zoom_out_icon
logo.png

Your All-in-One AI-Powered Toolkit for Academic Success.

Available 24*7 on WhatsApp / Email

[object Object]