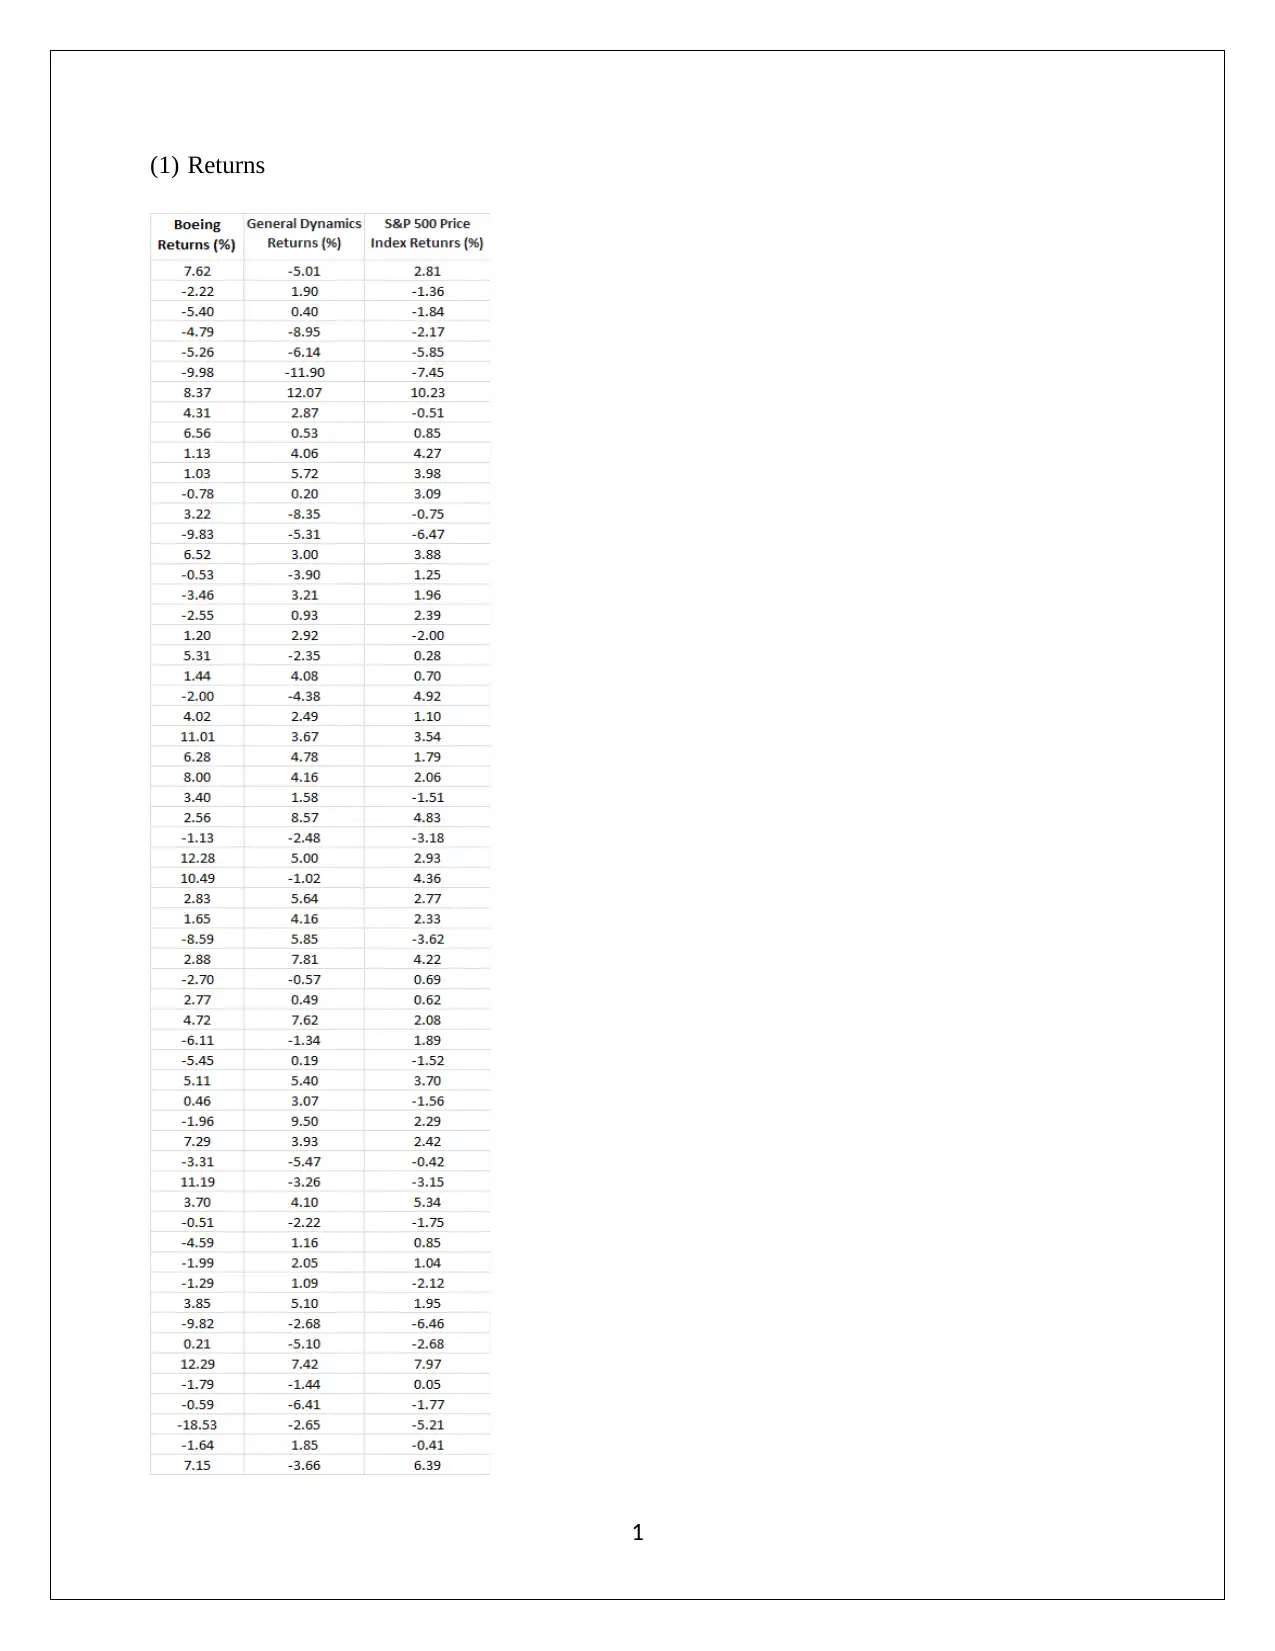
Statistics of Business & Finance: Return, Risk & Hypothesis
VerifiedAdded on 2023/06/03
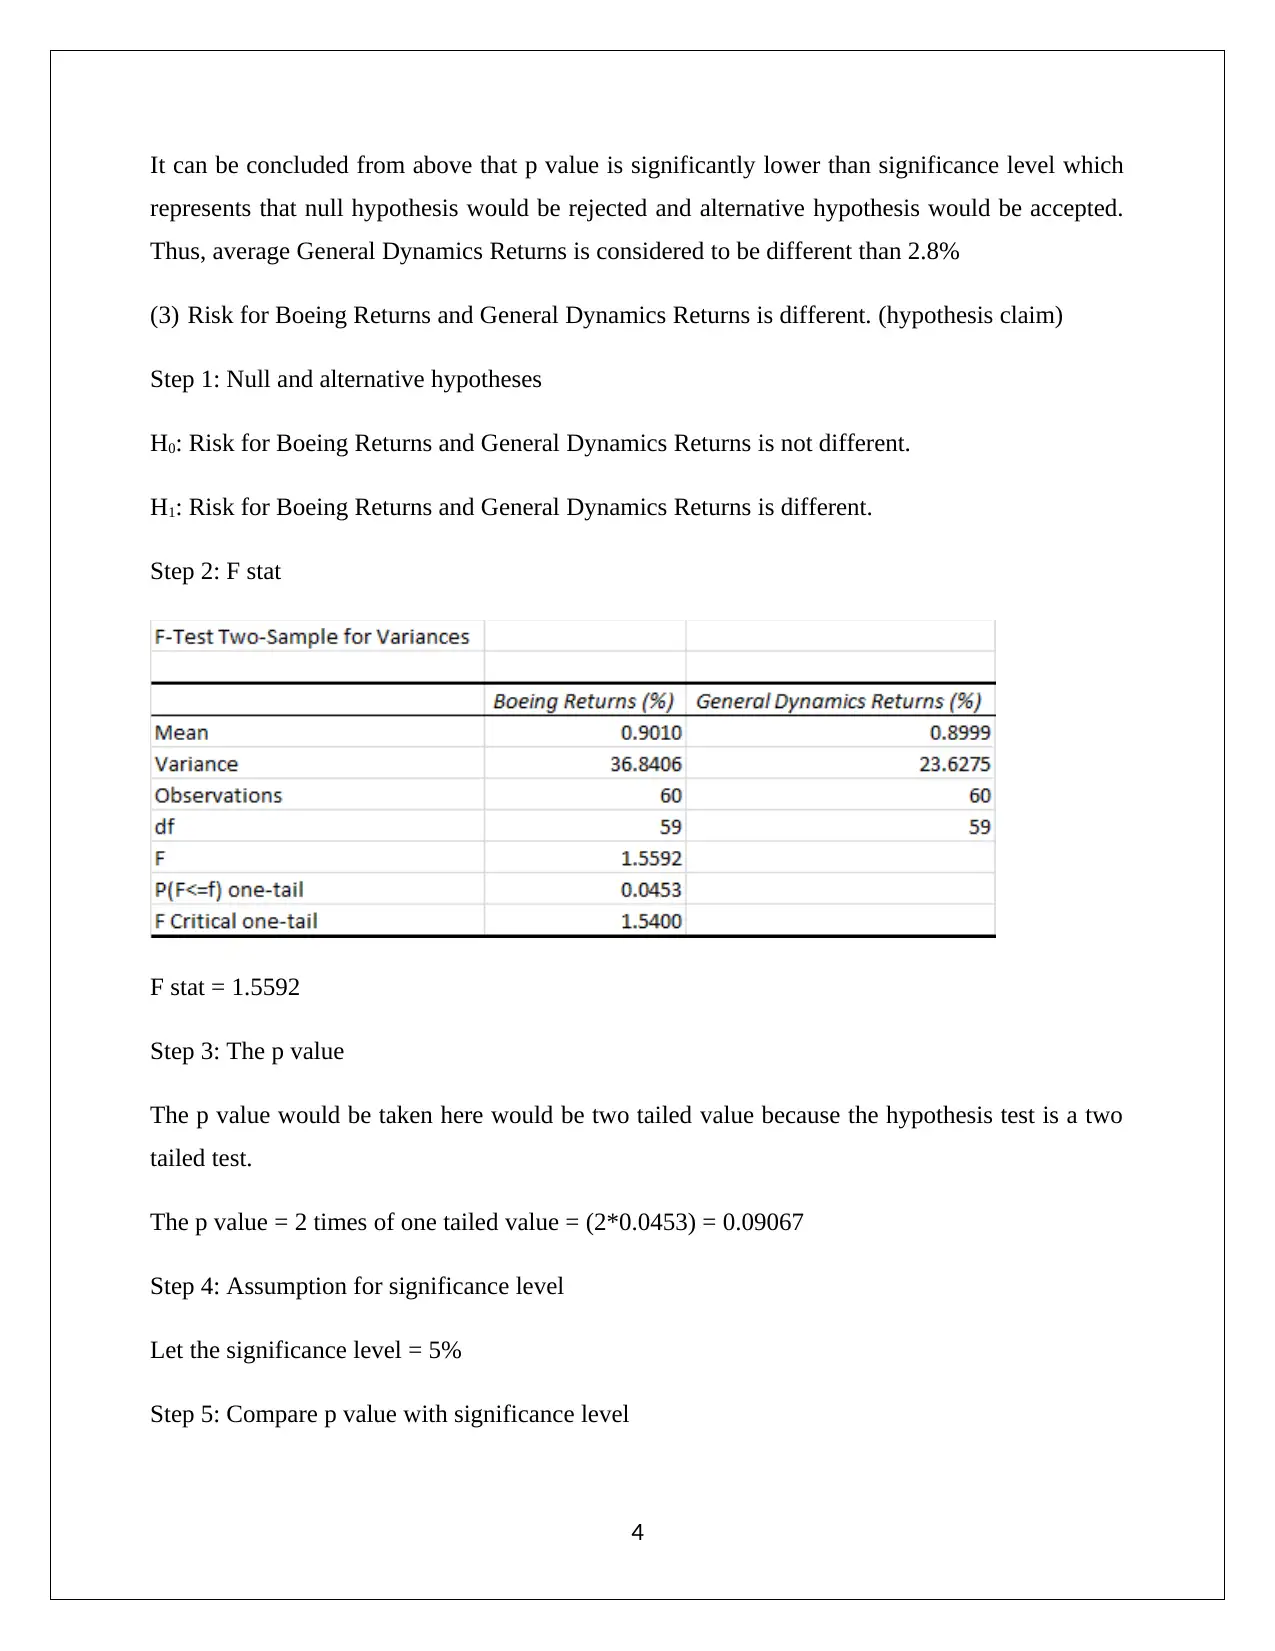
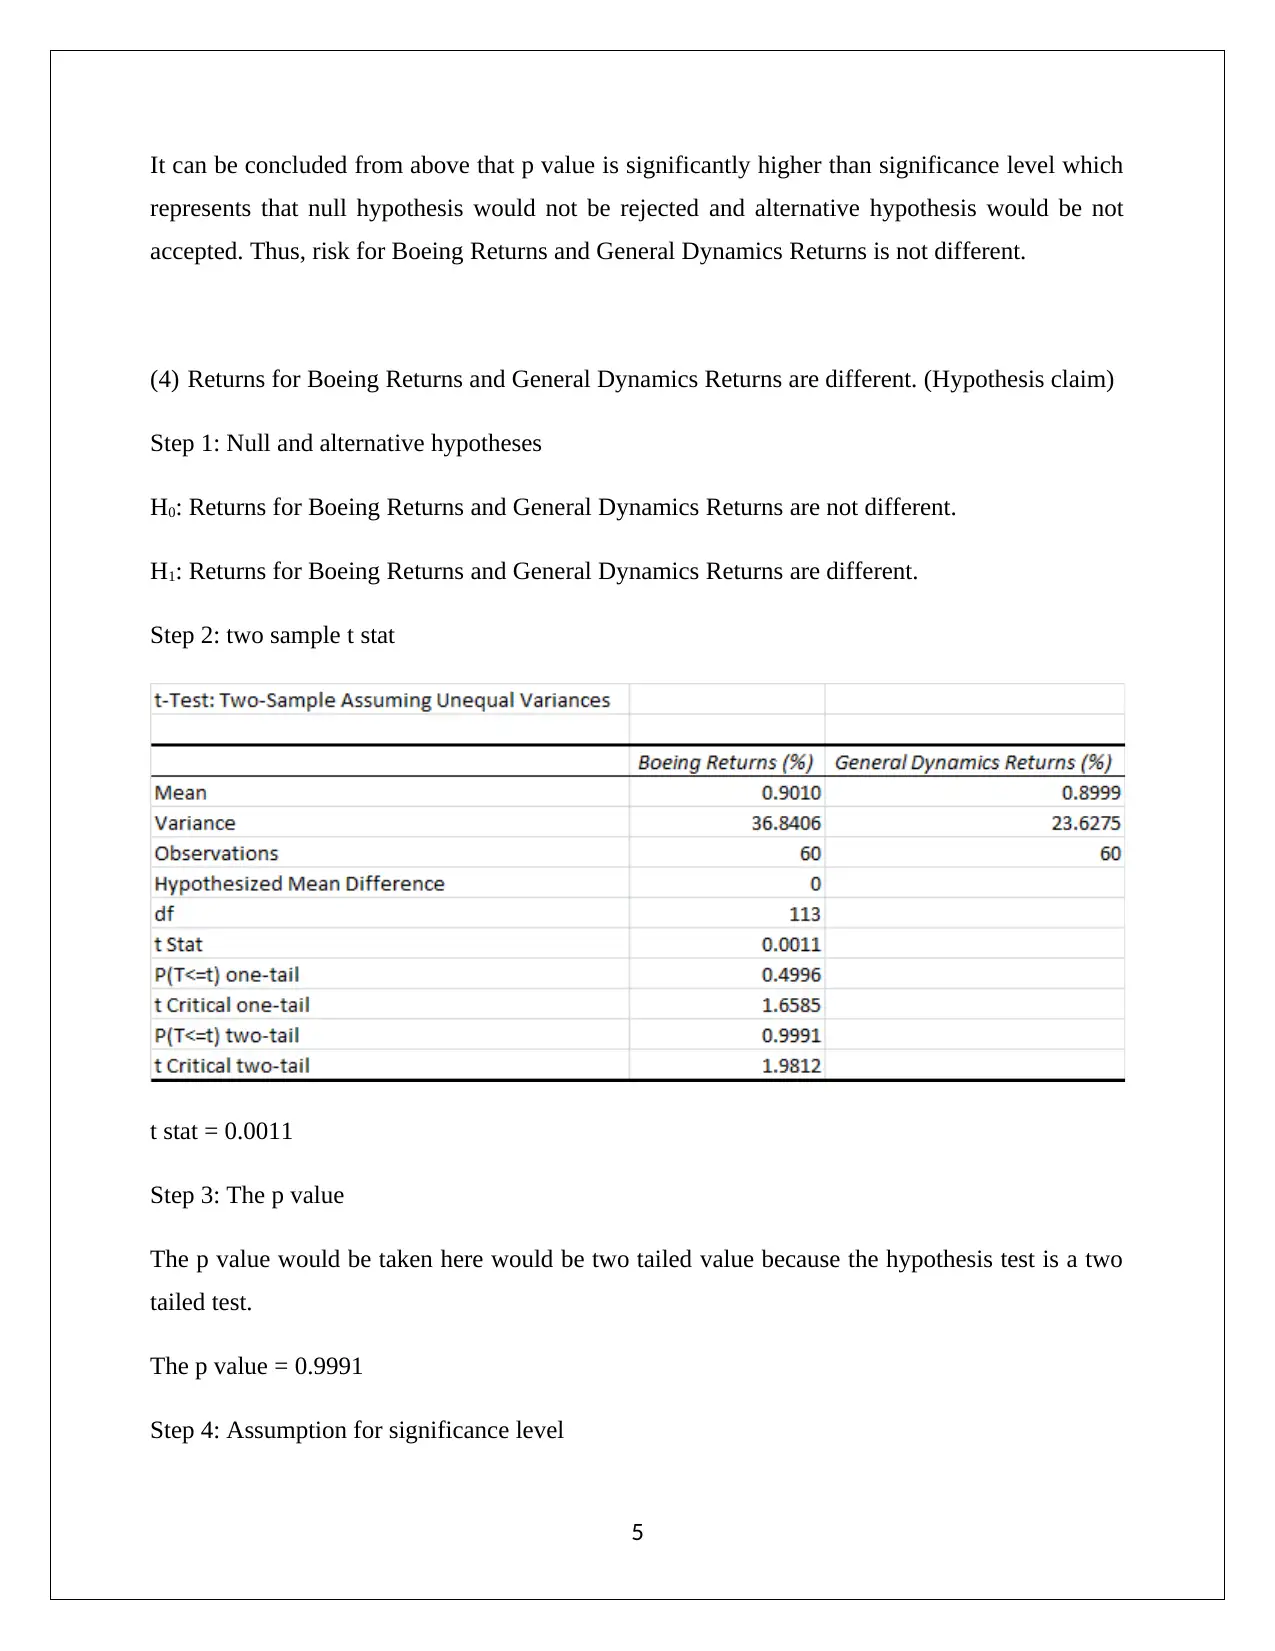
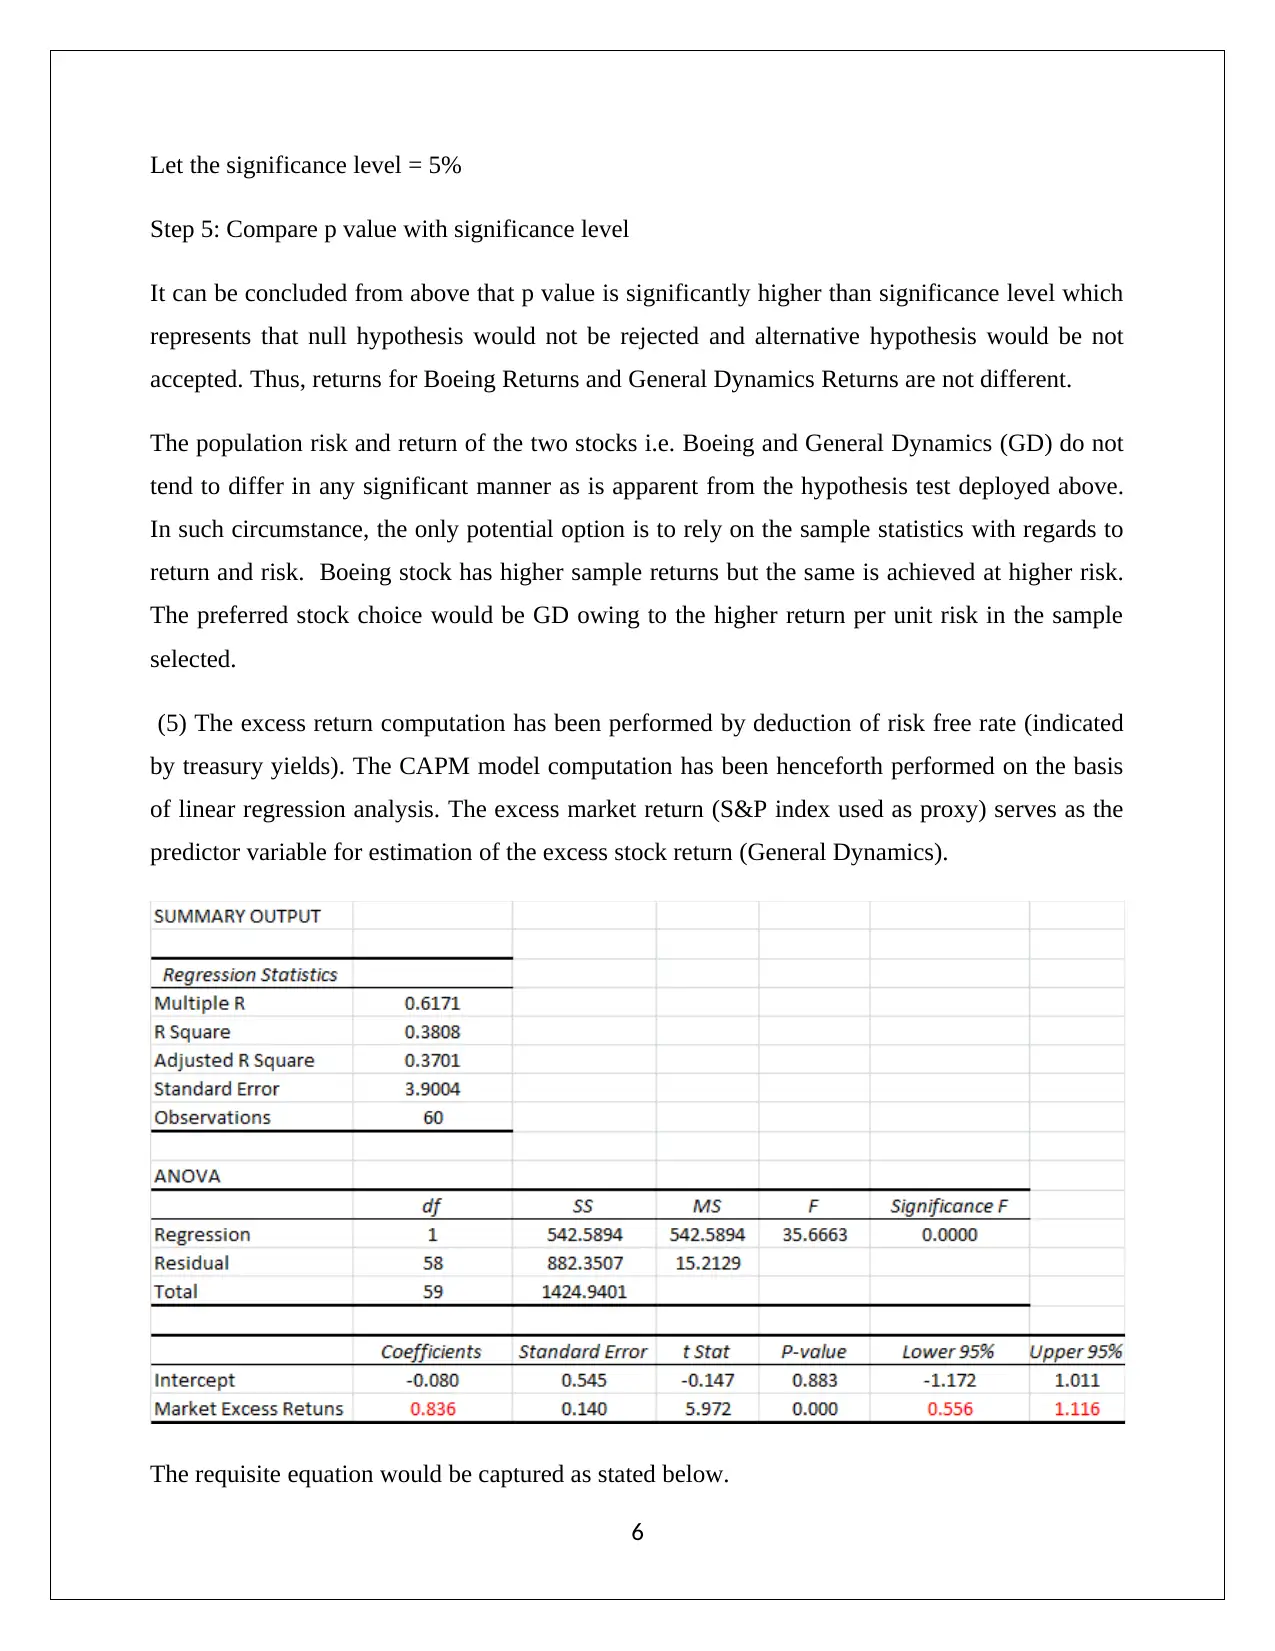
|10
|1629
|169
Homework Assignment
AI Summary
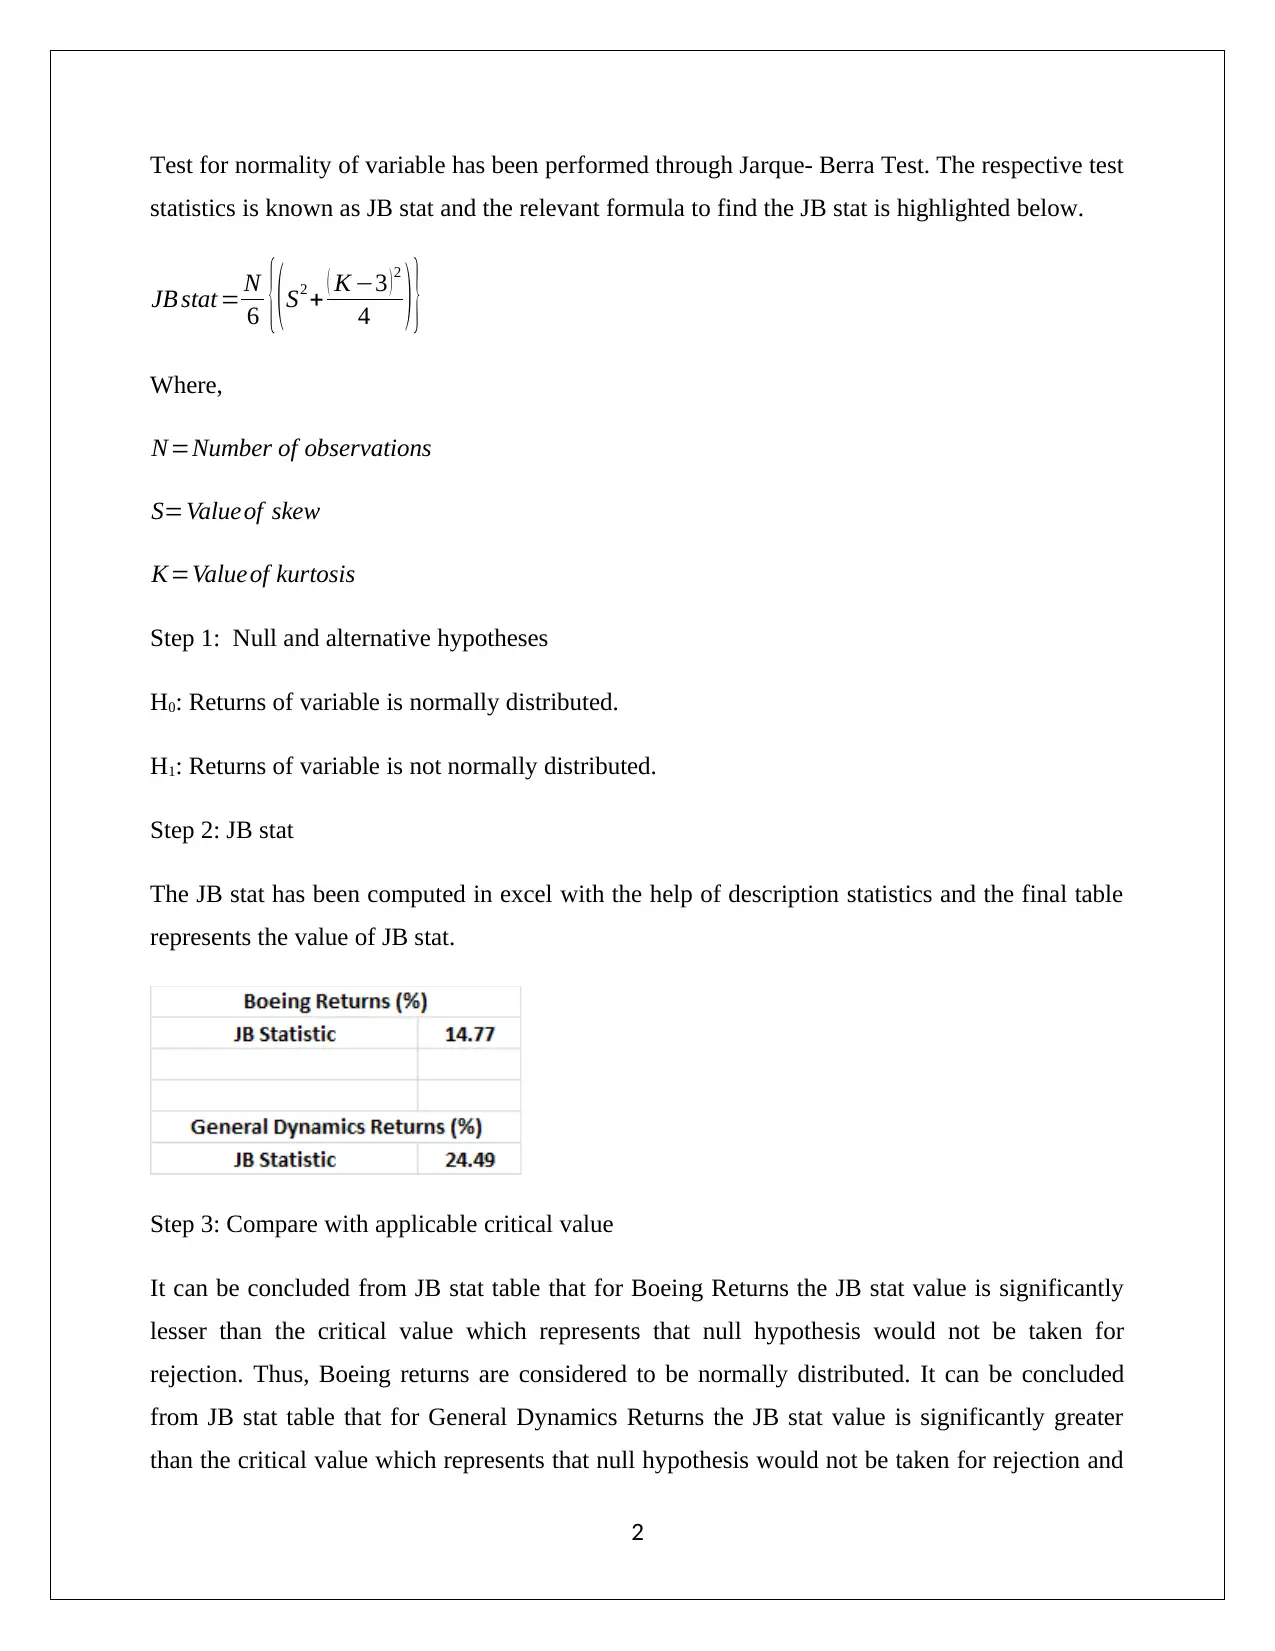
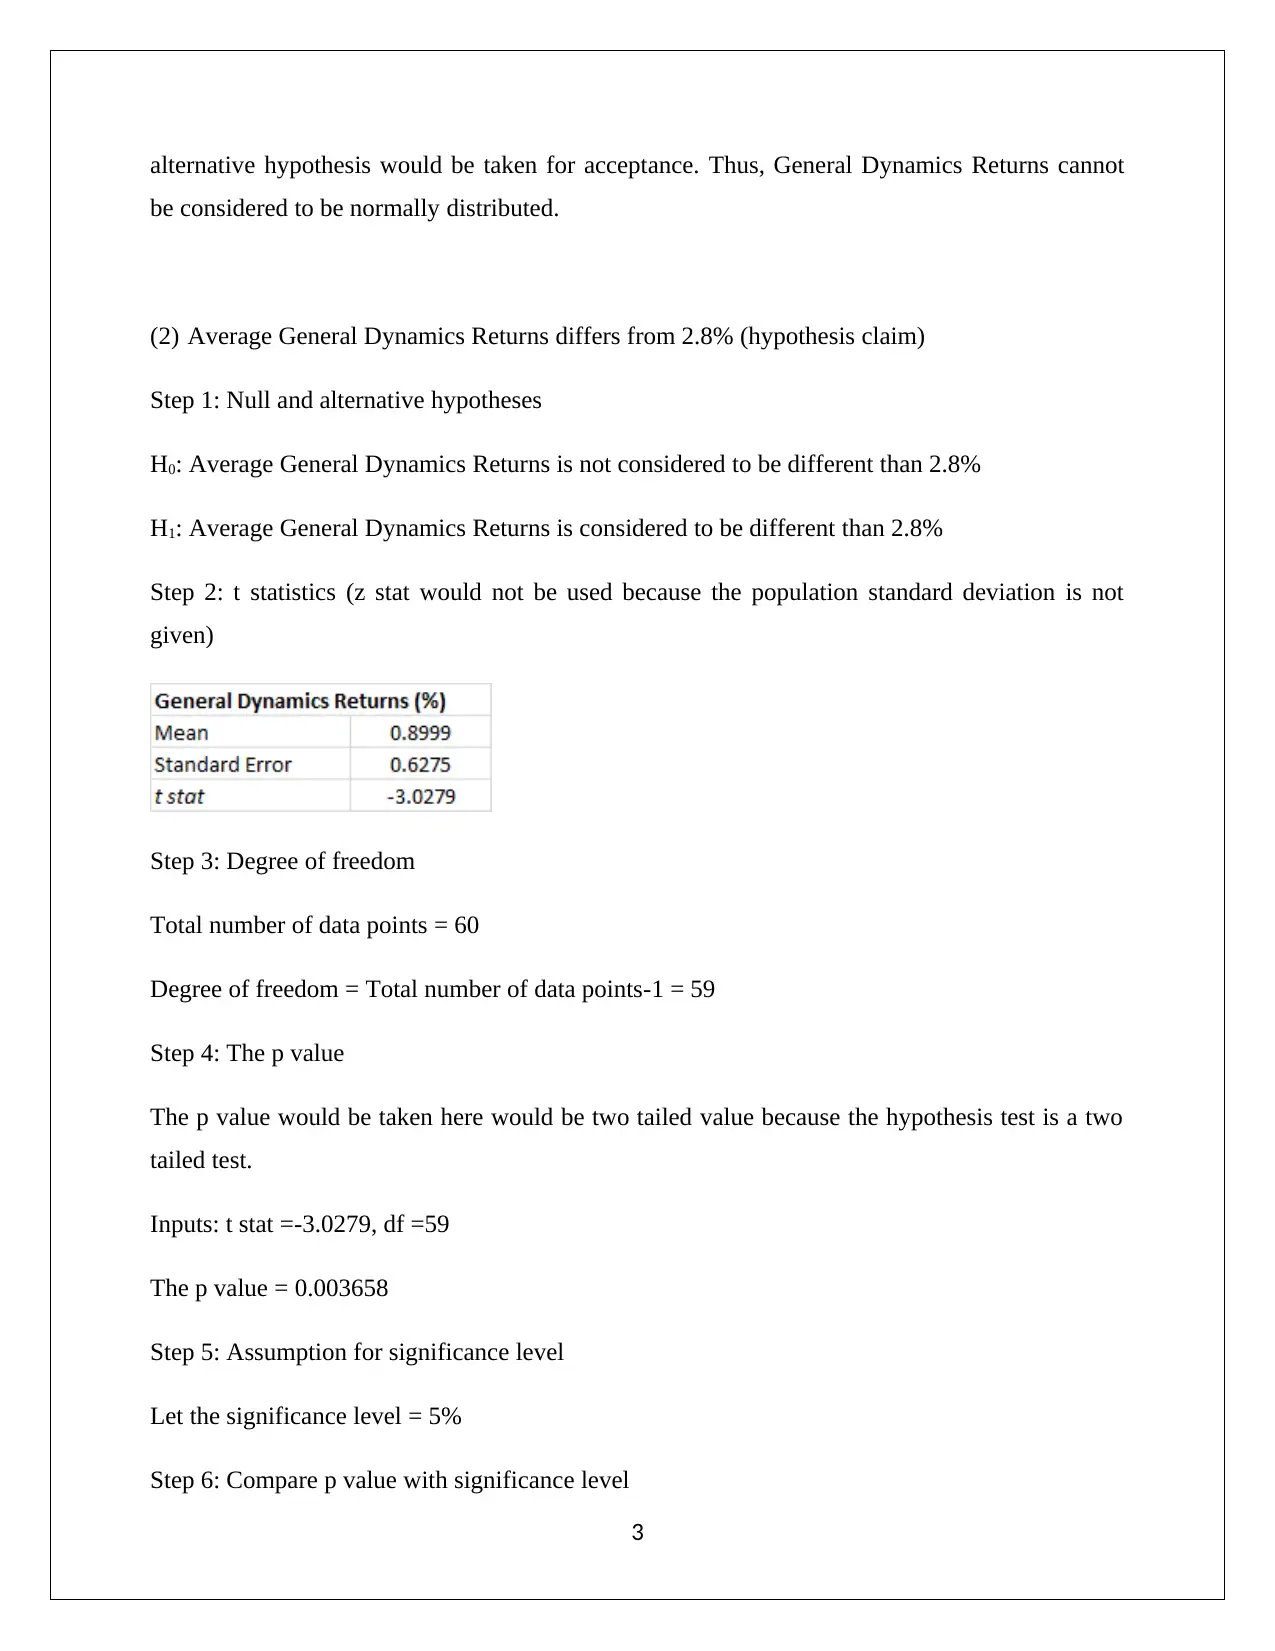
This assignment focuses on the statistical analysis of business and finance, specifically examining the returns of Boeing and General Dynamics (GD) stocks. It includes hypothesis testing to determine if the average General Dynamics returns differ from a claimed 2.8%, and whether the risk and returns between Boeing and General Dynamics are statistically different. The analysis uses t-tests and F-tests to compare means and variances, respectively. Furthermore, the assignment employs the Capital Asset Pricing Model (CAPM) to evaluate the beta of General Dynamics stock, assessing its significance and interpreting the R-squared value. Normality tests are conducted to validate assumptions underlying the statistical models. The conclusion provides insights into stock selection based on risk-adjusted returns and discusses the implications of the CAPM analysis, including the interpretation of the beta coefficient and the limitations indicated by the R-squared value. The assignment also highlights whether the normality of residuals is satisfied for the CAPM model.

1 out of 10
Related Documents
![Statistical Analysis of Business and Finance Data - [Semester]](/_next/image/?url=https%3A%2F%2Fdesklib.com%2Fmedia%2Fbusiness-finance-statistics-hypothesis-interpretation_page_2.jpg&w=256&q=75)


Your All-in-One AI-Powered Toolkit for Academic Success.
+13062052269
info@desklib.com
Available 24*7 on WhatsApp / Email
![[object Object]](/_next/static/media/star-bottom.7253800d.svg)
Copyright © 2020–2026 A2Z Services. All Rights Reserved. Developed and managed by ZUCOL.