Business Decision Making Report: Sainsbury's Performance Analysis
VerifiedAdded on 2020/01/21
|27
|5608
|160
Report
AI Summary
This report provides a comprehensive analysis of business decision-making processes, focusing on the performance of Sainsbury's. It begins with an introduction to the importance of data-driven decision-making in business, followed by a detailed plan for collecting primary and secondary data. The report outlines survey methodologies, sampling frames, and a sample questionnaire designed to gather customer feedback. The analysis includes a comparison of Sainsbury's and Tesco's sales and operating profits over a period of time, using various statistical tools such as mean, median, range, and standard deviation to interpret the financial performance of both companies. The report also incorporates graphical representations of data, including trend lines for forecasting, and concludes with a business presentation and a formal business report for Sainsbury's management. Furthermore, the report explores the use of information processing tools, activity networks, critical path analysis, and financial tools like NPV to aid in decision-making processes. The final sections include a conclusion, references, and an index of tables and illustrations to support the analysis.
BUSINESS DECISION
MAKING
MAKING
Paraphrase This Document
Need a fresh take? Get an instant paraphrase of this document with our AI Paraphraser
TABLE OF CONTENTS
INTRODUCTION................................................................................................................................3
TASK 1.................................................................................................................................................3
1.1 Plan for the collection of primary and secondary......................................................................3
1.2 Presenting the survey methodology and sampling frame used..................................................4
1.3 Questionnaire for a given business problem..............................................................................4
TASK 2.................................................................................................................................................6
2.1 Summarized data for decision making.......................................................................................6
2.2 Analysis of the result drawn through various statistical tools...................................................8
2.3 Analysis of data using measures of dispersion to inform a given business scenario.................9
2.4 Quartiles, percentiles and the correlation coefficient and the conclusions................................9
TASK 3...............................................................................................................................................10
3.1 Producing graphs using spreadsheets......................................................................................10
3.2 Trend lines in spreadsheet graphs to assist in forecasting for specified business information 17
3.3 A business presentation using suitable software and techniques to disseminate Information
effectively......................................................................................................................................18
3.4 Formal business report for the attention of Sainsbury’s management.....................................18
TASK 4...............................................................................................................................................19
4.1 Using appropriate information processing tools......................................................................19
4.2 Constructing activity network and determining critical path...................................................20
4.3 Use of Financial Tools.............................................................................................................22
CONCLUSION..................................................................................................................................25
REFERENCES...................................................................................................................................26
1
INDEX OF TABLES
Table 1: Sainsbury's Sales and Operating Profit.............................................................................6
Table 2: Tesco's Sales and operating profit from 1997 to 2012...........................................................7
Table 3: Descriptive Statistics of Salisbury's Sales and Operating Profit............................................8
Table 4: Descriptive statistics of Tesco's sales and operating profit....................................................8
Table 5: Quartiles of Sainsbury:...........................................................................................................9
Table 6: Quartiles of Tesco...................................................................................................................9
Table 7: Sainsbury’s sales and profit from 2010 to 2015...................................................................11
Table 8: Tesco's Sales and profit from 2010 to 2015..........................................................................12
Table 9: Frequency distribution of sales - Sainsbury.........................................................................13
Table 10: Frequency distribution of operating profit Sainsbury........................................................14
Table 11: Frequency distribution table for sales Tesco......................................................................16
Table 12: Frequency distribution table for operating profit Tesco.....................................................17
Table 13: Activities of Network Diagram..........................................................................................20
Table 14: Time Schedule....................................................................................................................21
Table 15: Gantt chart..........................................................................................................................22
Table 16: Estimated Cash Flows........................................................................................................22
Table 17: NPV for Project A..............................................................................................................23
Table 18: NPV for Project B..............................................................................................................23
ILLUSTRATION INDEX
Illustration 1: Sainsbury’s Sales and Profit........................................................................................10
Illustration 2: Tesco's Sales and Operating Profit...............................................................................10
Illustration 3: Sales of Sainsbury........................................................................................................11
Illustration 4: Sainsbury's profit from 2010 to 2015...........................................................................11
Illustration 5: Tesco's Sales from 2010 to 2015..................................................................................12
Illustration 6: Tesco's Operating Profit from 2010 to 2015................................................................12
Illustration 7: Line Chart of Sainsbury's sales and profit...................................................................12
Illustration 8: Line Chart of Tesco's Sales and Profit.........................................................................13
2
⊘ This is a preview!⊘
Do you want full access?
Subscribe today to unlock all pages.
Trusted by 1+ million students worldwide
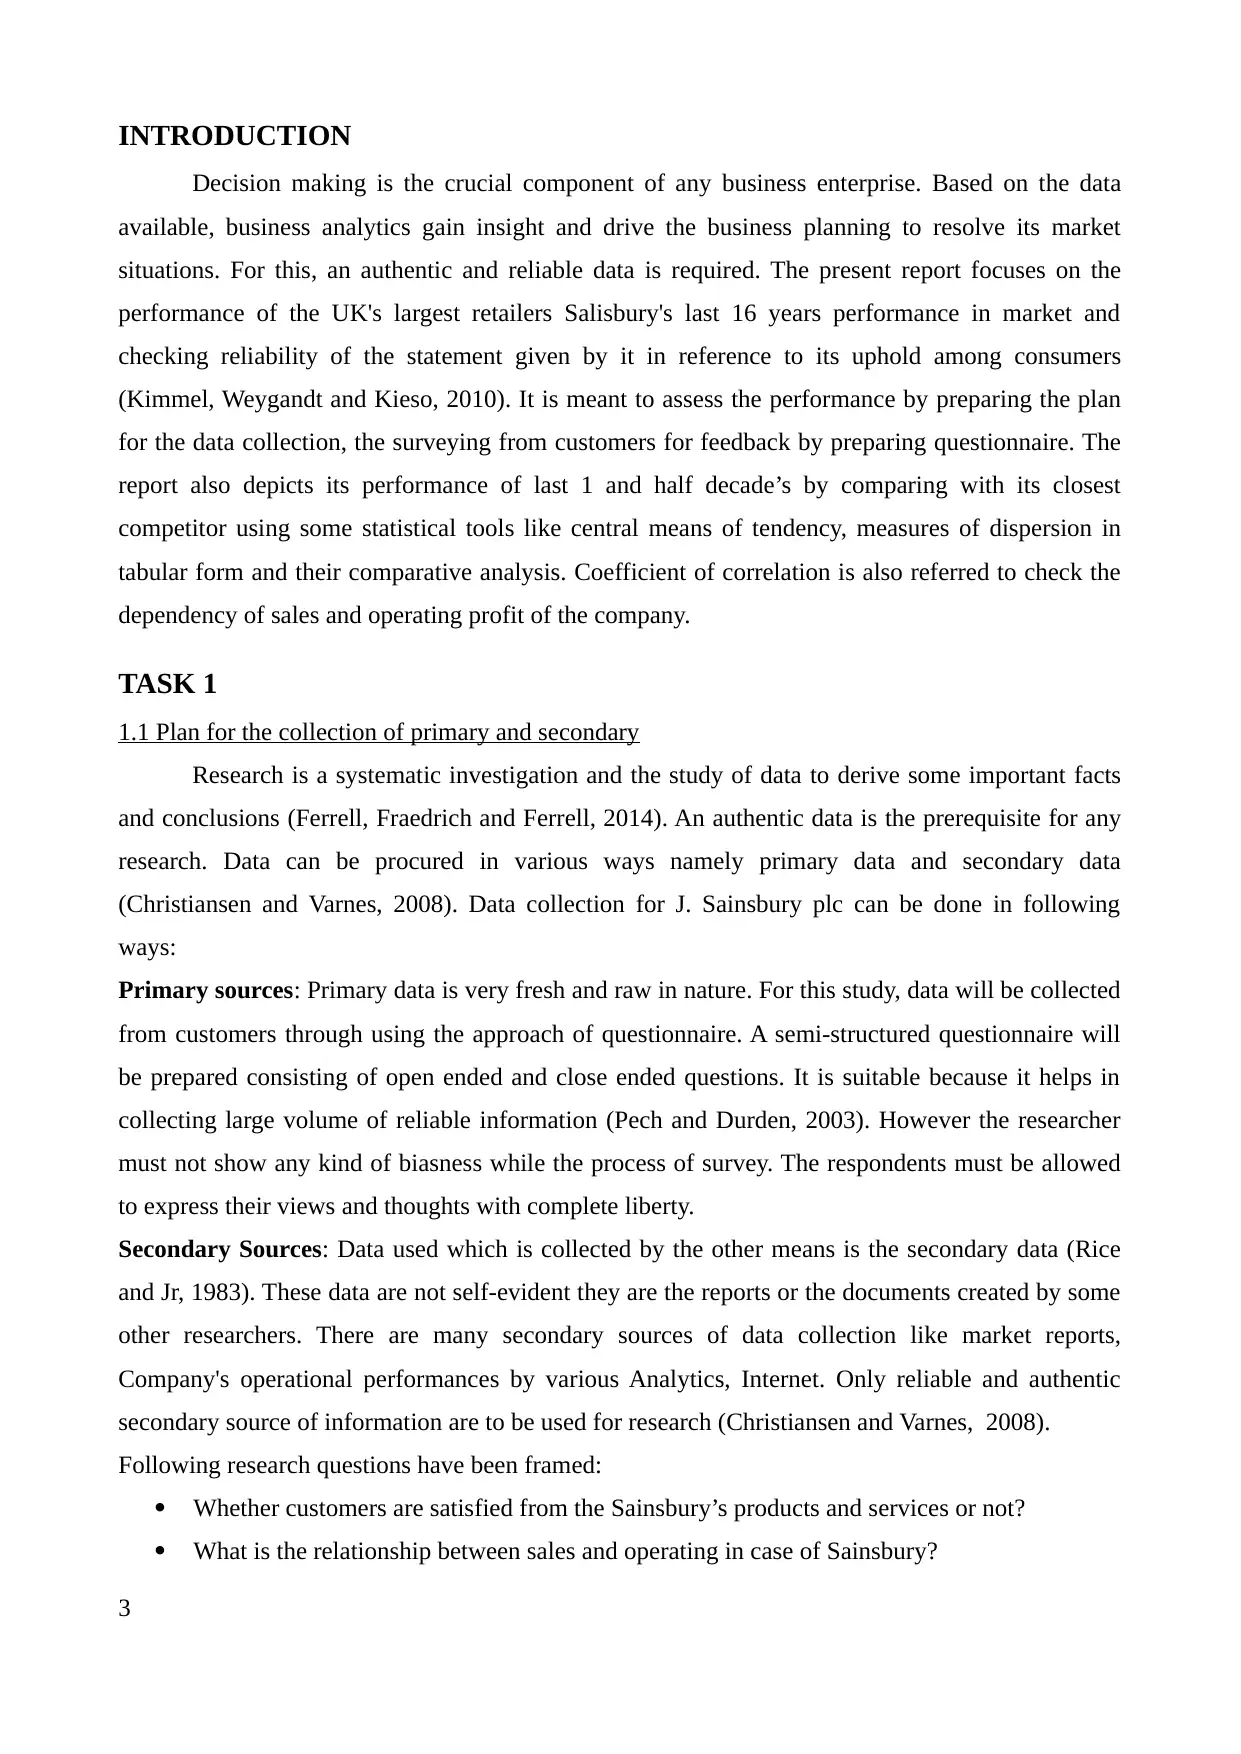
INTRODUCTION
Decision making is the crucial component of any business enterprise. Based on the data
available, business analytics gain insight and drive the business planning to resolve its market
situations. For this, an authentic and reliable data is required. The present report focuses on the
performance of the UK's largest retailers Salisbury's last 16 years performance in market and
checking reliability of the statement given by it in reference to its uphold among consumers
(Kimmel, Weygandt and Kieso, 2010). It is meant to assess the performance by preparing the plan
for the data collection, the surveying from customers for feedback by preparing questionnaire. The
report also depicts its performance of last 1 and half decade’s by comparing with its closest
competitor using some statistical tools like central means of tendency, measures of dispersion in
tabular form and their comparative analysis. Coefficient of correlation is also referred to check the
dependency of sales and operating profit of the company.
TASK 1
1.1 Plan for the collection of primary and secondary
Research is a systematic investigation and the study of data to derive some important facts
and conclusions (Ferrell, Fraedrich and Ferrell, 2014). An authentic data is the prerequisite for any
research. Data can be procured in various ways namely primary data and secondary data
(Christiansen and Varnes, 2008). Data collection for J. Sainsbury plc can be done in following
ways:
Primary sources: Primary data is very fresh and raw in nature. For this study, data will be collected
from customers through using the approach of questionnaire. A semi-structured questionnaire will
be prepared consisting of open ended and close ended questions. It is suitable because it helps in
collecting large volume of reliable information (Pech and Durden, 2003). However the researcher
must not show any kind of biasness while the process of survey. The respondents must be allowed
to express their views and thoughts with complete liberty.
Secondary Sources: Data used which is collected by the other means is the secondary data (Rice
and Jr, 1983). These data are not self-evident they are the reports or the documents created by some
other researchers. There are many secondary sources of data collection like market reports,
Company's operational performances by various Analytics, Internet. Only reliable and authentic
secondary source of information are to be used for research (Christiansen and Varnes, 2008).
Following research questions have been framed:
Whether customers are satisfied from the Sainsbury’s products and services or not?
What is the relationship between sales and operating in case of Sainsbury?
3
Paraphrase This Document
Need a fresh take? Get an instant paraphrase of this document with our AI Paraphraser
Series of logical steps of data collection
Preparation of questionnaire
Performing sampling
Deriving responses
Filtration of data
Data evaluation (Majumdar, 2014)
1.2 Presenting the survey methodology and sampling frame used
Survey methodology is the data collection technique improve the business situation by
methods such as questionnaires prepared for customers to get the feedback (Pimentel, Kuntz and
Elenkov, 2010). It defines the framework under which the research is to be performed. In case of
this study, questionnaire approach has been used. Some of set of questionnaires will be distributed
among the customers of Sainsbury. The main purpose is to derive the perception of people towards
the company’s goods and service (Pimentel, Kuntz and Elenkov, 2010). During the survey process,
the identity of the respondents must not be disclosed without their prior approval. The aim of the
survey process must be communicated to them in clear manner before starting it.
Sampling is an activity which is performed to select the population sample from which the
desired information is to be collected. The research activities becomes easier and simpler due to
sampling (Woodside, 2005). There are mainly two types of sampling which includes probability and
non- probability techniques. Here the method used is Random sampling method. Respondents are
selected on the basis of random approach outside the stores of Sainsbury. It is suitable because it
helps in selecting the sample by avoiding the personal biasness. Both qualitative and quantitative
approach has been kept for this study (Pech and Durden, 2003). Descriptive analysis will be used
and methods like quartile, correlation and range will be applied. The collected information will be
kept secretive and there will not be any misrepresentation of facts and figures.
Population and sample size
A sample size of 50 respondents have been kept for this study. It is appropriate and it is
expected that it will help in achieving the aim and objectives of the research.
1.3 Questionnaire for a given business problem
Questionnaire prepared to know the consumer's feedback and to make the necessary changes
is as follows:
Gender
Male
4
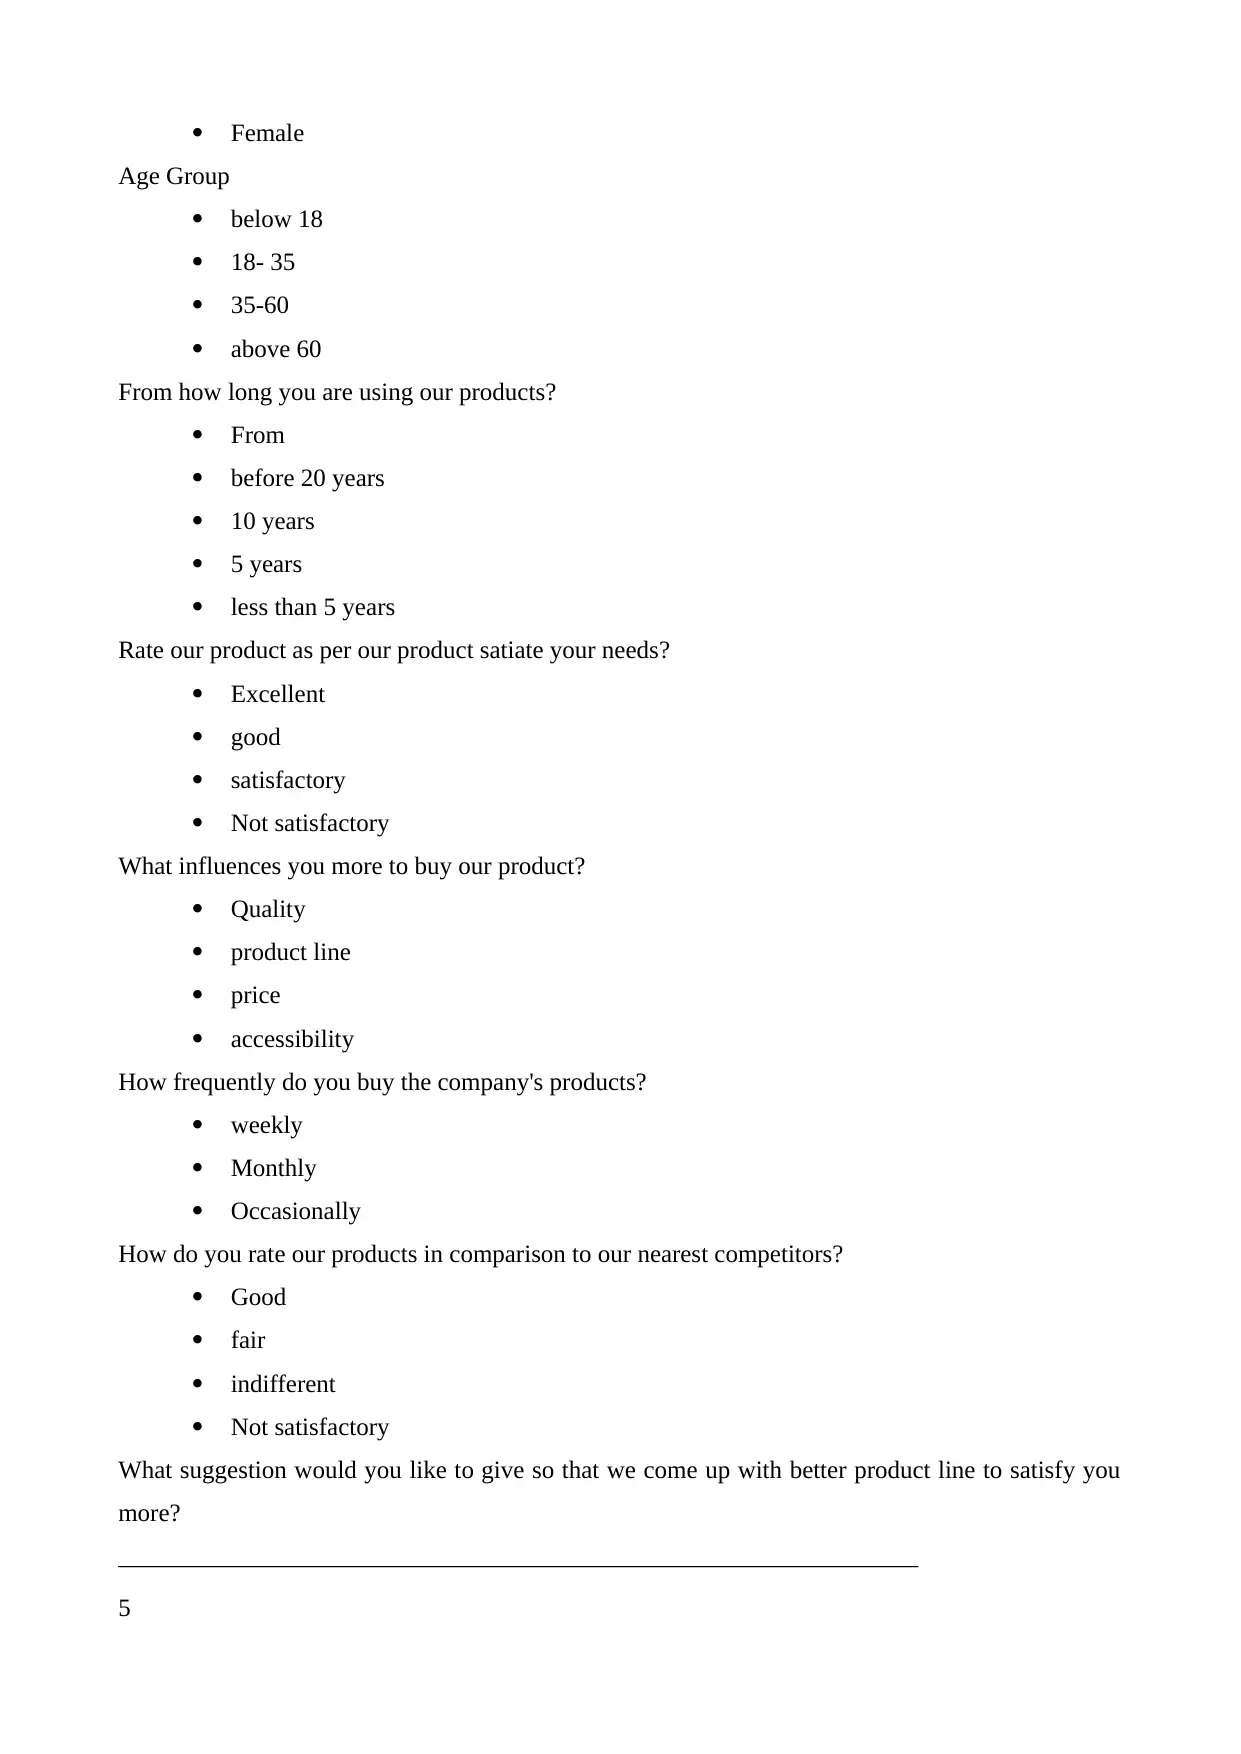
Female
Age Group
below 18
18- 35
35-60
above 60
From how long you are using our products?
From
before 20 years
10 years
5 years
less than 5 years
Rate our product as per our product satiate your needs?
Excellent
good
satisfactory
Not satisfactory
What influences you more to buy our product?
Quality
product line
price
accessibility
How frequently do you buy the company's products?
weekly
Monthly
Occasionally
How do you rate our products in comparison to our nearest competitors?
Good
fair
indifferent
Not satisfactory
What suggestion would you like to give so that we come up with better product line to satisfy you
more?
________________________________________________________________
5
⊘ This is a preview!⊘
Do you want full access?
Subscribe today to unlock all pages.
Trusted by 1+ million students worldwide
TASK 2
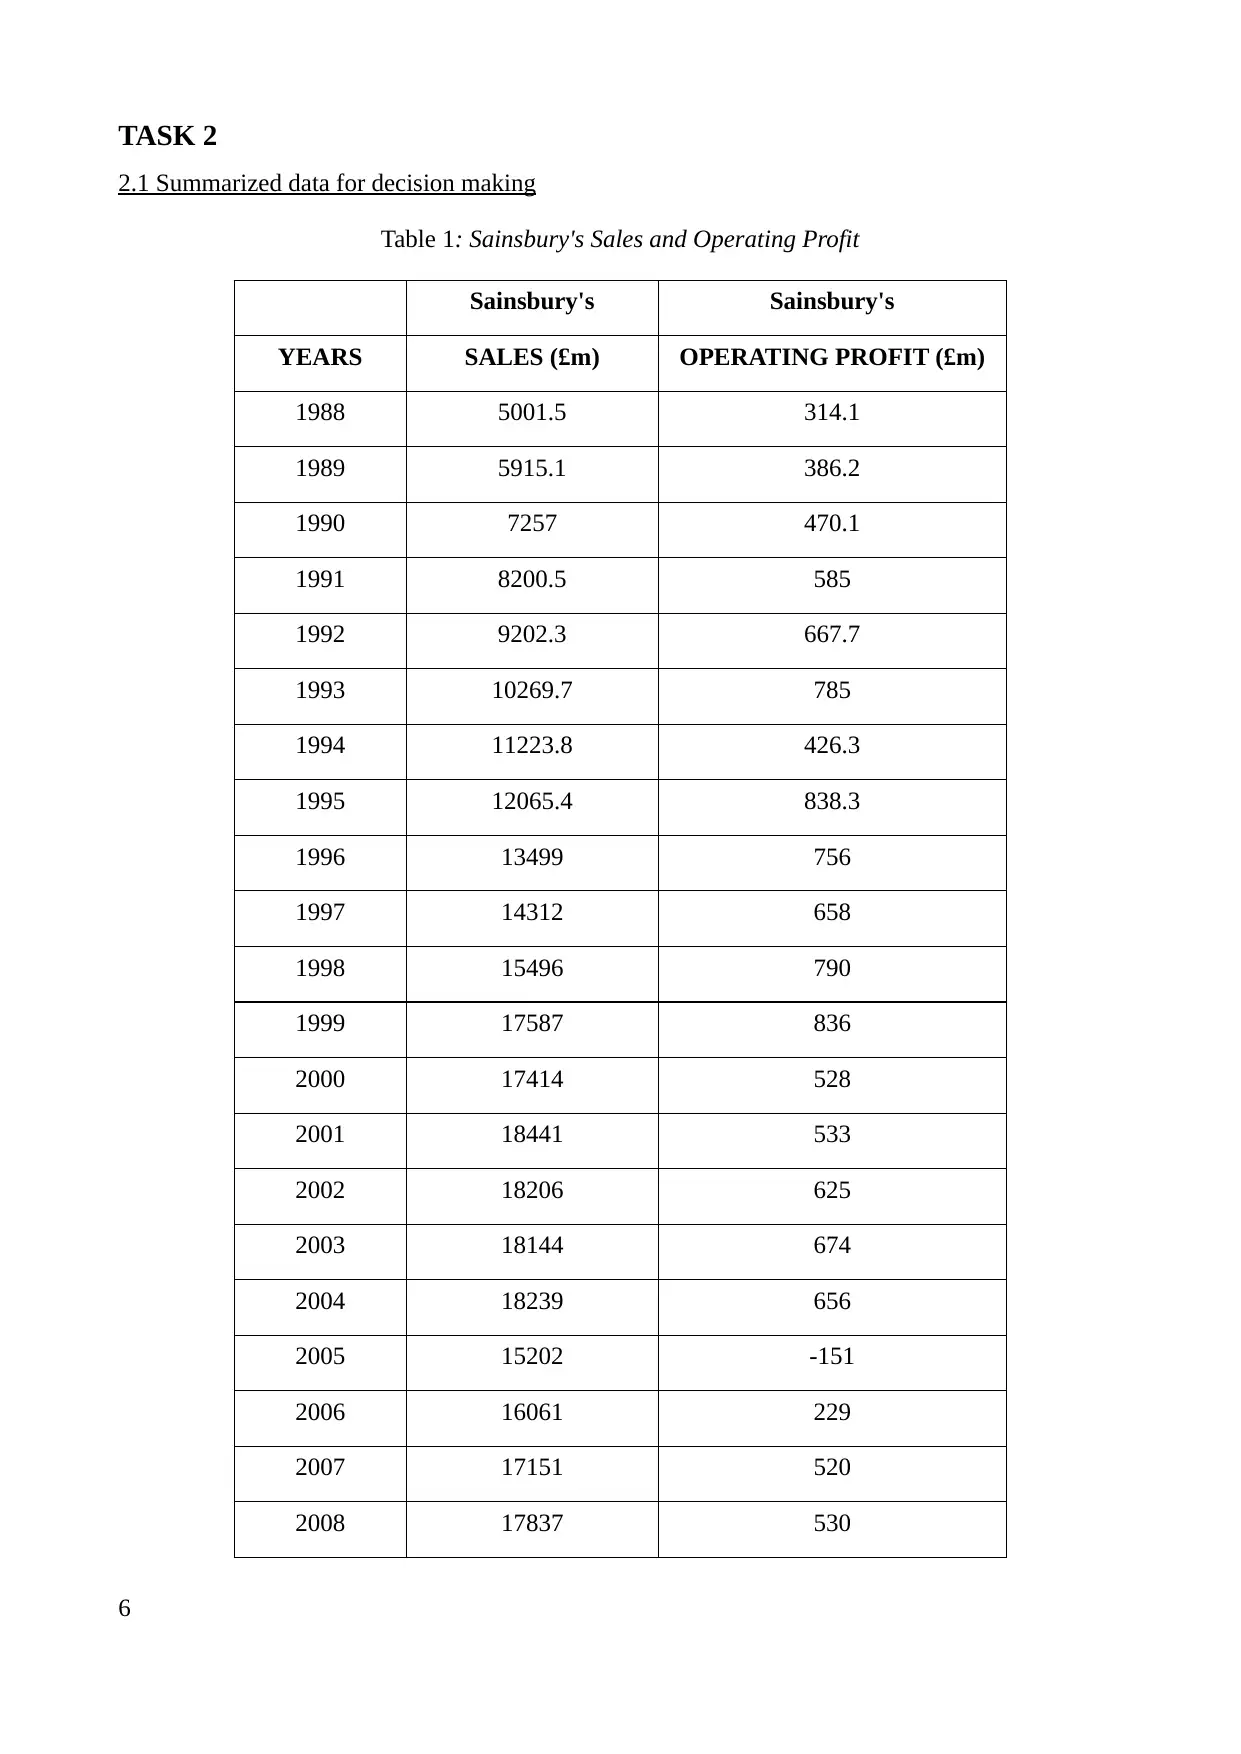
2.1 Summarized data for decision making
Table 1: Sainsbury's Sales and Operating Profit
Sainsbury's Sainsbury's
YEARS SALES (£m) OPERATING PROFIT (£m)
1988 5001.5 314.1
1989 5915.1 386.2
1990 7257 470.1
1991 8200.5 585
1992 9202.3 667.7
1993 10269.7 785
1994 11223.8 426.3
1995 12065.4 838.3
1996 13499 756
1997 14312 658
1998 15496 790
1999 17587 836
2000 17414 528
2001 18441 533
2002 18206 625
2003 18144 674
2004 18239 656
2005 15202 -151
2006 16061 229
2007 17151 520
2008 17837 530
6
Paraphrase This Document
Need a fresh take? Get an instant paraphrase of this document with our AI Paraphraser
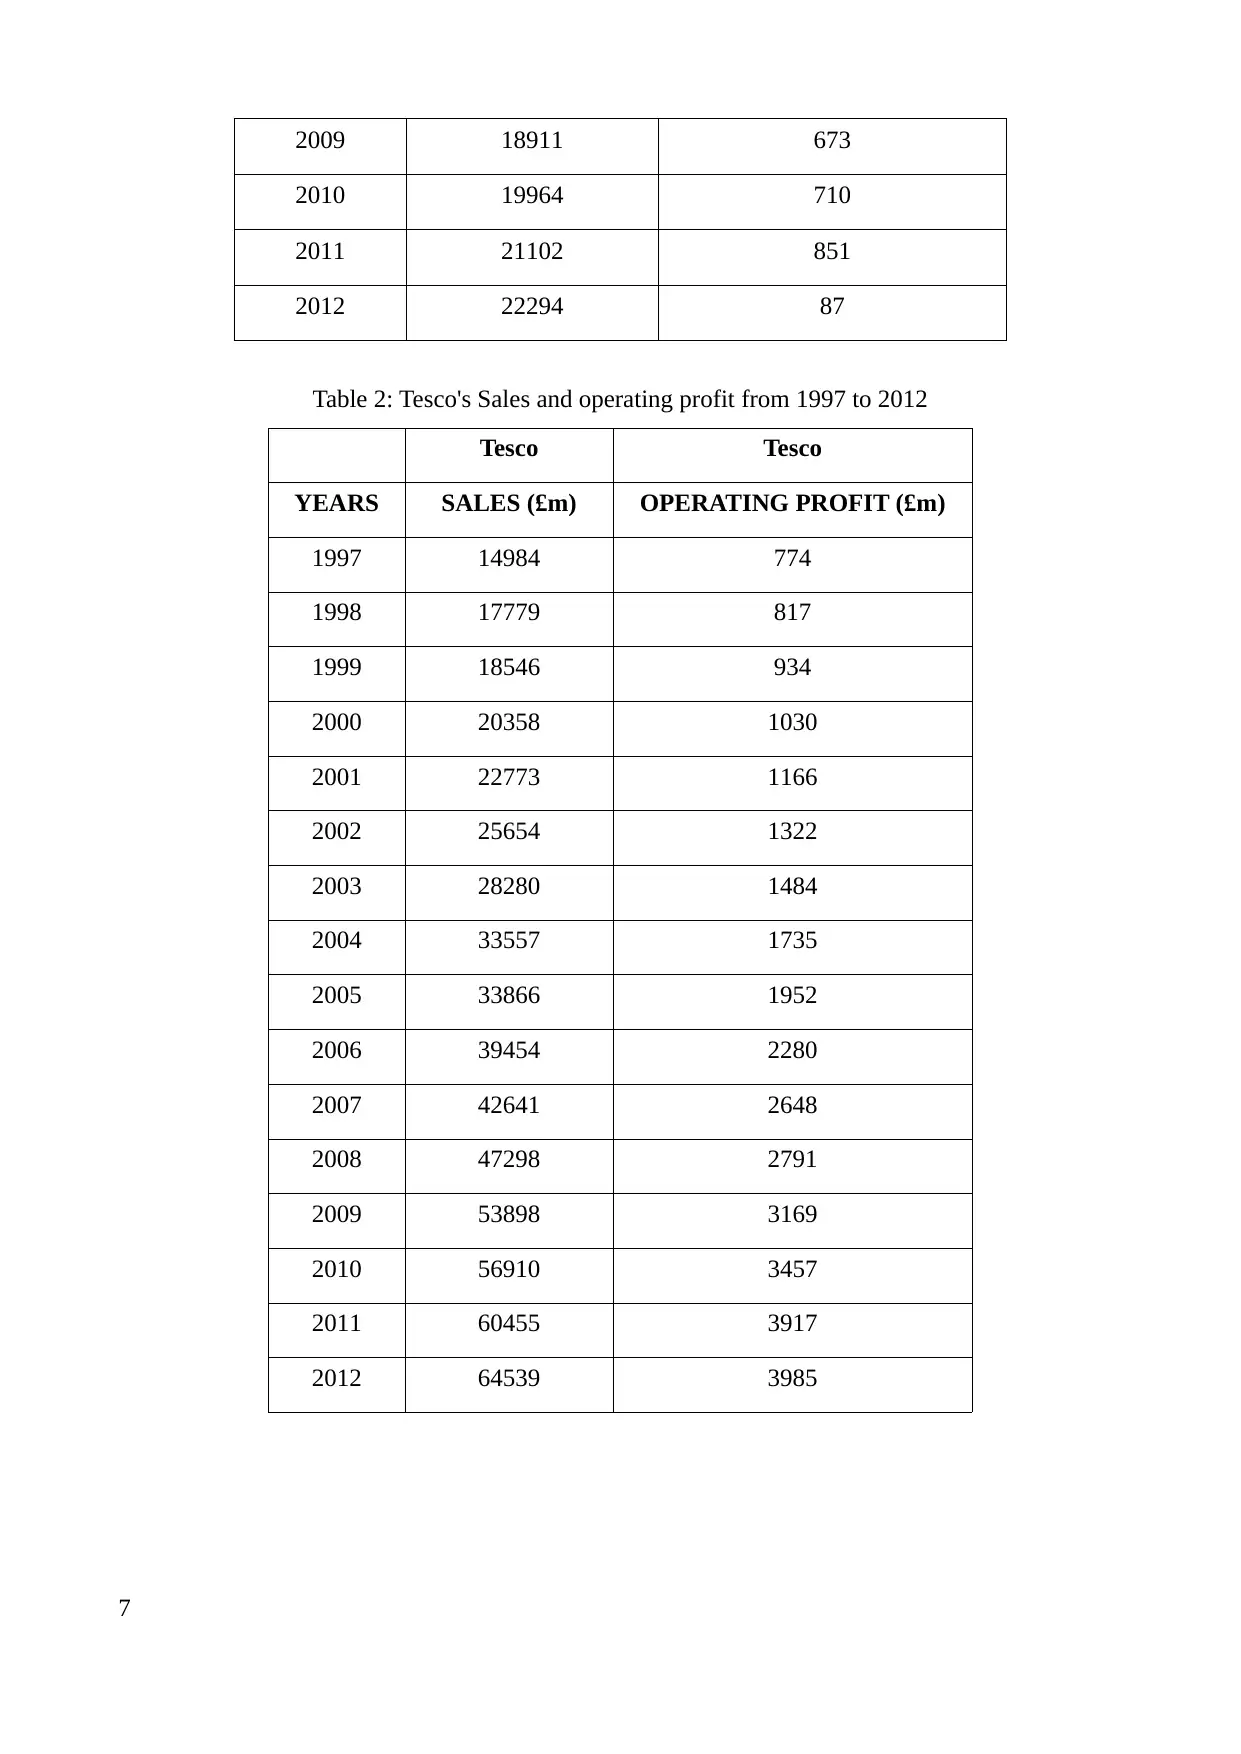
2009 18911 673
2010 19964 710
2011 21102 851
2012 22294 87
Table 2: Tesco's Sales and operating profit from 1997 to 2012
Tesco Tesco
YEARS SALES (£m) OPERATING PROFIT (£m)
1997 14984 774
1998 17779 817
1999 18546 934
2000 20358 1030
2001 22773 1166
2002 25654 1322
2003 28280 1484
2004 33557 1735
2005 33866 1952
2006 39454 2280
2007 42641 2648
2008 47298 2791
2009 53898 3169
2010 56910 3457
2011 60455 3917
2012 64539 3985
7
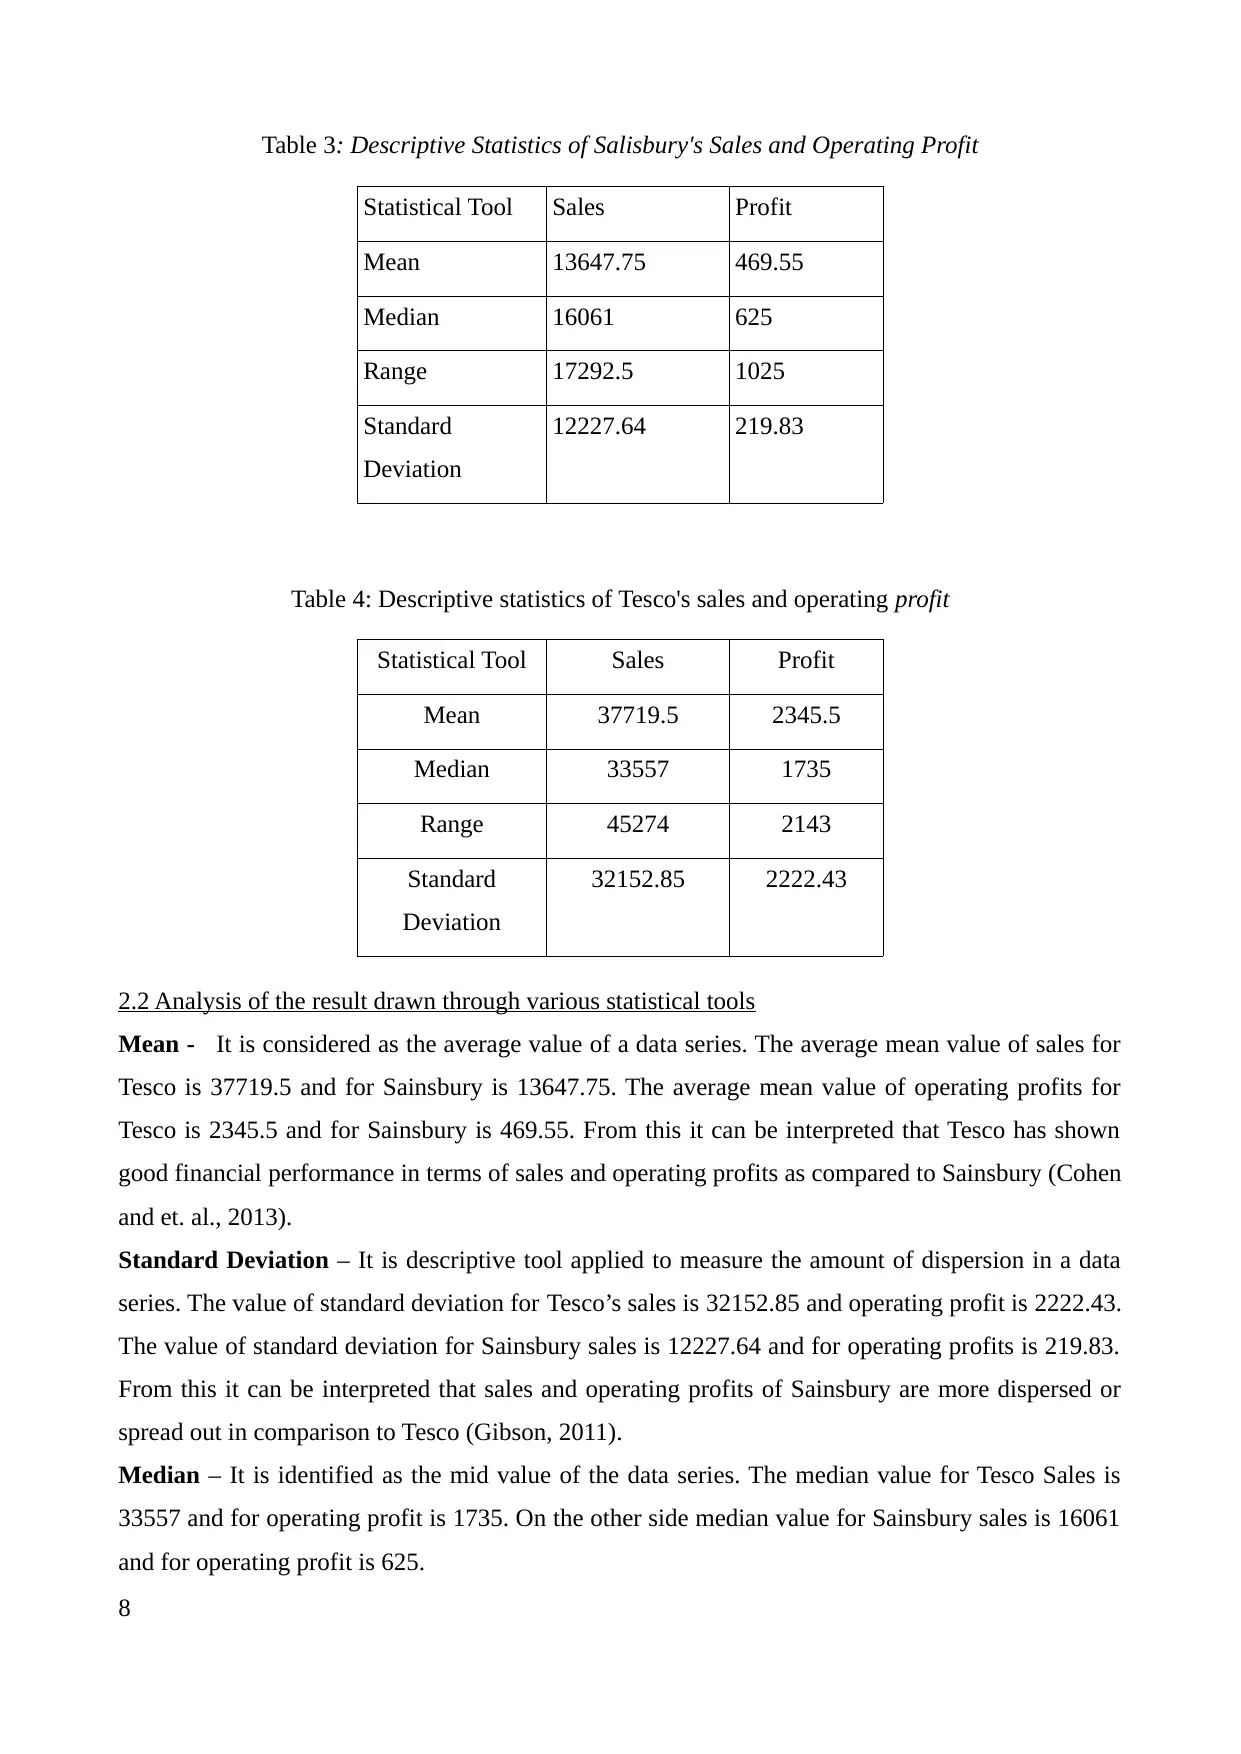
Table 3: Descriptive Statistics of Salisbury's Sales and Operating Profit
Statistical Tool Sales Profit
Mean 13647.75 469.55
Median 16061 625
Range 17292.5 1025
Standard
Deviation
12227.64 219.83
Table 4: Descriptive statistics of Tesco's sales and operating profit
Statistical Tool Sales Profit
Mean 37719.5 2345.5
Median 33557 1735
Range 45274 2143
Standard
Deviation
32152.85 2222.43
2.2 Analysis of the result drawn through various statistical tools
Mean - It is considered as the average value of a data series. The average mean value of sales for
Tesco is 37719.5 and for Sainsbury is 13647.75. The average mean value of operating profits for
Tesco is 2345.5 and for Sainsbury is 469.55. From this it can be interpreted that Tesco has shown
good financial performance in terms of sales and operating profits as compared to Sainsbury (Cohen
and et. al., 2013).
Standard Deviation – It is descriptive tool applied to measure the amount of dispersion in a data
series. The value of standard deviation for Tesco’s sales is 32152.85 and operating profit is 2222.43.
The value of standard deviation for Sainsbury sales is 12227.64 and for operating profits is 219.83.
From this it can be interpreted that sales and operating profits of Sainsbury are more dispersed or
spread out in comparison to Tesco (Gibson, 2011).
Median – It is identified as the mid value of the data series. The median value for Tesco Sales is
33557 and for operating profit is 1735. On the other side median value for Sainsbury sales is 16061
and for operating profit is 625.
8
Statistical Tool Sales Profit
Mean 13647.75 469.55
Median 16061 625
Range 17292.5 1025
Standard
Deviation
12227.64 219.83
Table 4: Descriptive statistics of Tesco's sales and operating profit
Statistical Tool Sales Profit
Mean 37719.5 2345.5
Median 33557 1735
Range 45274 2143
Standard
Deviation
32152.85 2222.43
2.2 Analysis of the result drawn through various statistical tools
Mean - It is considered as the average value of a data series. The average mean value of sales for
Tesco is 37719.5 and for Sainsbury is 13647.75. The average mean value of operating profits for
Tesco is 2345.5 and for Sainsbury is 469.55. From this it can be interpreted that Tesco has shown
good financial performance in terms of sales and operating profits as compared to Sainsbury (Cohen
and et. al., 2013).
Standard Deviation – It is descriptive tool applied to measure the amount of dispersion in a data
series. The value of standard deviation for Tesco’s sales is 32152.85 and operating profit is 2222.43.
The value of standard deviation for Sainsbury sales is 12227.64 and for operating profits is 219.83.
From this it can be interpreted that sales and operating profits of Sainsbury are more dispersed or
spread out in comparison to Tesco (Gibson, 2011).
Median – It is identified as the mid value of the data series. The median value for Tesco Sales is
33557 and for operating profit is 1735. On the other side median value for Sainsbury sales is 16061
and for operating profit is 625.
8
⊘ This is a preview!⊘
Do you want full access?
Subscribe today to unlock all pages.
Trusted by 1+ million students worldwide
Interpretation
After getting the required data from all the sources we can make some interpretations based
on that. Referring to the above tabulated data, Sainsbury’s average sales are 13647.75 and that of
Tesco's is 37719.5 which far more than Sainsbury’. Considering the respective mean operating
profit of Tesco and Sainsbury’ are 2345.5 and 469.55, we can infer that both the companies have
better growth possibilities (Nicholson and Aman, 2012).
2.3 Analysis of data using measures of dispersion to inform a given business scenario
Range - Range is difference between the maximum and minimum values (Majumdar, 2014). The
range of sales and operating profit of Sainsbury are less than Tesco which means Tesco is growing
with a faster pace.
Standard variance – It is a tool which is regarded as the square root of the variance. It shows the
distribution of the data series. The sample variance of for Sainsbury is higher as compared to Tesco
in terms of sales (Sucky, Aksoy and Ozturk, 2012). While on the other side variance of Sainsbury is
lesser as compared to Tesco in terms of operating profit.
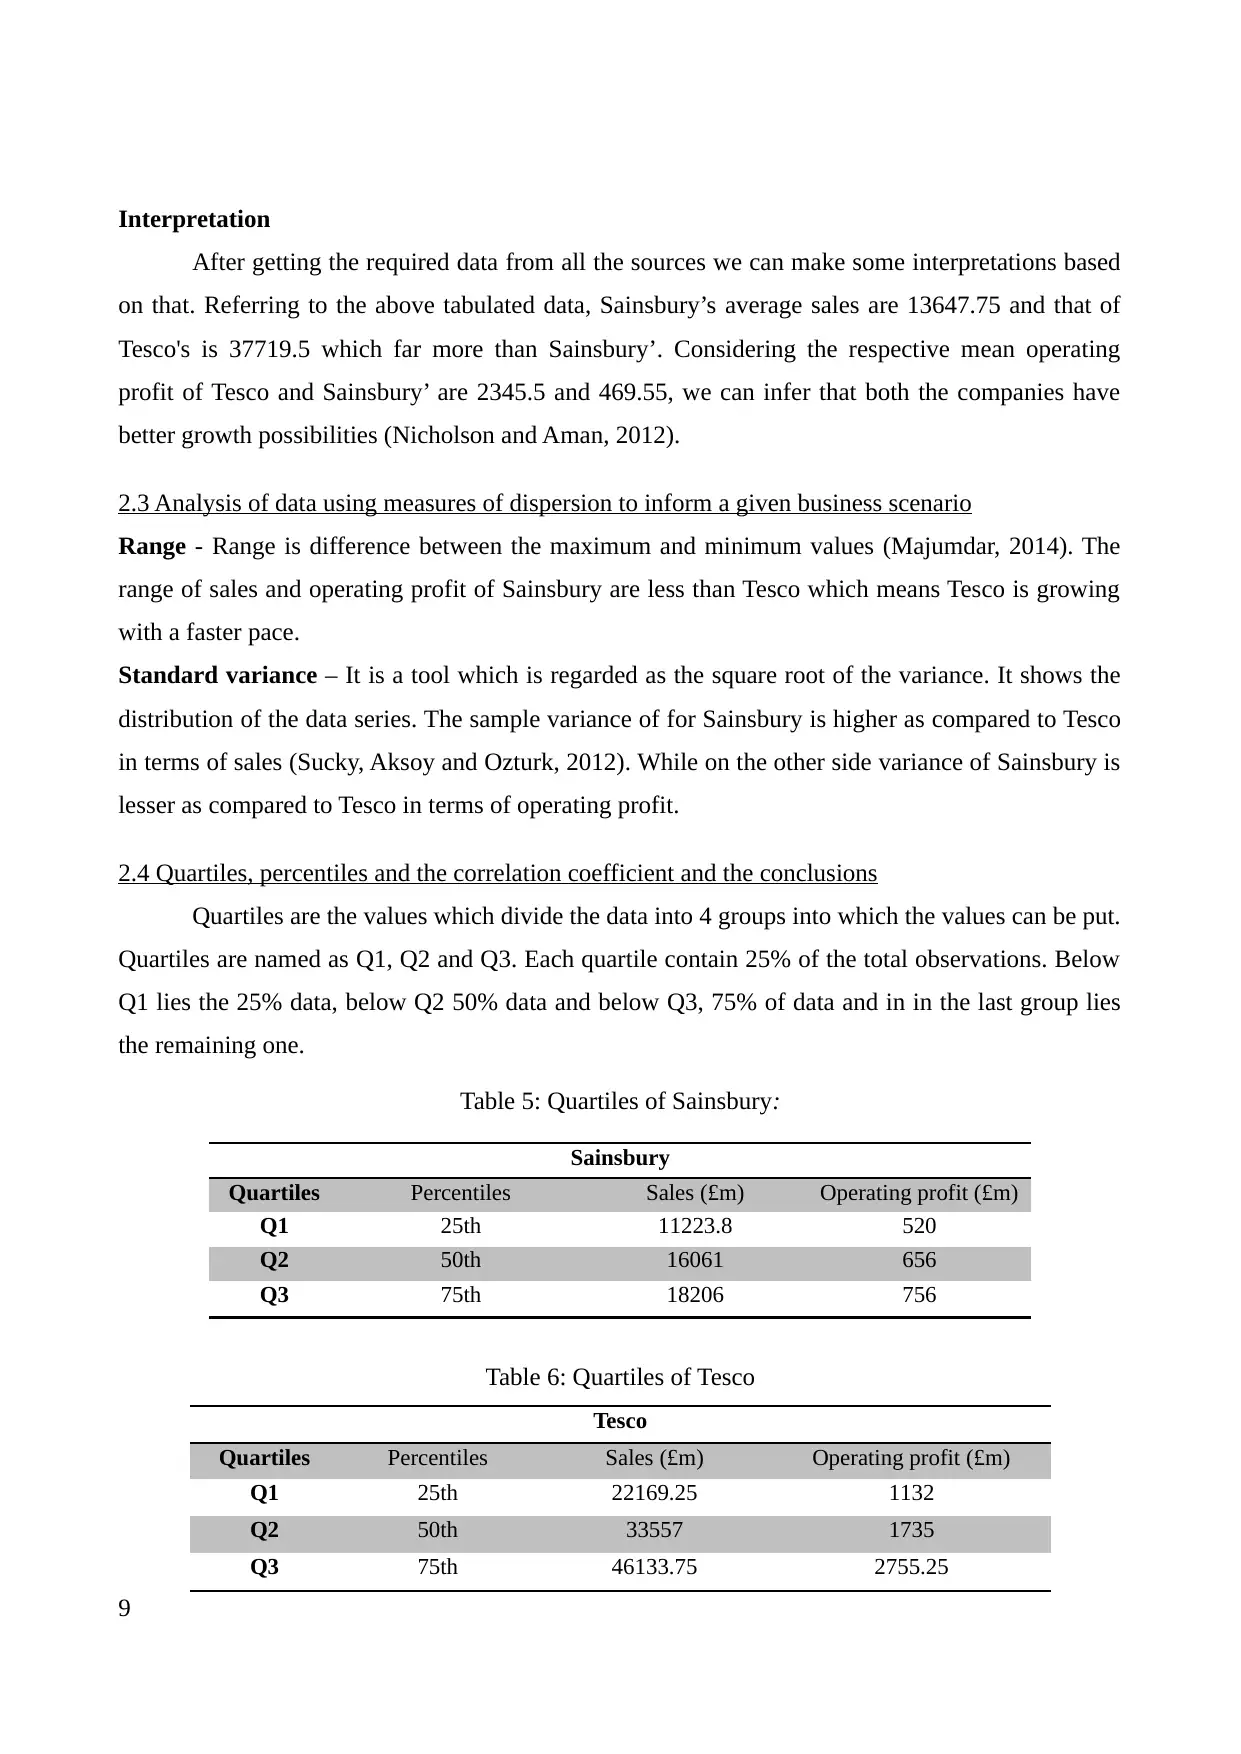
2.4 Quartiles, percentiles and the correlation coefficient and the conclusions
Quartiles are the values which divide the data into 4 groups into which the values can be put.
Quartiles are named as Q1, Q2 and Q3. Each quartile contain 25% of the total observations. Below
Q1 lies the 25% data, below Q2 50% data and below Q3, 75% of data and in in the last group lies
the remaining one.
Table 5: Quartiles of Sainsbury:
Sainsbury
Quartiles Percentiles Sales (£m) Operating profit (£m)
Q1 25th 11223.8 520
Q2 50th 16061 656
Q3 75th 18206 756
Table 6: Quartiles of Tesco
Tesco
Quartiles Percentiles Sales (£m) Operating profit (£m)
Q1 25th 22169.25 1132
Q2 50th 33557 1735
Q3 75th 46133.75 2755.25
9
After getting the required data from all the sources we can make some interpretations based
on that. Referring to the above tabulated data, Sainsbury’s average sales are 13647.75 and that of
Tesco's is 37719.5 which far more than Sainsbury’. Considering the respective mean operating
profit of Tesco and Sainsbury’ are 2345.5 and 469.55, we can infer that both the companies have
better growth possibilities (Nicholson and Aman, 2012).
2.3 Analysis of data using measures of dispersion to inform a given business scenario
Range - Range is difference between the maximum and minimum values (Majumdar, 2014). The
range of sales and operating profit of Sainsbury are less than Tesco which means Tesco is growing
with a faster pace.
Standard variance – It is a tool which is regarded as the square root of the variance. It shows the
distribution of the data series. The sample variance of for Sainsbury is higher as compared to Tesco
in terms of sales (Sucky, Aksoy and Ozturk, 2012). While on the other side variance of Sainsbury is
lesser as compared to Tesco in terms of operating profit.
2.4 Quartiles, percentiles and the correlation coefficient and the conclusions
Quartiles are the values which divide the data into 4 groups into which the values can be put.
Quartiles are named as Q1, Q2 and Q3. Each quartile contain 25% of the total observations. Below
Q1 lies the 25% data, below Q2 50% data and below Q3, 75% of data and in in the last group lies
the remaining one.
Table 5: Quartiles of Sainsbury:
Sainsbury
Quartiles Percentiles Sales (£m) Operating profit (£m)
Q1 25th 11223.8 520
Q2 50th 16061 656
Q3 75th 18206 756
Table 6: Quartiles of Tesco
Tesco
Quartiles Percentiles Sales (£m) Operating profit (£m)
Q1 25th 22169.25 1132
Q2 50th 33557 1735
Q3 75th 46133.75 2755.25
9
Paraphrase This Document
Need a fresh take? Get an instant paraphrase of this document with our AI Paraphraser
Quartile – The quartile sales value of Tesco are Q1= 22169.25, Q2 = £33711.5 and Q3= £48948.
The quartile sales value of Sainsbury are Q1= £11,223.8, Q2 = £16,061 and Q3= £ 18206. From this
it can be interpreted that quartile sales of Tesco are higher as compared to Sainsbury.
The quartiles values of operating profits for Tesco are Q1 = £1132, Q2 = 1843 and Q3 =
£2885.5. The quartile values of operating profits for Sainsbury are Q1=£520, Q2= £656 and
Q3=£756. From this it can be interpreted that operating profits of Tesco for all the quartiles are
higher as compared to Sainsbury (Wallnöfer and Hacklin, 2012).
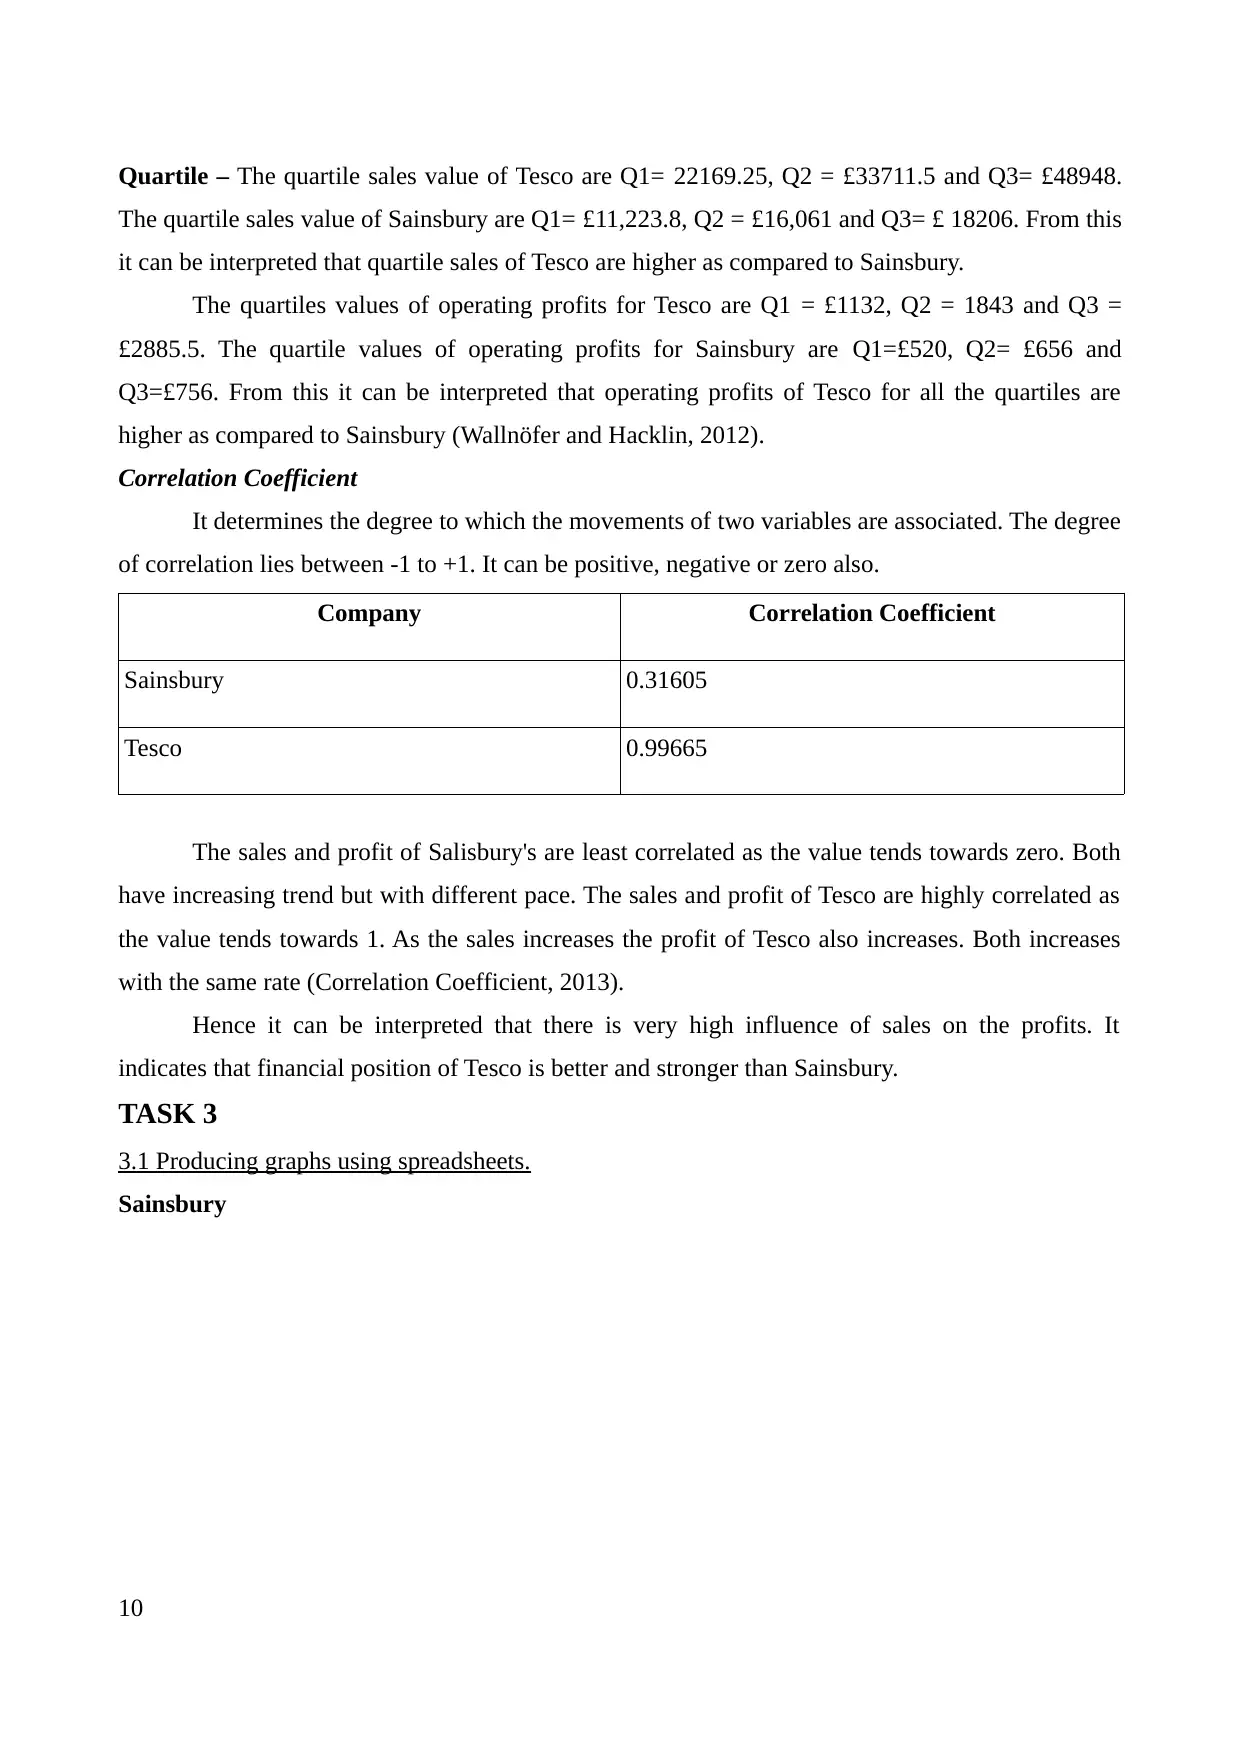
Correlation Coefficient
It determines the degree to which the movements of two variables are associated. The degree
of correlation lies between -1 to +1. It can be positive, negative or zero also.
Company Correlation Coefficient
Sainsbury 0.31605
Tesco 0.99665
The sales and profit of Salisbury's are least correlated as the value tends towards zero. Both
have increasing trend but with different pace. The sales and profit of Tesco are highly correlated as
the value tends towards 1. As the sales increases the profit of Tesco also increases. Both increases
with the same rate (Correlation Coefficient, 2013).
Hence it can be interpreted that there is very high influence of sales on the profits. It
indicates that financial position of Tesco is better and stronger than Sainsbury.
TASK 3
3.1 Producing graphs using spreadsheets.
Sainsbury
10
The quartile sales value of Sainsbury are Q1= £11,223.8, Q2 = £16,061 and Q3= £ 18206. From this
it can be interpreted that quartile sales of Tesco are higher as compared to Sainsbury.
The quartiles values of operating profits for Tesco are Q1 = £1132, Q2 = 1843 and Q3 =
£2885.5. The quartile values of operating profits for Sainsbury are Q1=£520, Q2= £656 and
Q3=£756. From this it can be interpreted that operating profits of Tesco for all the quartiles are
higher as compared to Sainsbury (Wallnöfer and Hacklin, 2012).
Correlation Coefficient
It determines the degree to which the movements of two variables are associated. The degree
of correlation lies between -1 to +1. It can be positive, negative or zero also.
Company Correlation Coefficient
Sainsbury 0.31605
Tesco 0.99665
The sales and profit of Salisbury's are least correlated as the value tends towards zero. Both
have increasing trend but with different pace. The sales and profit of Tesco are highly correlated as
the value tends towards 1. As the sales increases the profit of Tesco also increases. Both increases
with the same rate (Correlation Coefficient, 2013).
Hence it can be interpreted that there is very high influence of sales on the profits. It
indicates that financial position of Tesco is better and stronger than Sainsbury.
TASK 3
3.1 Producing graphs using spreadsheets.
Sainsbury
10
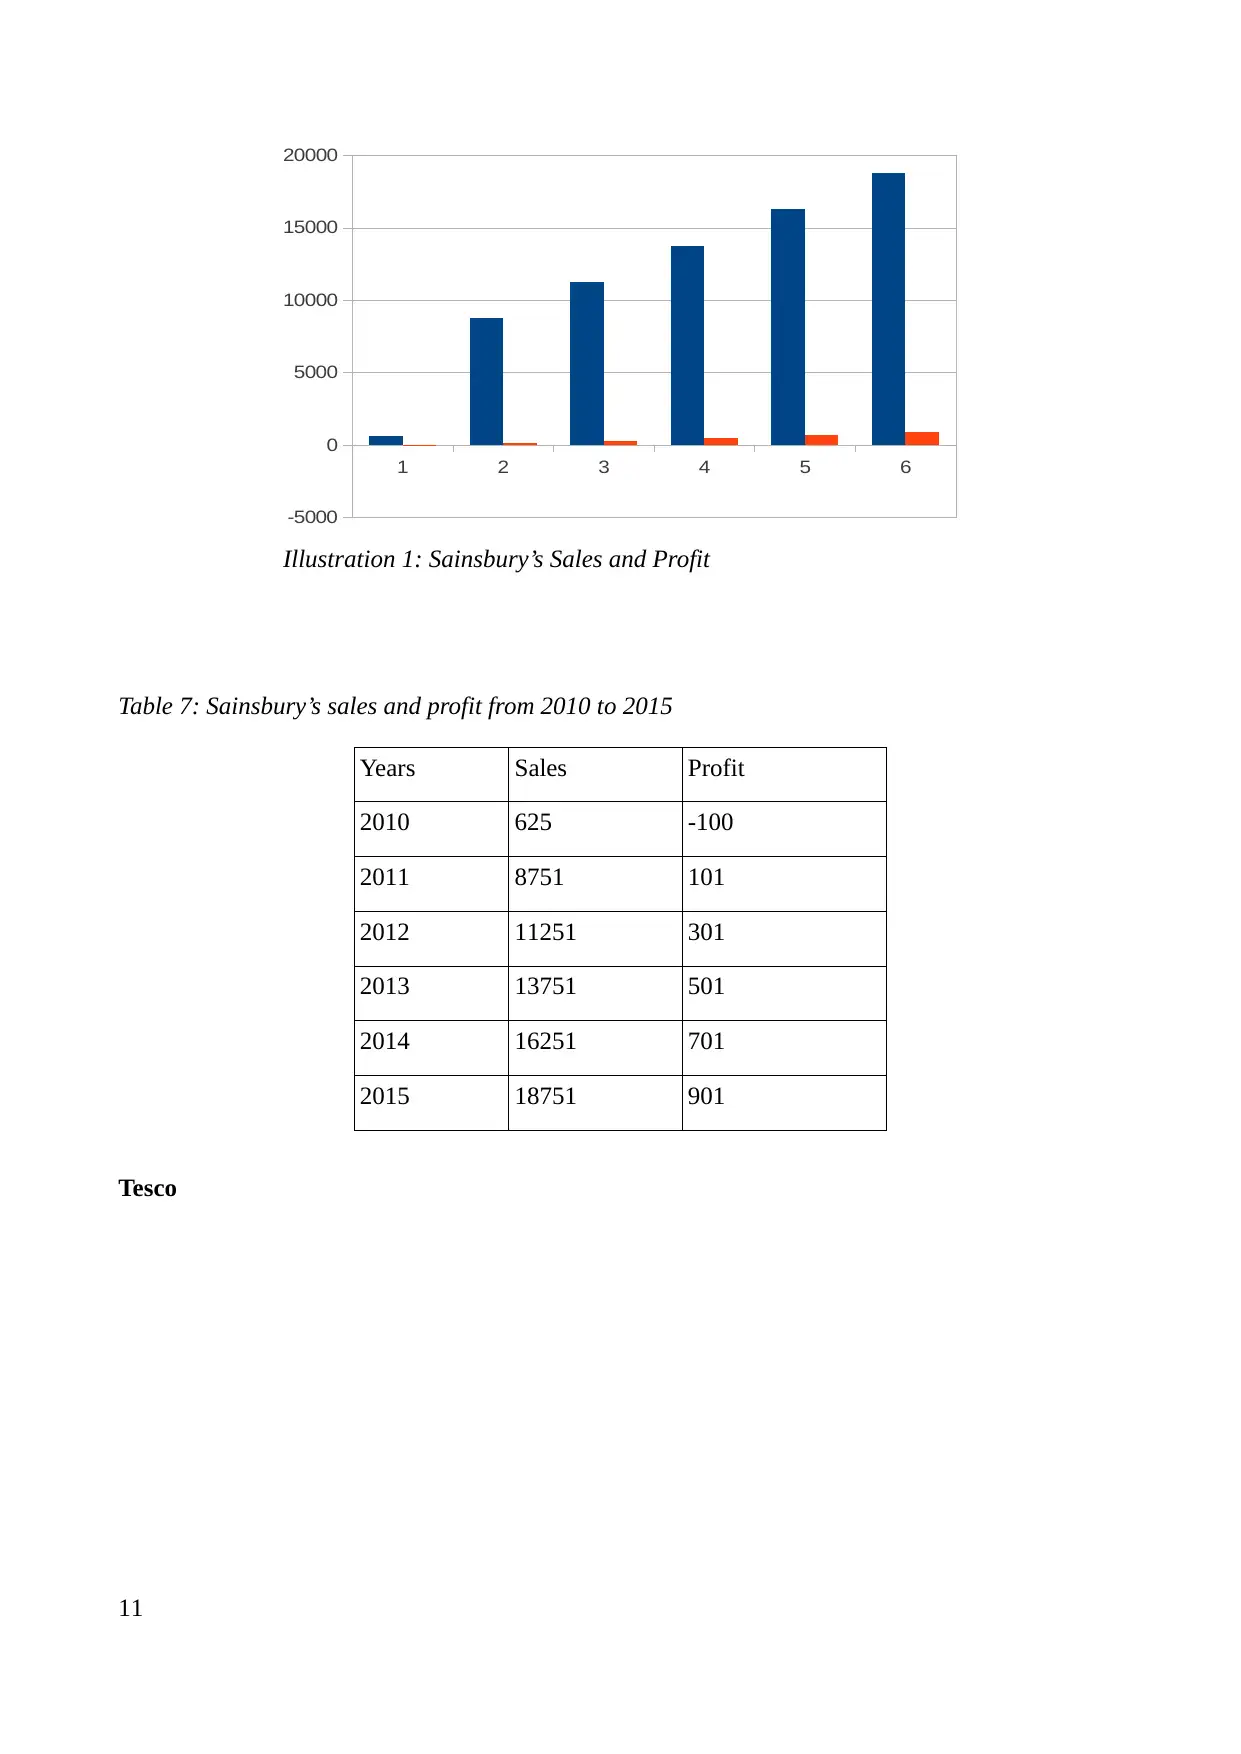
Table 7: Sainsbury’s sales and profit from 2010 to 2015
Years Sales Profit
2010 625 -100
2011 8751 101
2012 11251 301
2013 13751 501
2014 16251 701
2015 18751 901
Tesco
11
1 2 3 4 5 6
-5000
0
5000
10000
15000
20000
Illustration 1: Sainsbury’s Sales and Profit
Years Sales Profit
2010 625 -100
2011 8751 101
2012 11251 301
2013 13751 501
2014 16251 701
2015 18751 901
Tesco
11
1 2 3 4 5 6
-5000
0
5000
10000
15000
20000
Illustration 1: Sainsbury’s Sales and Profit
⊘ This is a preview!⊘
Do you want full access?
Subscribe today to unlock all pages.
Trusted by 1+ million students worldwide
1 out of 27
Related Documents


Your All-in-One AI-Powered Toolkit for Academic Success.
+13062052269
info@desklib.com
Available 24*7 on WhatsApp / Email
![[object Object]](/_next/static/media/star-bottom.7253800d.svg)
Unlock your academic potential
Copyright © 2020–2026 A2Z Services. All Rights Reserved. Developed and managed by ZUCOL.