Analysis of Sales Data: Business Analytics and Statistics Report
VerifiedAdded on 2020/03/16
|18
|2940
|327
Report
AI Summary
This report provides a comprehensive analysis of sales data from Good Harvest Kitchen, a health food shop on the Sunshine Gold Coast. The analysis utilizes descriptive statistics, one-way ANOVA, regression analysis, and t-tests to address key research questions. The study investigates the top and worst-selling products, the impact of product location on sales performance, the relationship between sales, gross profits, and the time of year, the differences in sales performance across seasons, and the correlation between rainfall and profits. The findings reveal significant variations in product sales, the importance of product location within the shop, and the association between sales and profit with the time of year. The report concludes with recommendations based on the analysis, aiming to optimize sales strategies and improve overall business performance.
Running head: BUSINESS ANALYTICS AND STATISTICS
Business Analytics and Statistics
Name of the student
Name of the university
Author’s note
Business Analytics and Statistics
Name of the student
Name of the university
Author’s note
Paraphrase This Document
Need a fresh take? Get an instant paraphrase of this document with our AI Paraphraser
1ACCOUNTING FUNDAMENTALS
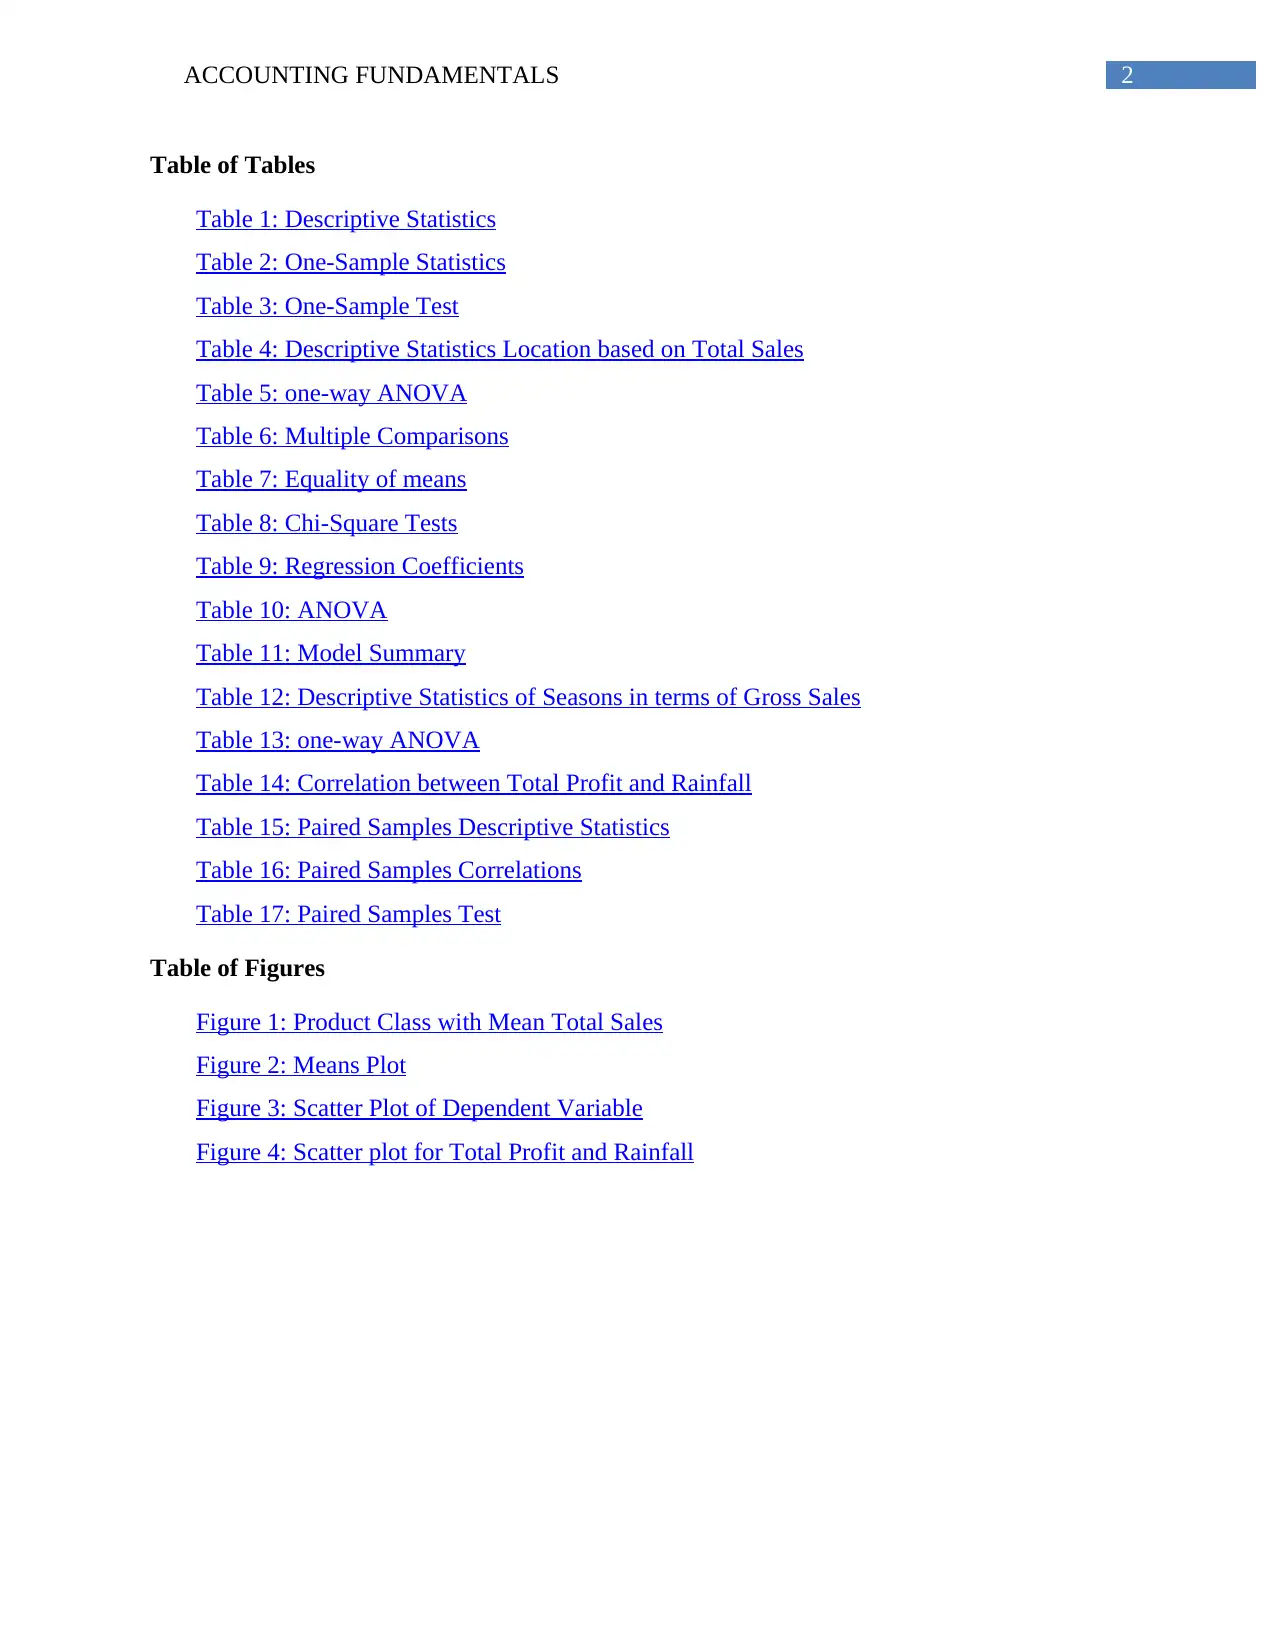
Table of Contents
Introduction......................................................................................................................................4
Problem Definition and business intelligence required...................................................................4
Results of Technical Analysis and Selected Analytics Method......................................................5
Research Question 1.....................................................................................................................5
Research Question 2.....................................................................................................................8
Research Question 3...................................................................................................................12
Research Question 4...................................................................................................................14
Research Question 5...................................................................................................................16
Discussion of the results and recommendations.............................................................................17
References......................................................................................................................................18
2ACCOUNTING FUNDAMENTALS
Table of Tables
Table 1: Descriptive Statistics
Table 2: One-Sample Statistics
Table 3: One-Sample Test
Table 4: Descriptive Statistics Location based on Total Sales
Table 5: one-way ANOVA
Table 6: Multiple Comparisons
Table 7: Equality of means
Table 8: Chi-Square Tests
Table 9: Regression Coefficients
Table 10: ANOVA
Table 11: Model Summary
Table 12: Descriptive Statistics of Seasons in terms of Gross Sales
Table 13: one-way ANOVA
Table 14: Correlation between Total Profit and Rainfall
Table 15: Paired Samples Descriptive Statistics
Table 16: Paired Samples Correlations
Table 17: Paired Samples Test
Table of Figures
Figure 1: Product Class with Mean Total Sales
Figure 2: Means Plot
Figure 3: Scatter Plot of Dependent Variable
Figure 4: Scatter plot for Total Profit and Rainfall
⊘ This is a preview!⊘
Do you want full access?
Subscribe today to unlock all pages.
Trusted by 1+ million students worldwide
3ACCOUNTING FUNDAMENTALS
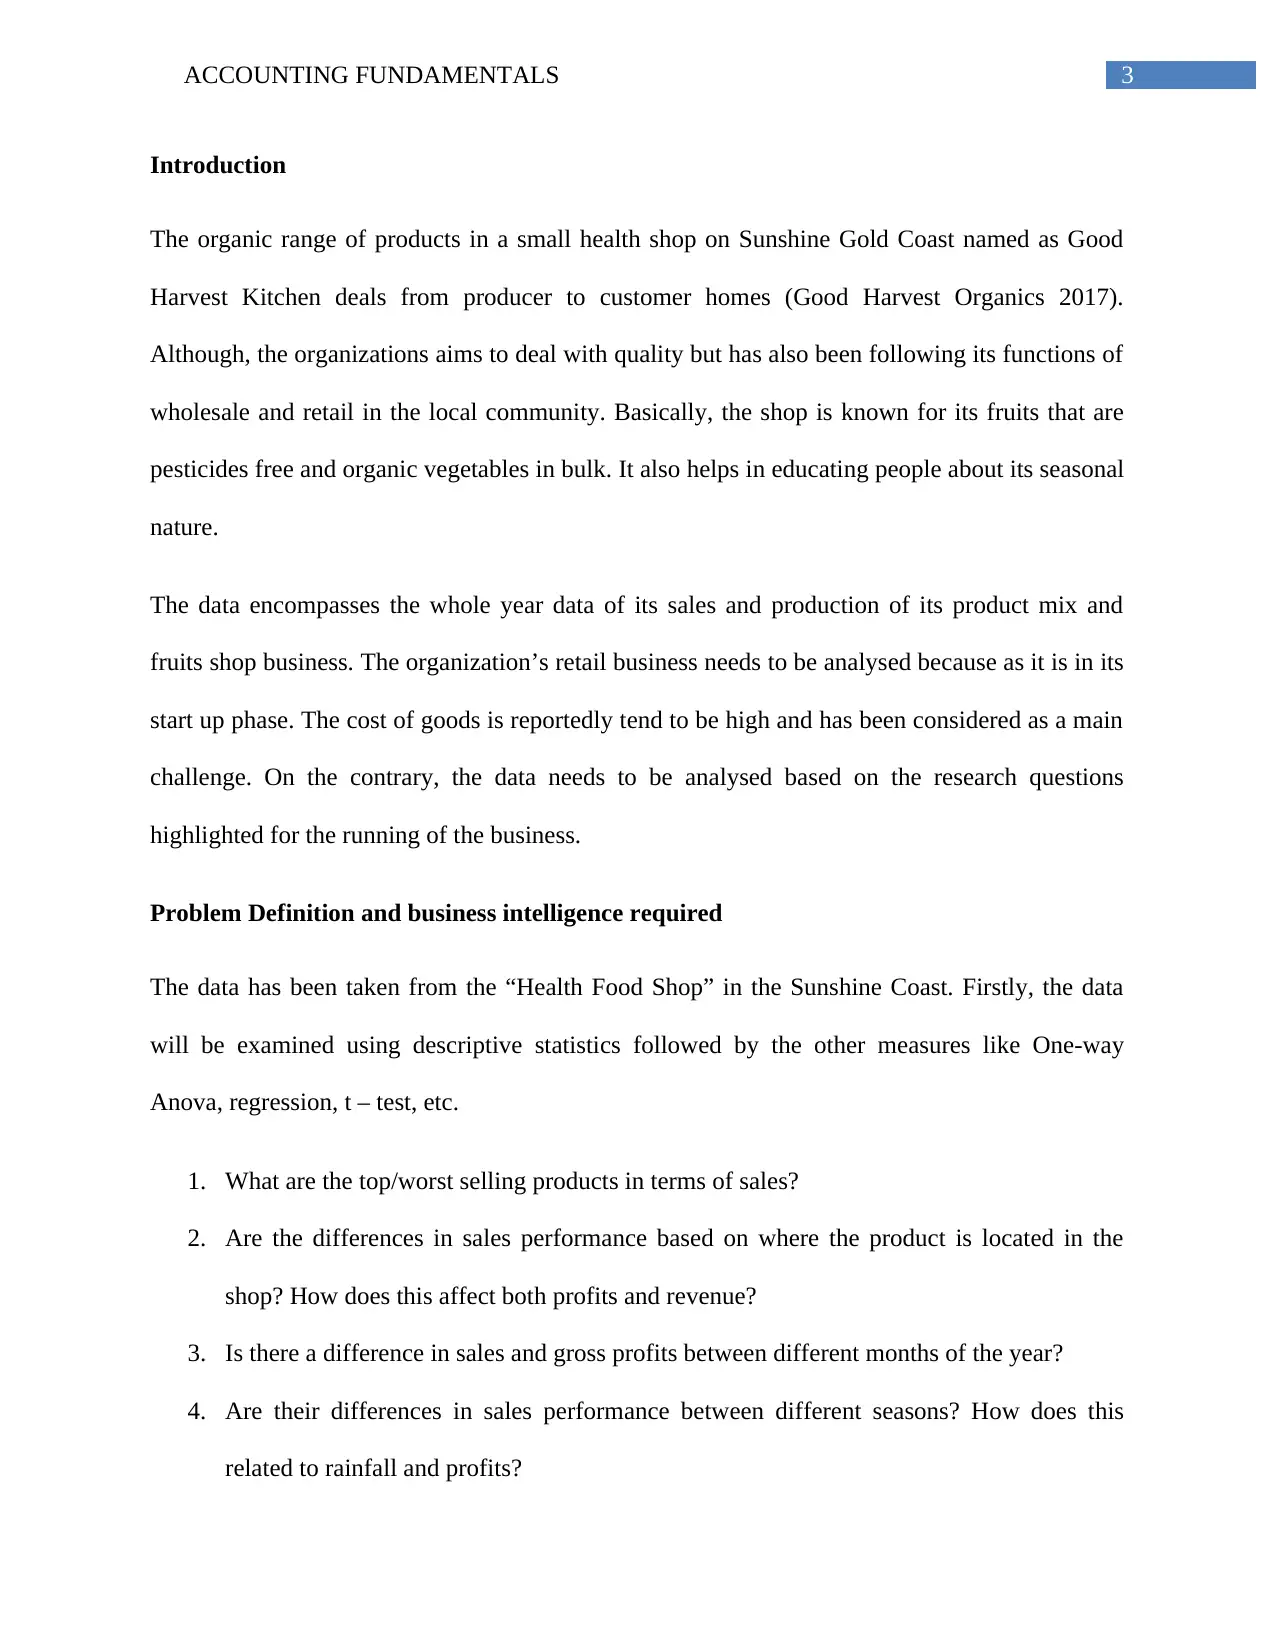
Introduction
The organic range of products in a small health shop on Sunshine Gold Coast named as Good
Harvest Kitchen deals from producer to customer homes (Good Harvest Organics 2017).
Although, the organizations aims to deal with quality but has also been following its functions of
wholesale and retail in the local community. Basically, the shop is known for its fruits that are
pesticides free and organic vegetables in bulk. It also helps in educating people about its seasonal
nature.
The data encompasses the whole year data of its sales and production of its product mix and
fruits shop business. The organization’s retail business needs to be analysed because as it is in its
start up phase. The cost of goods is reportedly tend to be high and has been considered as a main
challenge. On the contrary, the data needs to be analysed based on the research questions
highlighted for the running of the business.
Problem Definition and business intelligence required
The data has been taken from the “Health Food Shop” in the Sunshine Coast. Firstly, the data
will be examined using descriptive statistics followed by the other measures like One-way
Anova, regression, t – test, etc.
1. What are the top/worst selling products in terms of sales?
2. Are the differences in sales performance based on where the product is located in the
shop? How does this affect both profits and revenue?
3. Is there a difference in sales and gross profits between different months of the year?
4. Are their differences in sales performance between different seasons? How does this
related to rainfall and profits?
Paraphrase This Document
Need a fresh take? Get an instant paraphrase of this document with our AI Paraphraser
4ACCOUNTING FUNDAMENTALS
5. Do net sales and gross sales differ from GST inclusive or exclusive?
6. What location in the shop makes the most amount of Profit?
Results of Technical Analysis and Selected Analytics Method
Research Question 1
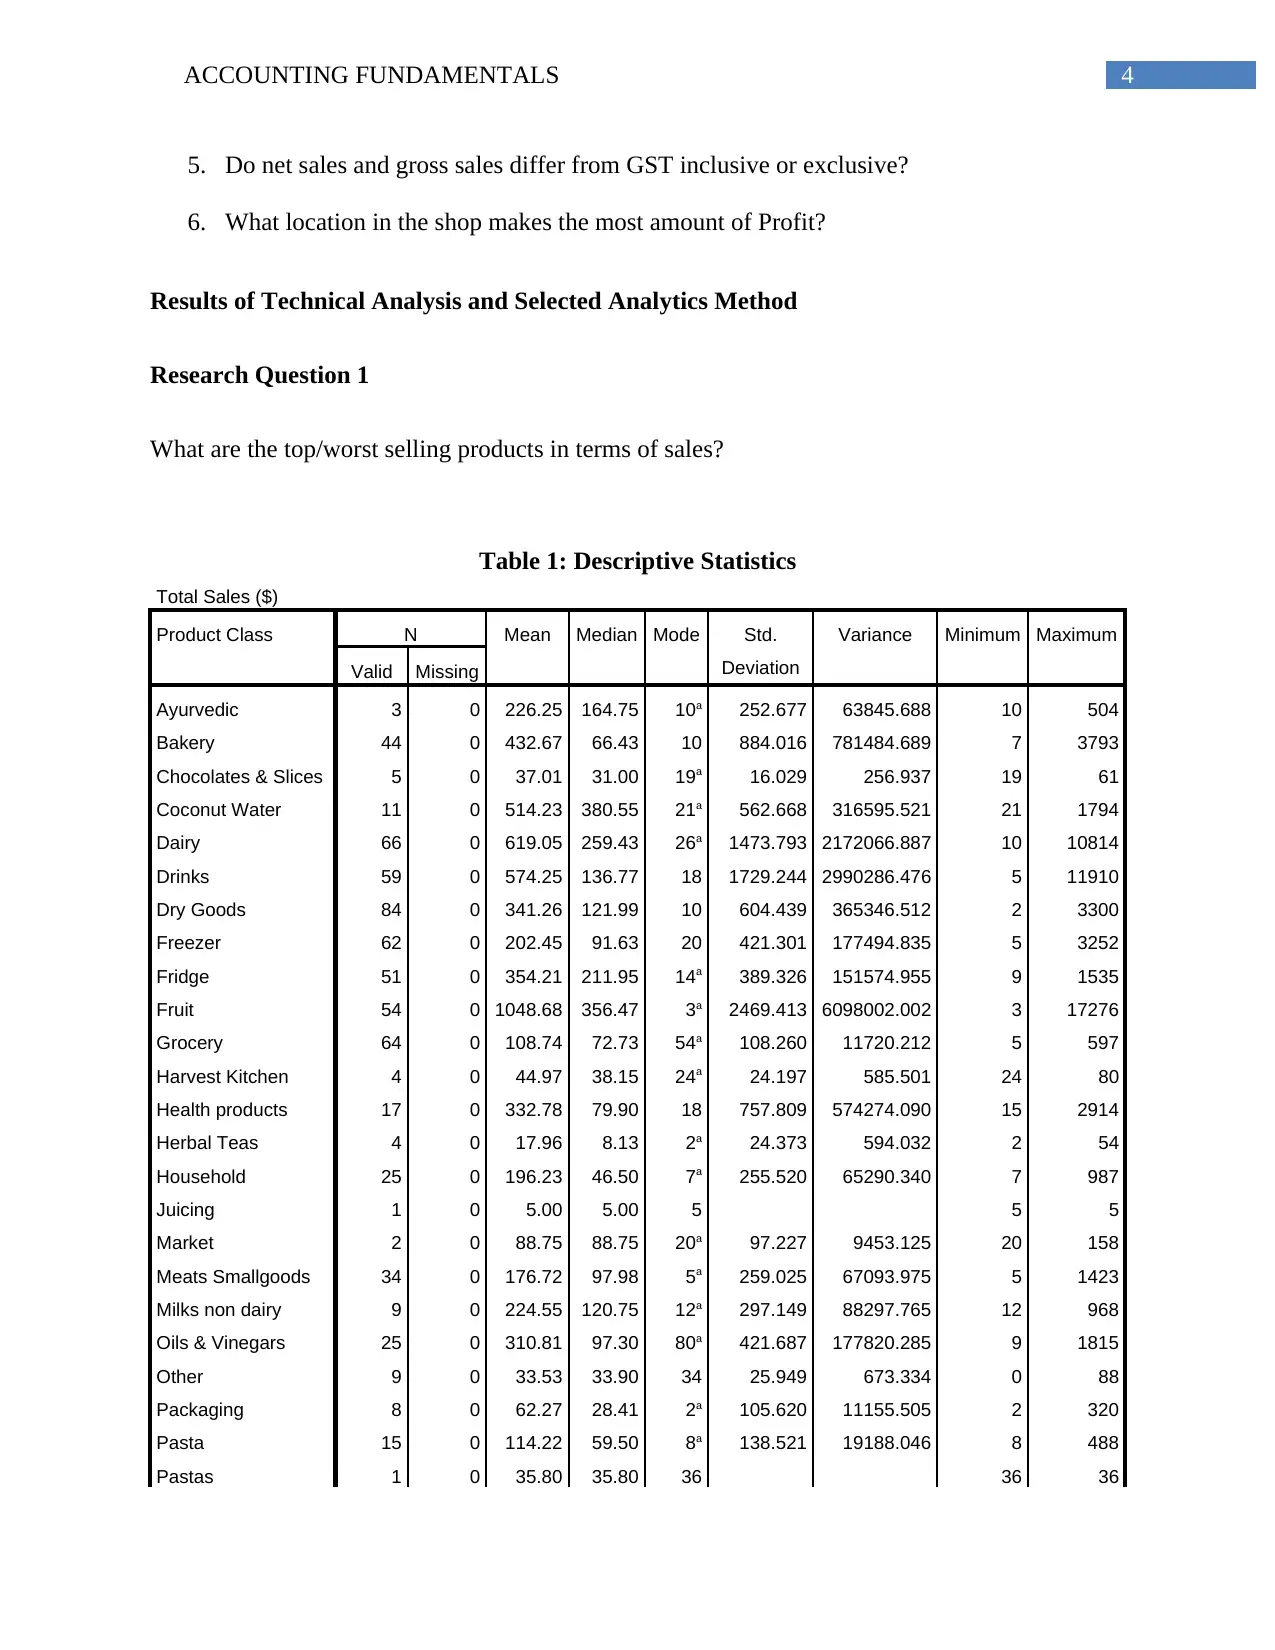
What are the top/worst selling products in terms of sales?
Table 1: Descriptive Statistics
Total Sales ($)
Product Class N Mean Median Mode Std.
Deviation
Variance Minimum Maximum
Valid Missing
Ayurvedic 3 0 226.25 164.75 10a 252.677 63845.688 10 504
Bakery 44 0 432.67 66.43 10 884.016 781484.689 7 3793
Chocolates & Slices 5 0 37.01 31.00 19a 16.029 256.937 19 61
Coconut Water 11 0 514.23 380.55 21a 562.668 316595.521 21 1794
Dairy 66 0 619.05 259.43 26a 1473.793 2172066.887 10 10814
Drinks 59 0 574.25 136.77 18 1729.244 2990286.476 5 11910
Dry Goods 84 0 341.26 121.99 10 604.439 365346.512 2 3300
Freezer 62 0 202.45 91.63 20 421.301 177494.835 5 3252
Fridge 51 0 354.21 211.95 14a 389.326 151574.955 9 1535
Fruit 54 0 1048.68 356.47 3a 2469.413 6098002.002 3 17276
Grocery 64 0 108.74 72.73 54a 108.260 11720.212 5 597
Harvest Kitchen 4 0 44.97 38.15 24a 24.197 585.501 24 80
Health products 17 0 332.78 79.90 18 757.809 574274.090 15 2914
Herbal Teas 4 0 17.96 8.13 2a 24.373 594.032 2 54
Household 25 0 196.23 46.50 7a 255.520 65290.340 7 987
Juicing 1 0 5.00 5.00 5 5 5
Market 2 0 88.75 88.75 20a 97.227 9453.125 20 158
Meats Smallgoods 34 0 176.72 97.98 5a 259.025 67093.975 5 1423
Milks non dairy 9 0 224.55 120.75 12a 297.149 88297.765 12 968
Oils & Vinegars 25 0 310.81 97.30 80a 421.687 177820.285 9 1815
Other 9 0 33.53 33.90 34 25.949 673.334 0 88
Packaging 8 0 62.27 28.41 2a 105.620 11155.505 2 320
Pasta 15 0 114.22 59.50 8a 138.521 19188.046 8 488
Pastas 1 0 35.80 35.80 36 36 36
5. Do net sales and gross sales differ from GST inclusive or exclusive?
6. What location in the shop makes the most amount of Profit?
Results of Technical Analysis and Selected Analytics Method
Research Question 1
What are the top/worst selling products in terms of sales?
Table 1: Descriptive Statistics
Total Sales ($)
Product Class N Mean Median Mode Std.
Deviation
Variance Minimum Maximum
Valid Missing
Ayurvedic 3 0 226.25 164.75 10a 252.677 63845.688 10 504
Bakery 44 0 432.67 66.43 10 884.016 781484.689 7 3793
Chocolates & Slices 5 0 37.01 31.00 19a 16.029 256.937 19 61
Coconut Water 11 0 514.23 380.55 21a 562.668 316595.521 21 1794
Dairy 66 0 619.05 259.43 26a 1473.793 2172066.887 10 10814
Drinks 59 0 574.25 136.77 18 1729.244 2990286.476 5 11910
Dry Goods 84 0 341.26 121.99 10 604.439 365346.512 2 3300
Freezer 62 0 202.45 91.63 20 421.301 177494.835 5 3252
Fridge 51 0 354.21 211.95 14a 389.326 151574.955 9 1535
Fruit 54 0 1048.68 356.47 3a 2469.413 6098002.002 3 17276
Grocery 64 0 108.74 72.73 54a 108.260 11720.212 5 597
Harvest Kitchen 4 0 44.97 38.15 24a 24.197 585.501 24 80
Health products 17 0 332.78 79.90 18 757.809 574274.090 15 2914
Herbal Teas 4 0 17.96 8.13 2a 24.373 594.032 2 54
Household 25 0 196.23 46.50 7a 255.520 65290.340 7 987
Juicing 1 0 5.00 5.00 5 5 5
Market 2 0 88.75 88.75 20a 97.227 9453.125 20 158
Meats Smallgoods 34 0 176.72 97.98 5a 259.025 67093.975 5 1423
Milks non dairy 9 0 224.55 120.75 12a 297.149 88297.765 12 968
Oils & Vinegars 25 0 310.81 97.30 80a 421.687 177820.285 9 1815
Other 9 0 33.53 33.90 34 25.949 673.334 0 88
Packaging 8 0 62.27 28.41 2a 105.620 11155.505 2 320
Pasta 15 0 114.22 59.50 8a 138.521 19188.046 8 488
Pastas 1 0 35.80 35.80 36 36 36
5ACCOUNTING FUNDAMENTALS
Personal Products 96 0 84.38 46.71 44 114.318 13068.525 2 676
Salad Greens 1 0 24.50 24.50 25 25 25
Snacks 2 0 20.33 20.33 20a .742 .551 20 21
Snacks &
Chocolates 110 0 246.14 78.00 14 481.385 231731.518 4 2972
Spices 14 0 18.99 11.40 8 32.060 1027.817 4 129
Spreads, Sauces,
Sweeteners 28 0 113.60 25.53 7a 296.333 87813.485 6 1310
Stocks Sauces 6 0 32.29 30.28 20 12.168 148.064 20 49
Tea Coffee 24 0 88.55 29.55 5 147.157 21655.100 5 583
Tinned Goods 8 0 48.09 44.32 6a 32.507 1056.731 6 109
Vegetable 76 0 871.49 271.33 4a 1226.302 1503816.938 4 5554
Water 12 0 1866.88 446.25 630a 2541.630 6459885.188 15 6500
a. Multiple modes exist. The smallest value is shown
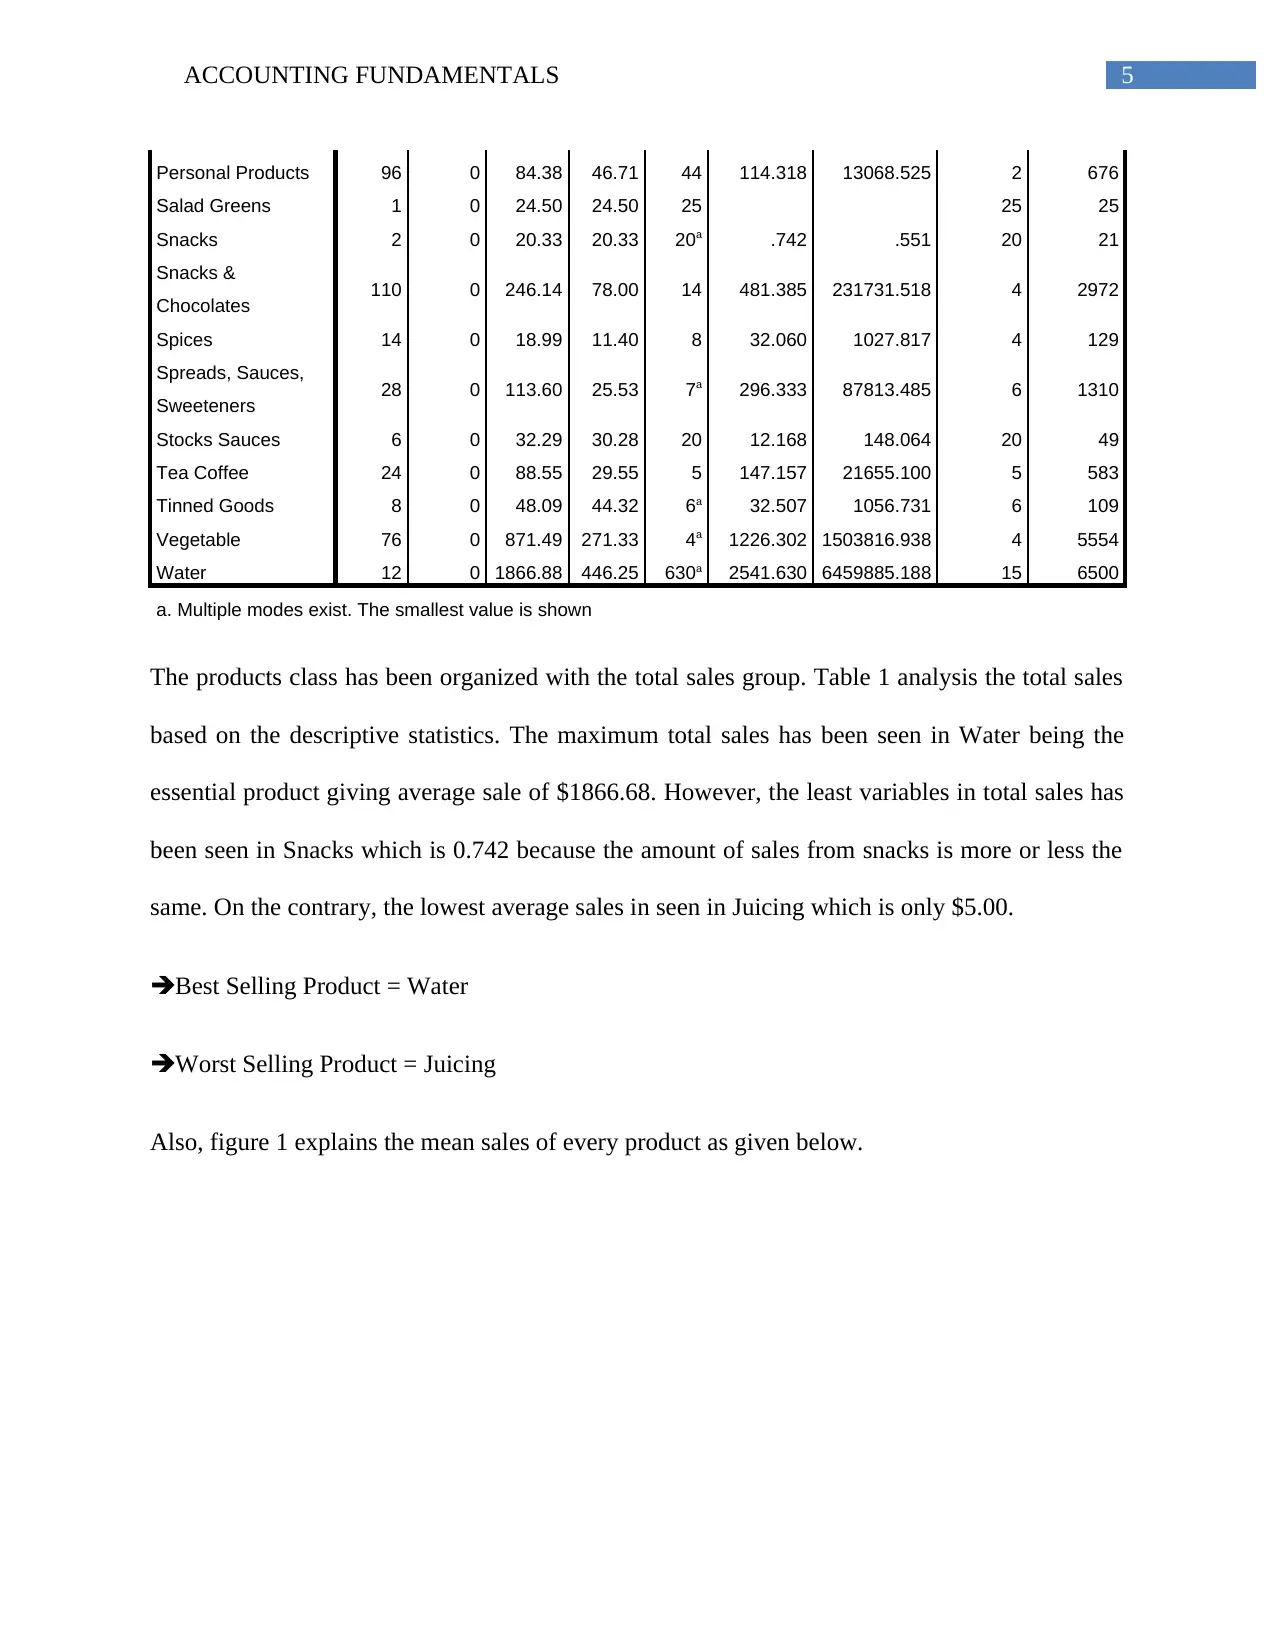
The products class has been organized with the total sales group. Table 1 analysis the total sales
based on the descriptive statistics. The maximum total sales has been seen in Water being the
essential product giving average sale of $1866.68. However, the least variables in total sales has
been seen in Snacks which is 0.742 because the amount of sales from snacks is more or less the
same. On the contrary, the lowest average sales in seen in Juicing which is only $5.00.
Best Selling Product = Water
Worst Selling Product = Juicing
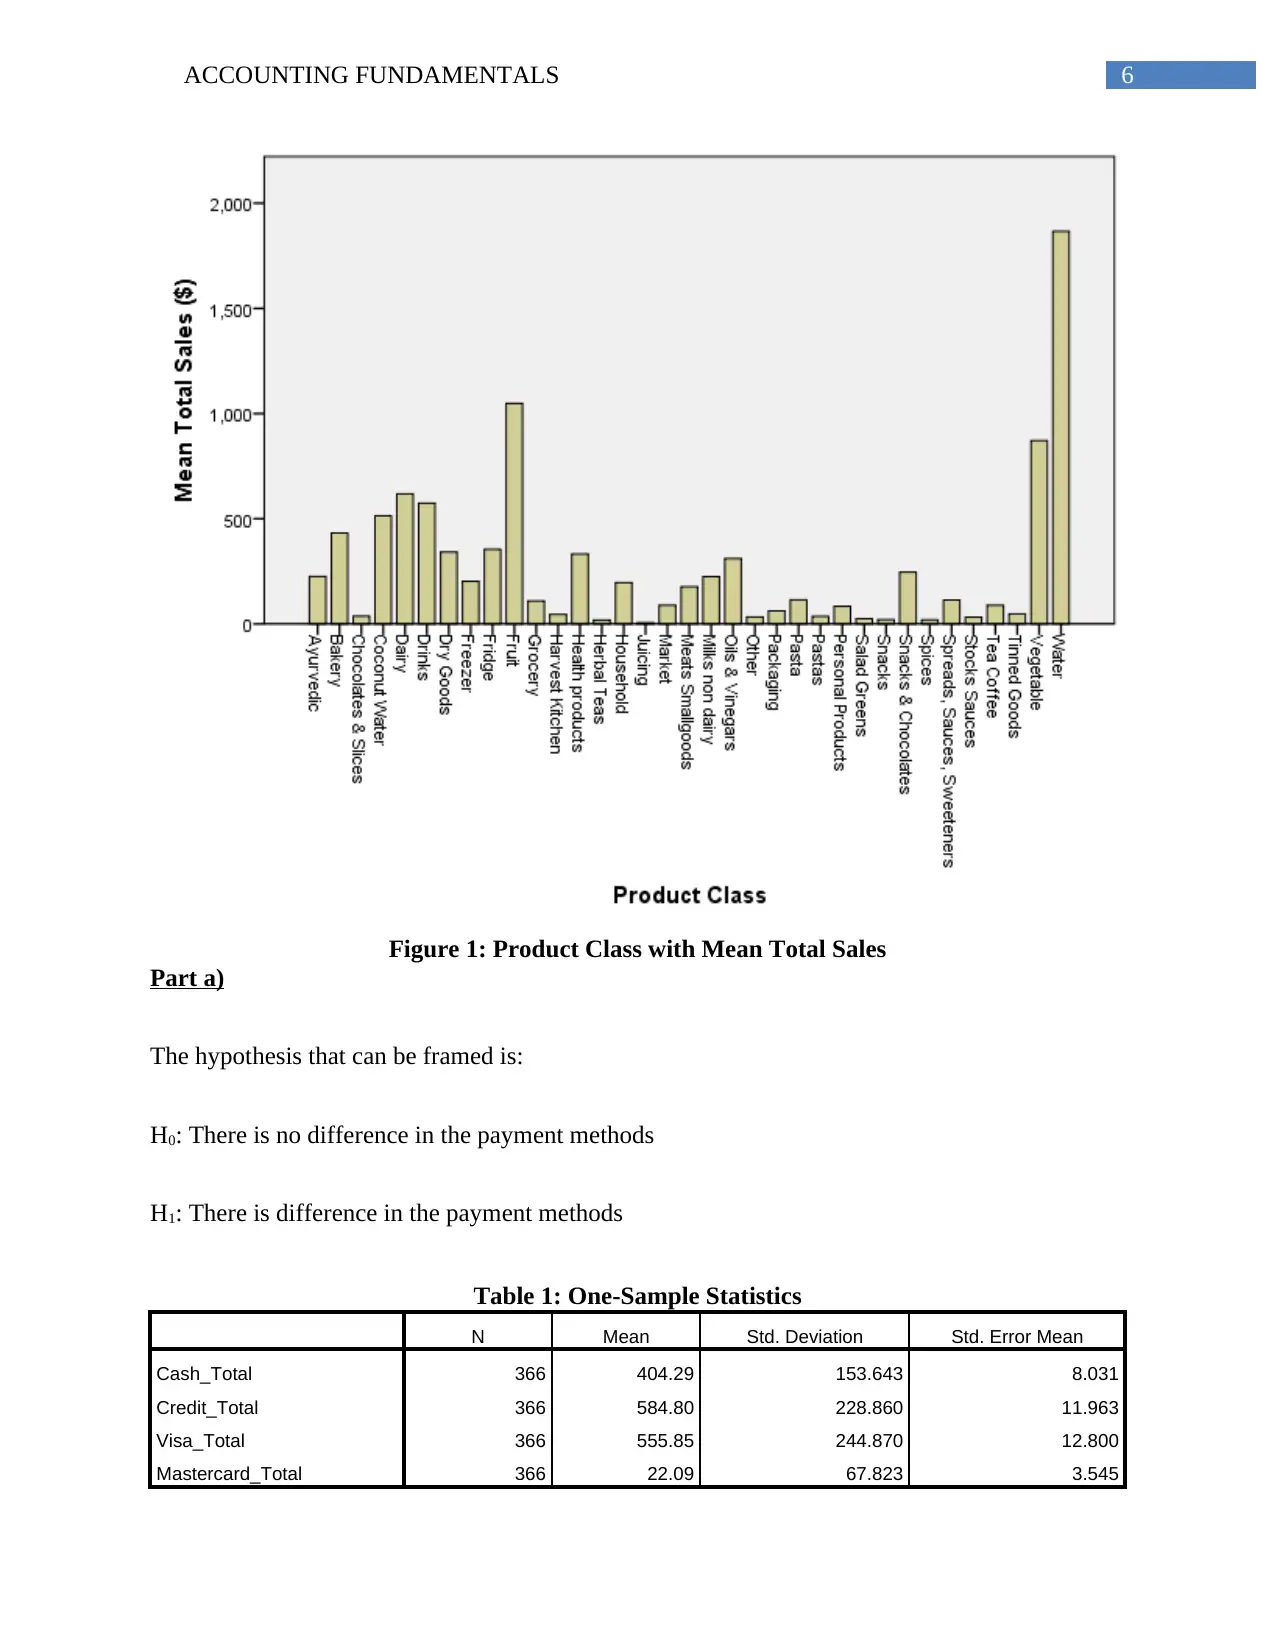
Also, figure 1 explains the mean sales of every product as given below.
Personal Products 96 0 84.38 46.71 44 114.318 13068.525 2 676
Salad Greens 1 0 24.50 24.50 25 25 25
Snacks 2 0 20.33 20.33 20a .742 .551 20 21
Snacks &
Chocolates 110 0 246.14 78.00 14 481.385 231731.518 4 2972
Spices 14 0 18.99 11.40 8 32.060 1027.817 4 129
Spreads, Sauces,
Sweeteners 28 0 113.60 25.53 7a 296.333 87813.485 6 1310
Stocks Sauces 6 0 32.29 30.28 20 12.168 148.064 20 49
Tea Coffee 24 0 88.55 29.55 5 147.157 21655.100 5 583
Tinned Goods 8 0 48.09 44.32 6a 32.507 1056.731 6 109
Vegetable 76 0 871.49 271.33 4a 1226.302 1503816.938 4 5554
Water 12 0 1866.88 446.25 630a 2541.630 6459885.188 15 6500
a. Multiple modes exist. The smallest value is shown
The products class has been organized with the total sales group. Table 1 analysis the total sales
based on the descriptive statistics. The maximum total sales has been seen in Water being the
essential product giving average sale of $1866.68. However, the least variables in total sales has
been seen in Snacks which is 0.742 because the amount of sales from snacks is more or less the
same. On the contrary, the lowest average sales in seen in Juicing which is only $5.00.
Best Selling Product = Water
Worst Selling Product = Juicing
Also, figure 1 explains the mean sales of every product as given below.
⊘ This is a preview!⊘
Do you want full access?
Subscribe today to unlock all pages.
Trusted by 1+ million students worldwide
6ACCOUNTING FUNDAMENTALS
Figure 1: Product Class with Mean Total Sales
Part a)
The hypothesis that can be framed is:
H0: There is no difference in the payment methods
H1: There is difference in the payment methods
Table 1: One-Sample Statistics
N Mean Std. Deviation Std. Error Mean
Cash_Total 366 404.29 153.643 8.031
Credit_Total 366 584.80 228.860 11.963
Visa_Total 366 555.85 244.870 12.800
Mastercard_Total 366 22.09 67.823 3.545
Paraphrase This Document
Need a fresh take? Get an instant paraphrase of this document with our AI Paraphraser
7ACCOUNTING FUNDAMENTALS
Table 3: One-Sample Test
Test Value = 0
t df Sig. (2-tailed) Mean Difference 95% Confidence Interval of the
Difference
Lower Upper
Cash_Total 50.340 365 .000 404.287 388.49 420.08
Credit_Total 48.885 365 .000 584.798 561.27 608.32
Visa_Total 43.427 365 .000 555.849 530.68 581.02
Mastercard_Total 6.232 365 .000 22.094 15.12 29.07
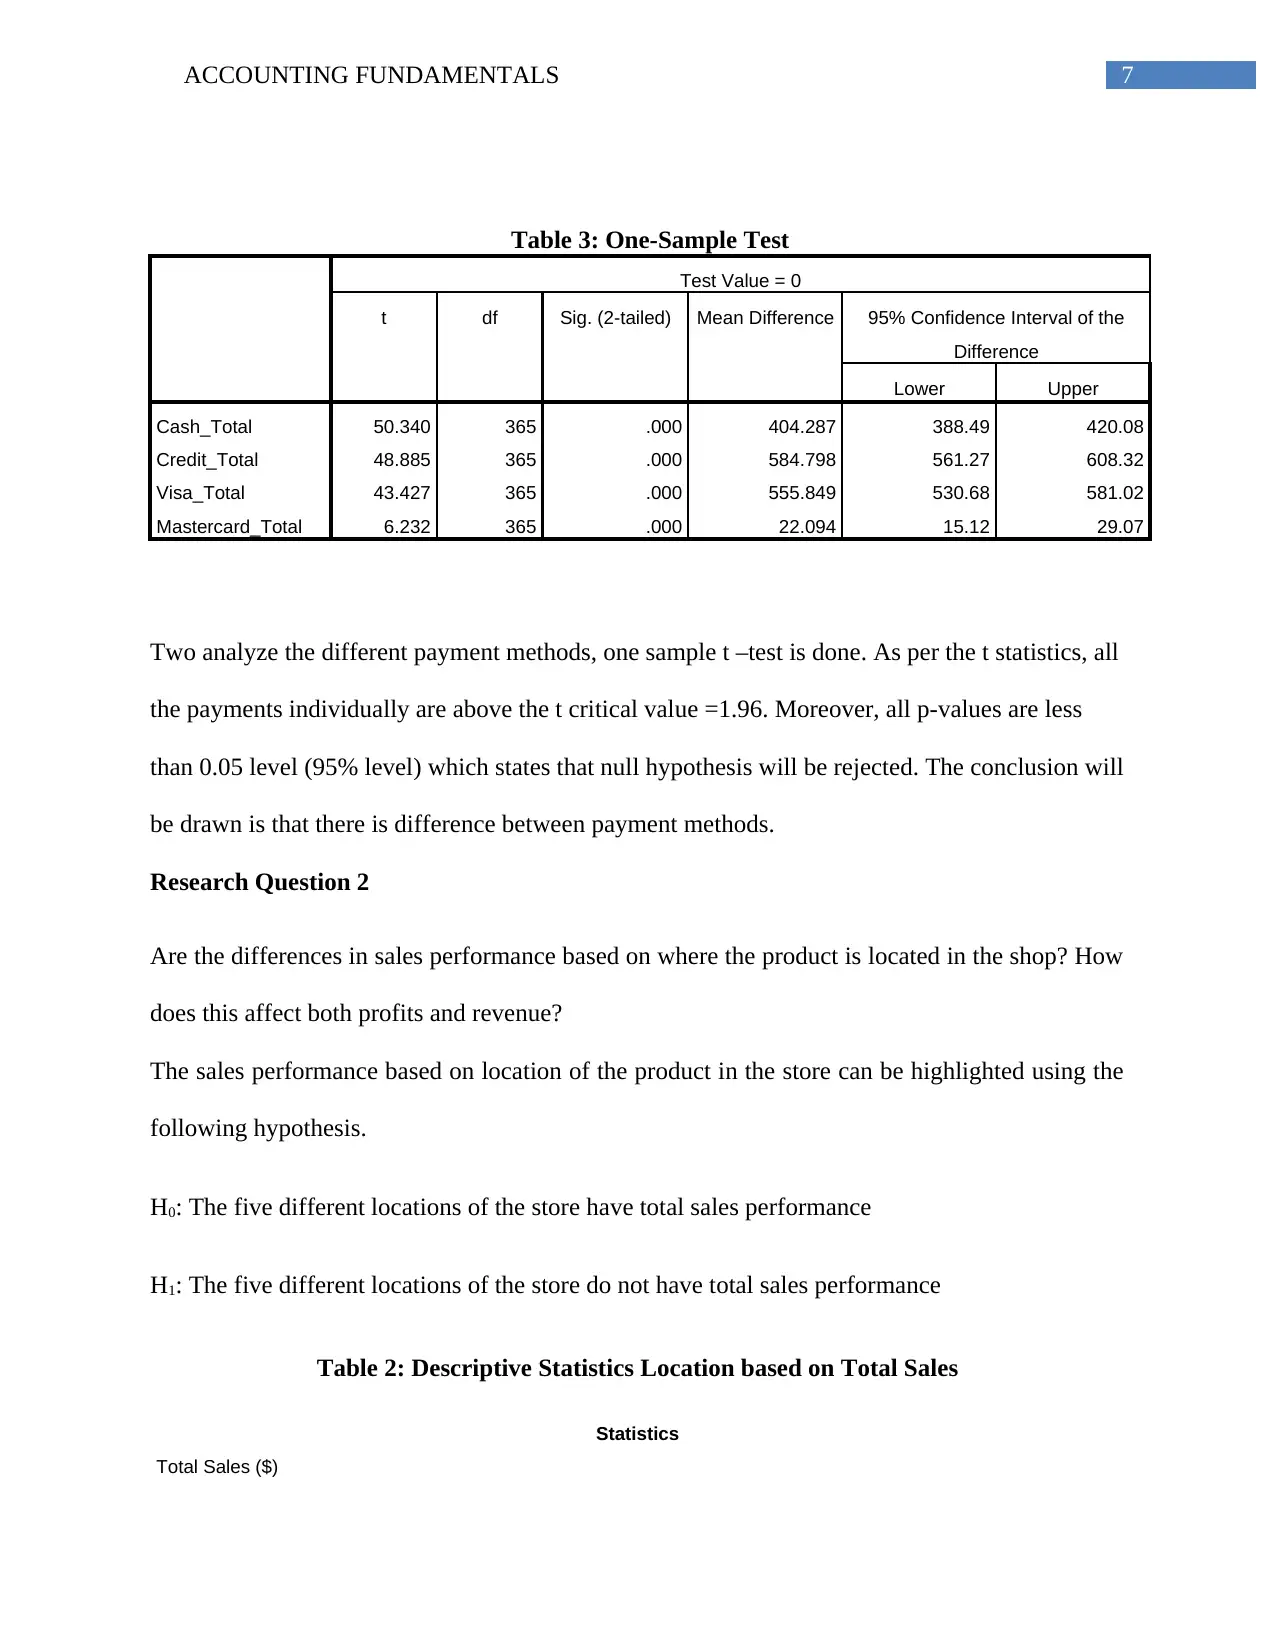
Two analyze the different payment methods, one sample t –test is done. As per the t statistics, all
the payments individually are above the t critical value =1.96. Moreover, all p-values are less
than 0.05 level (95% level) which states that null hypothesis will be rejected. The conclusion will
be drawn is that there is difference between payment methods.
Research Question 2
Are the differences in sales performance based on where the product is located in the shop? How
does this affect both profits and revenue?
The sales performance based on location of the product in the store can be highlighted using the
following hypothesis.
H0: The five different locations of the store have total sales performance
H1: The five different locations of the store do not have total sales performance
Table 2: Descriptive Statistics Location based on Total Sales
Statistics
Total Sales ($)
Table 3: One-Sample Test
Test Value = 0
t df Sig. (2-tailed) Mean Difference 95% Confidence Interval of the
Difference
Lower Upper
Cash_Total 50.340 365 .000 404.287 388.49 420.08
Credit_Total 48.885 365 .000 584.798 561.27 608.32
Visa_Total 43.427 365 .000 555.849 530.68 581.02
Mastercard_Total 6.232 365 .000 22.094 15.12 29.07
Two analyze the different payment methods, one sample t –test is done. As per the t statistics, all
the payments individually are above the t critical value =1.96. Moreover, all p-values are less
than 0.05 level (95% level) which states that null hypothesis will be rejected. The conclusion will
be drawn is that there is difference between payment methods.
Research Question 2
Are the differences in sales performance based on where the product is located in the shop? How
does this affect both profits and revenue?
The sales performance based on location of the product in the store can be highlighted using the
following hypothesis.
H0: The five different locations of the store have total sales performance
H1: The five different locations of the store do not have total sales performance
Table 2: Descriptive Statistics Location based on Total Sales
Statistics
Total Sales ($)
8ACCOUNTING FUNDAMENTALS
Location of product
in shop
N Mean Median Mode Std.
Deviation
Variance Minimum Maximum
Valid Missing
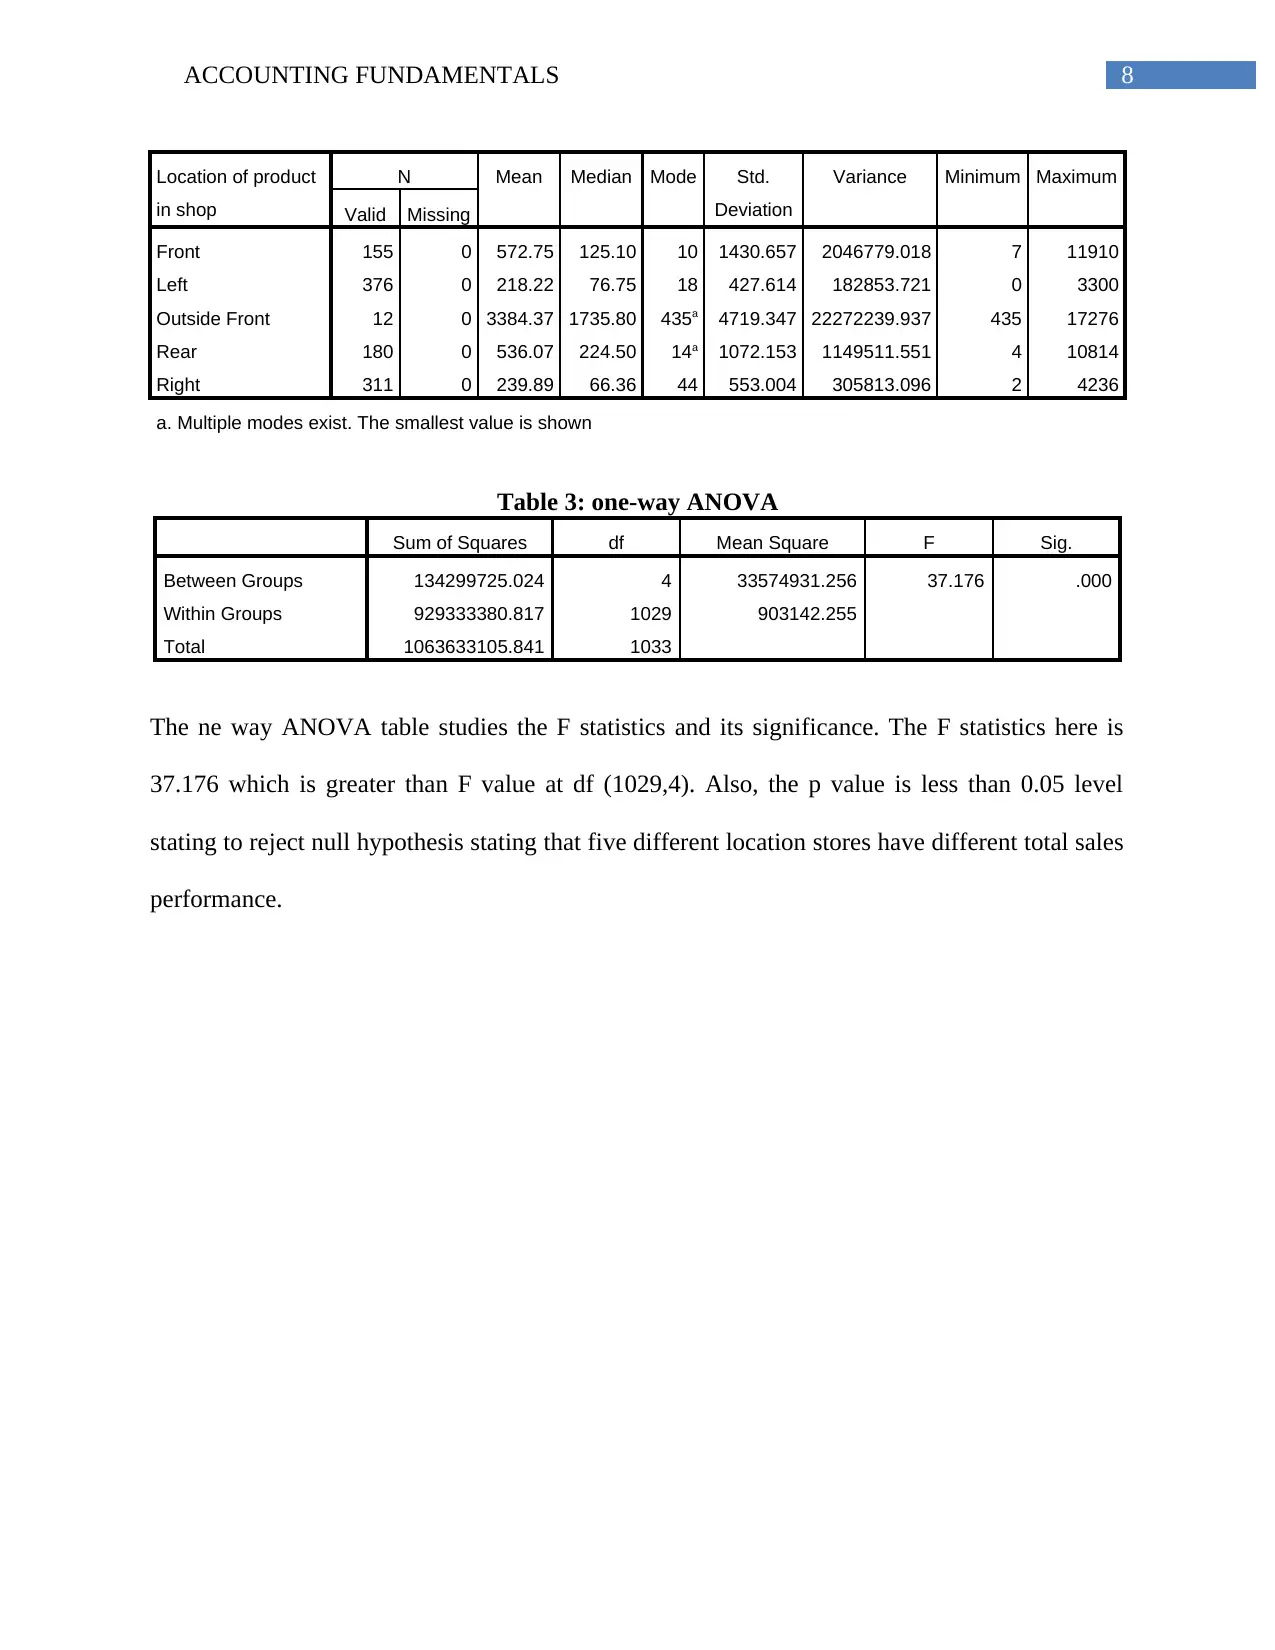
Front 155 0 572.75 125.10 10 1430.657 2046779.018 7 11910
Left 376 0 218.22 76.75 18 427.614 182853.721 0 3300
Outside Front 12 0 3384.37 1735.80 435a 4719.347 22272239.937 435 17276
Rear 180 0 536.07 224.50 14a 1072.153 1149511.551 4 10814
Right 311 0 239.89 66.36 44 553.004 305813.096 2 4236
a. Multiple modes exist. The smallest value is shown
Table 3: one-way ANOVA
Sum of Squares df Mean Square F Sig.
Between Groups 134299725.024 4 33574931.256 37.176 .000
Within Groups 929333380.817 1029 903142.255
Total 1063633105.841 1033
The ne way ANOVA table studies the F statistics and its significance. The F statistics here is
37.176 which is greater than F value at df (1029,4). Also, the p value is less than 0.05 level
stating to reject null hypothesis stating that five different location stores have different total sales
performance.
Location of product
in shop
N Mean Median Mode Std.
Deviation
Variance Minimum Maximum
Valid Missing
Front 155 0 572.75 125.10 10 1430.657 2046779.018 7 11910
Left 376 0 218.22 76.75 18 427.614 182853.721 0 3300
Outside Front 12 0 3384.37 1735.80 435a 4719.347 22272239.937 435 17276
Rear 180 0 536.07 224.50 14a 1072.153 1149511.551 4 10814
Right 311 0 239.89 66.36 44 553.004 305813.096 2 4236
a. Multiple modes exist. The smallest value is shown
Table 3: one-way ANOVA
Sum of Squares df Mean Square F Sig.
Between Groups 134299725.024 4 33574931.256 37.176 .000
Within Groups 929333380.817 1029 903142.255
Total 1063633105.841 1033
The ne way ANOVA table studies the F statistics and its significance. The F statistics here is
37.176 which is greater than F value at df (1029,4). Also, the p value is less than 0.05 level
stating to reject null hypothesis stating that five different location stores have different total sales
performance.
⊘ This is a preview!⊘
Do you want full access?
Subscribe today to unlock all pages.
Trusted by 1+ million students worldwide
9ACCOUNTING FUNDAMENTALS
Table 4: Multiple Comparisons
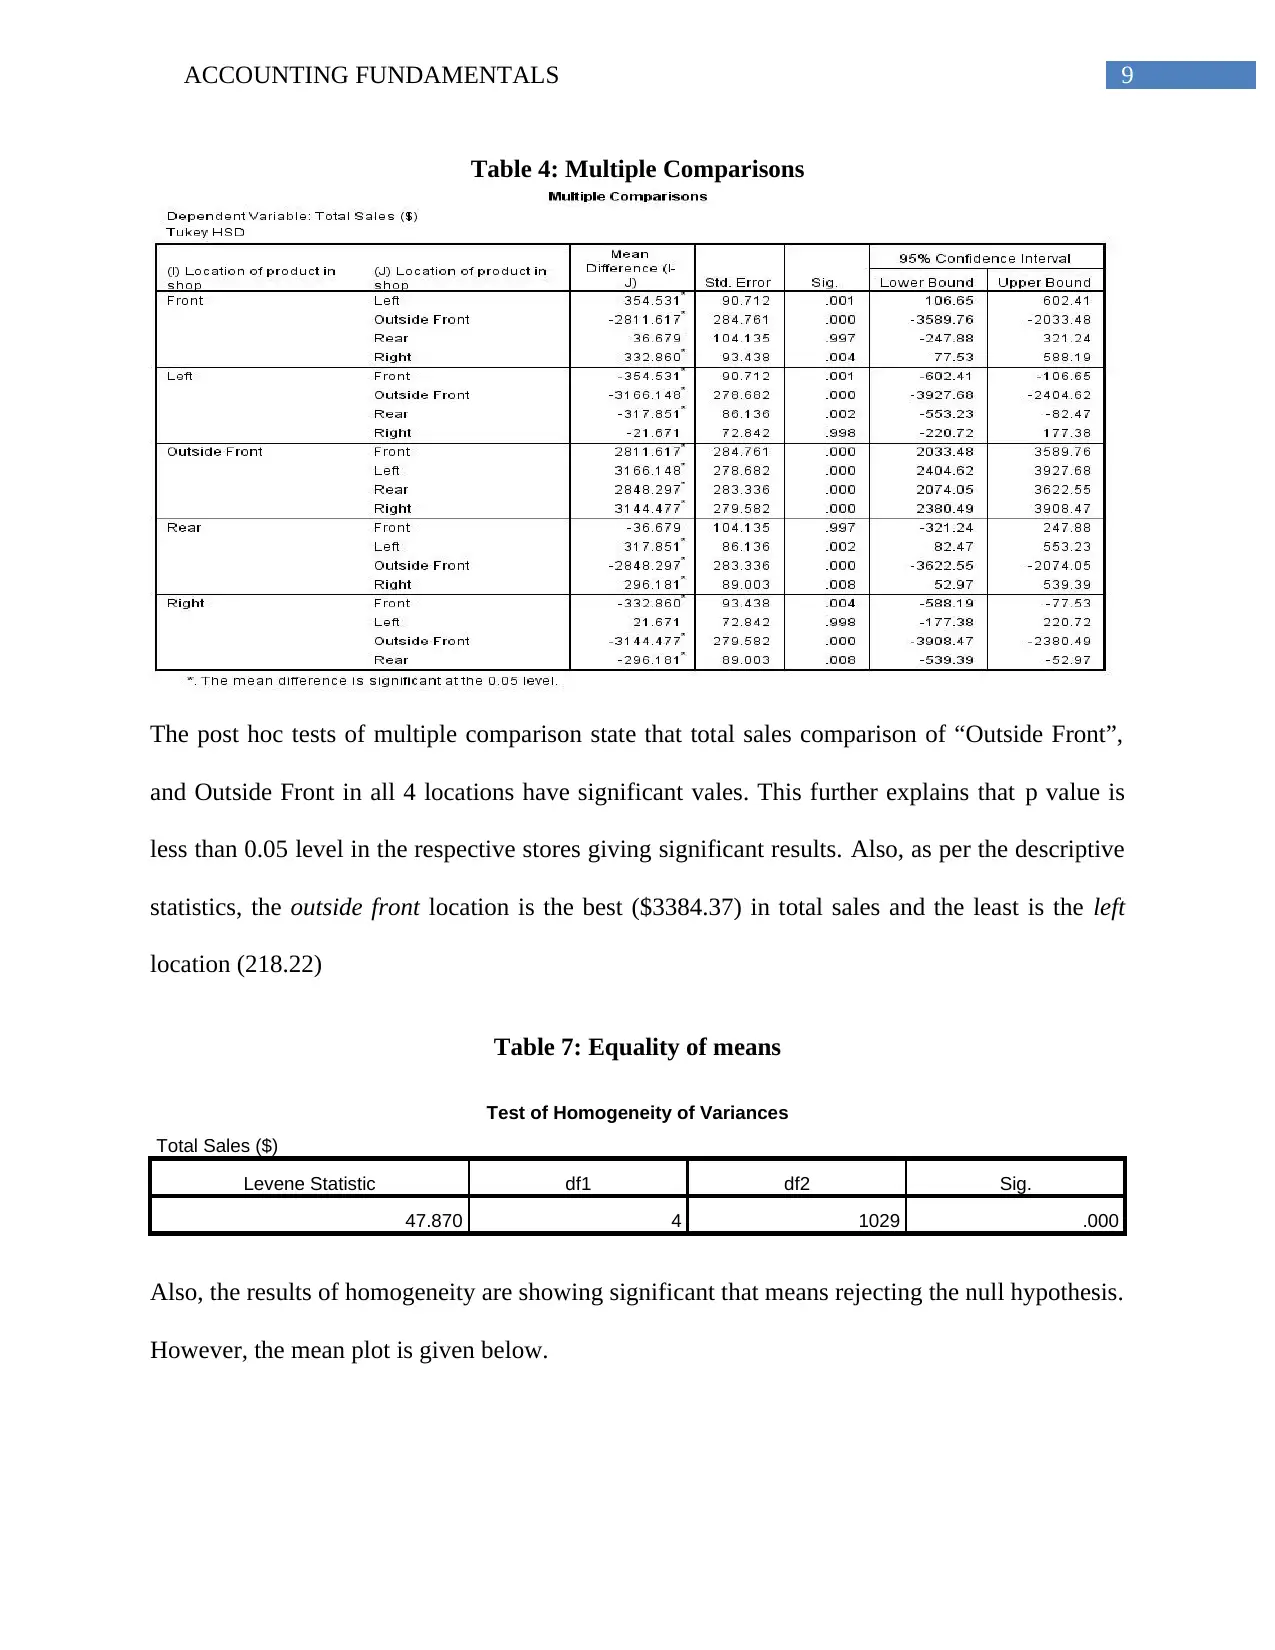
The post hoc tests of multiple comparison state that total sales comparison of “Outside Front”,
and Outside Front in all 4 locations have significant vales. This further explains that p value is
less than 0.05 level in the respective stores giving significant results. Also, as per the descriptive
statistics, the outside front location is the best ($3384.37) in total sales and the least is the left
location (218.22)
Table 7: Equality of means
Test of Homogeneity of Variances
Total Sales ($)
Levene Statistic df1 df2 Sig.
47.870 4 1029 .000
Also, the results of homogeneity are showing significant that means rejecting the null hypothesis.
However, the mean plot is given below.
Table 4: Multiple Comparisons
The post hoc tests of multiple comparison state that total sales comparison of “Outside Front”,
and Outside Front in all 4 locations have significant vales. This further explains that p value is
less than 0.05 level in the respective stores giving significant results. Also, as per the descriptive
statistics, the outside front location is the best ($3384.37) in total sales and the least is the left
location (218.22)
Table 7: Equality of means
Test of Homogeneity of Variances
Total Sales ($)
Levene Statistic df1 df2 Sig.
47.870 4 1029 .000
Also, the results of homogeneity are showing significant that means rejecting the null hypothesis.
However, the mean plot is given below.
Paraphrase This Document
Need a fresh take? Get an instant paraphrase of this document with our AI Paraphraser
10ACCOUNTING FUNDAMENTALS
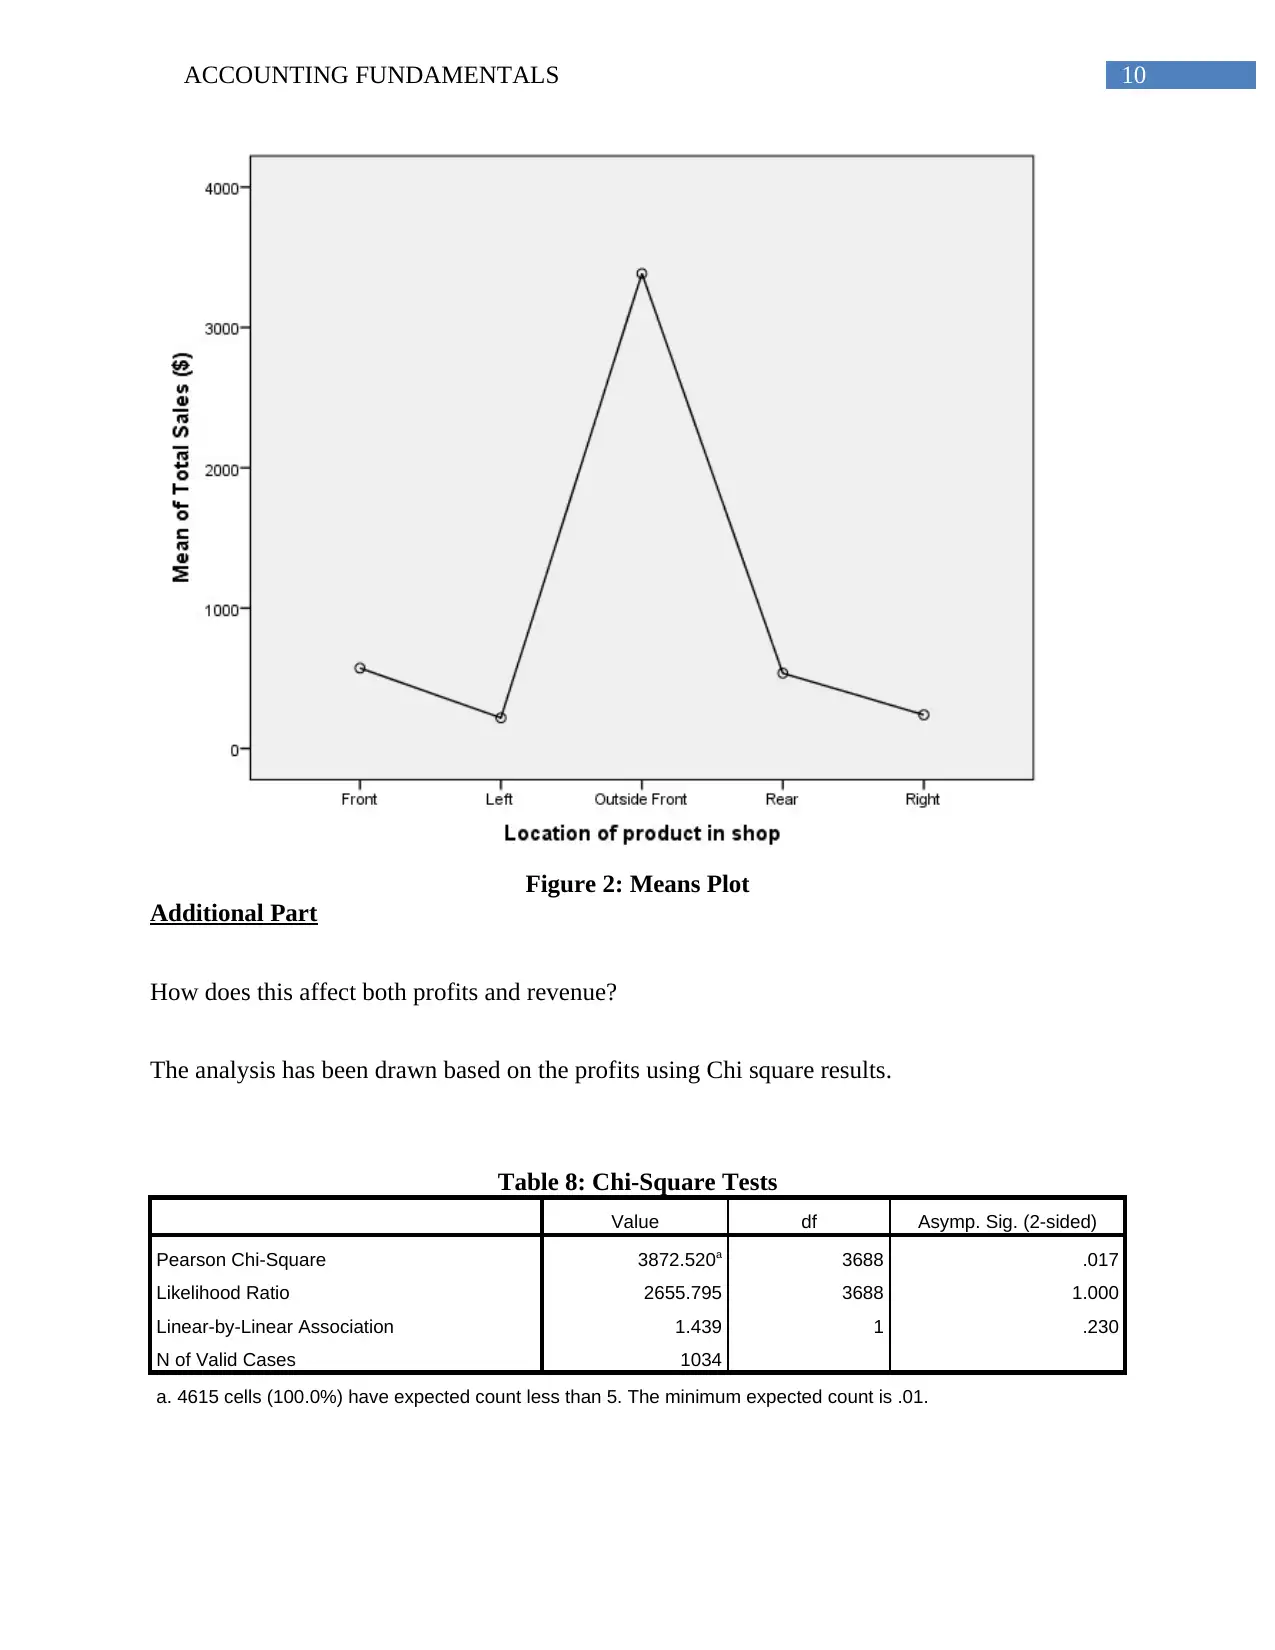
Figure 2: Means Plot
Additional Part
How does this affect both profits and revenue?
The analysis has been drawn based on the profits using Chi square results.
Table 8: Chi-Square Tests
Value df Asymp. Sig. (2-sided)
Pearson Chi-Square 3872.520a 3688 .017
Likelihood Ratio 2655.795 3688 1.000
Linear-by-Linear Association 1.439 1 .230
N of Valid Cases 1034
a. 4615 cells (100.0%) have expected count less than 5. The minimum expected count is .01.
11ACCOUNTING FUNDAMENTALS
The chi square results show that the results are 3872.520 significant based on the asymptotic
result which is 0.017 which is less than 0.05 levels. Also, this means that the results of location
of store on profits are significant.
Research Question 3
Is there a difference in sales and gross profits between different months of the year?
The hypothesis framed is:
H0: There is no association between gross sales, profits and between different months
H1: There is an association between gross sales, profits and between different months
Table 5: Regression Coefficients
Model Unstandardized Coefficients Standardized
Coefficients
t Sig.
B Std. Error Beta
1
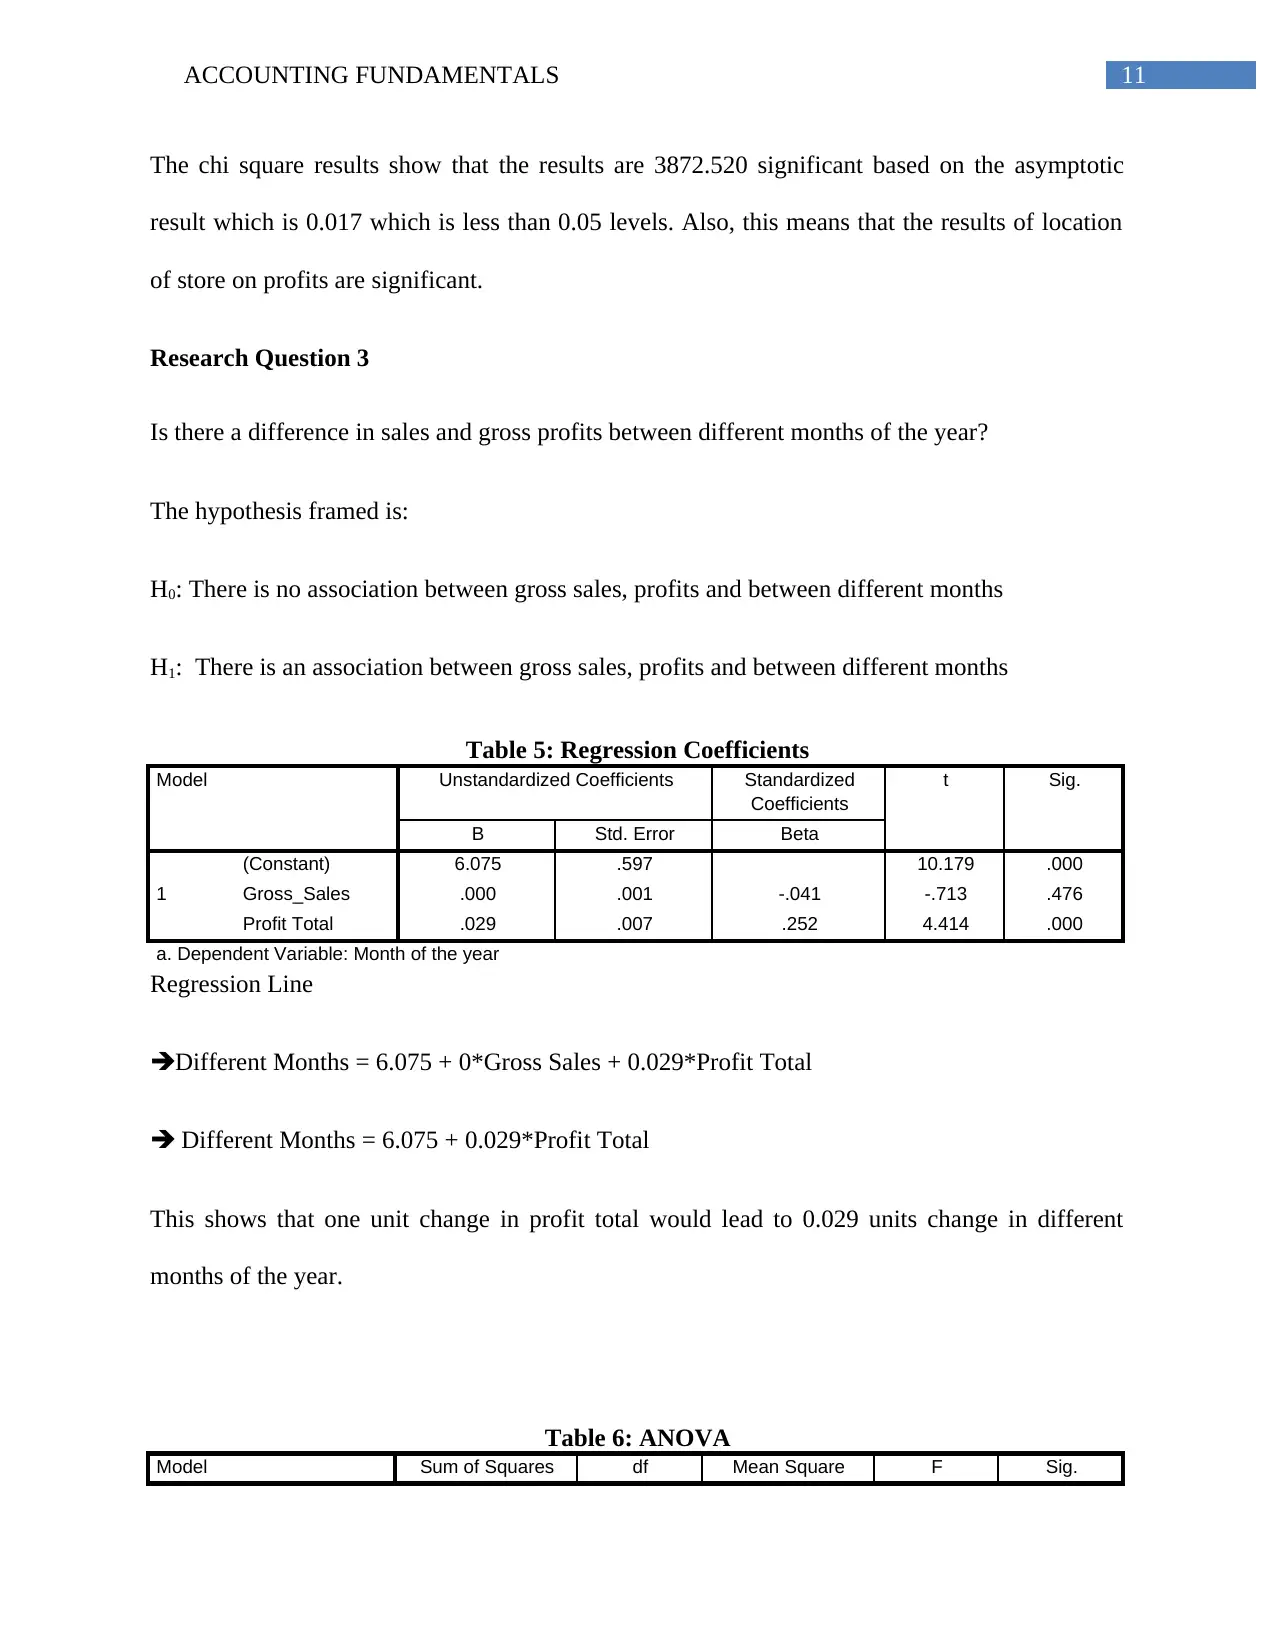
(Constant) 6.075 .597 10.179 .000
Gross_Sales .000 .001 -.041 -.713 .476
Profit Total .029 .007 .252 4.414 .000
a. Dependent Variable: Month of the year
Regression Line
Different Months = 6.075 + 0*Gross Sales + 0.029*Profit Total
Different Months = 6.075 + 0.029*Profit Total
This shows that one unit change in profit total would lead to 0.029 units change in different
months of the year.
Table 6: ANOVA
Model Sum of Squares df Mean Square F Sig.
The chi square results show that the results are 3872.520 significant based on the asymptotic
result which is 0.017 which is less than 0.05 levels. Also, this means that the results of location
of store on profits are significant.
Research Question 3
Is there a difference in sales and gross profits between different months of the year?
The hypothesis framed is:
H0: There is no association between gross sales, profits and between different months
H1: There is an association between gross sales, profits and between different months
Table 5: Regression Coefficients
Model Unstandardized Coefficients Standardized
Coefficients
t Sig.
B Std. Error Beta
1
(Constant) 6.075 .597 10.179 .000
Gross_Sales .000 .001 -.041 -.713 .476
Profit Total .029 .007 .252 4.414 .000
a. Dependent Variable: Month of the year
Regression Line
Different Months = 6.075 + 0*Gross Sales + 0.029*Profit Total
Different Months = 6.075 + 0.029*Profit Total
This shows that one unit change in profit total would lead to 0.029 units change in different
months of the year.
Table 6: ANOVA
Model Sum of Squares df Mean Square F Sig.
⊘ This is a preview!⊘
Do you want full access?
Subscribe today to unlock all pages.
Trusted by 1+ million students worldwide
1 out of 18
Related Documents


Your All-in-One AI-Powered Toolkit for Academic Success.
+13062052269
info@desklib.com
Available 24*7 on WhatsApp / Email
![[object Object]](/_next/static/media/star-bottom.7253800d.svg)
Unlock your academic potential
Copyright © 2020–2026 A2Z Services. All Rights Reserved. Developed and managed by ZUCOL.