Business Decision Making Task 3: Sales and Profit Presentation
VerifiedAdded on 2023/04/17
|11
|468
|59
Project
AI Summary
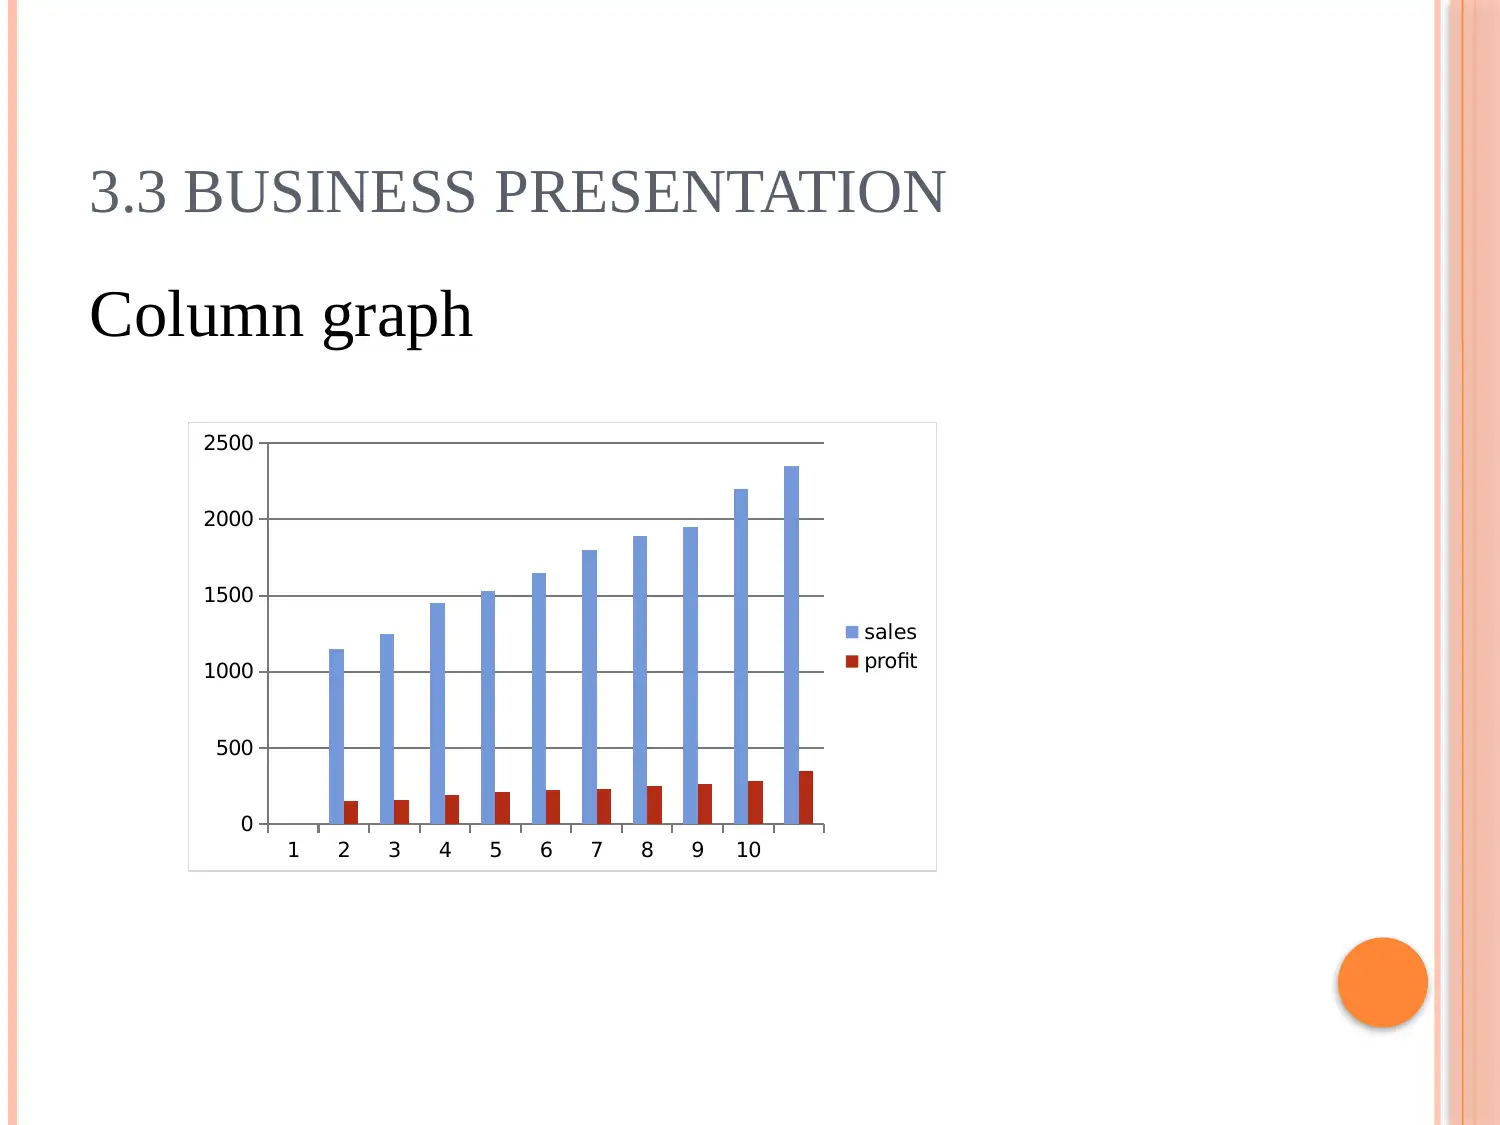
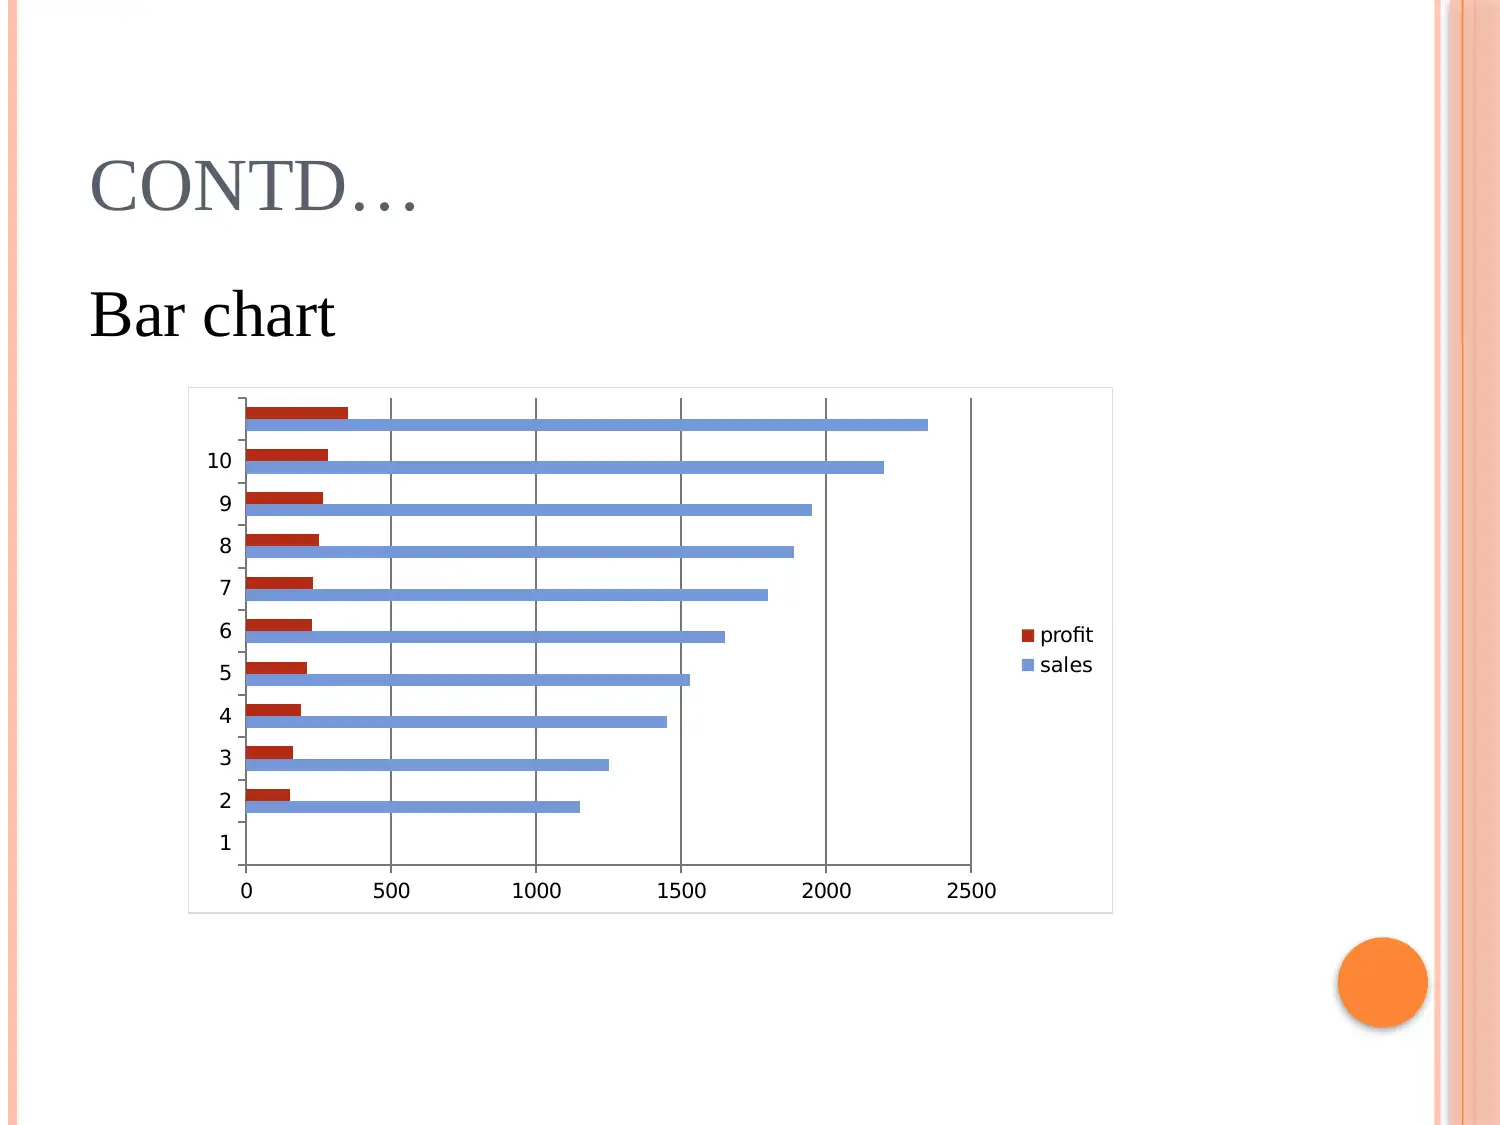
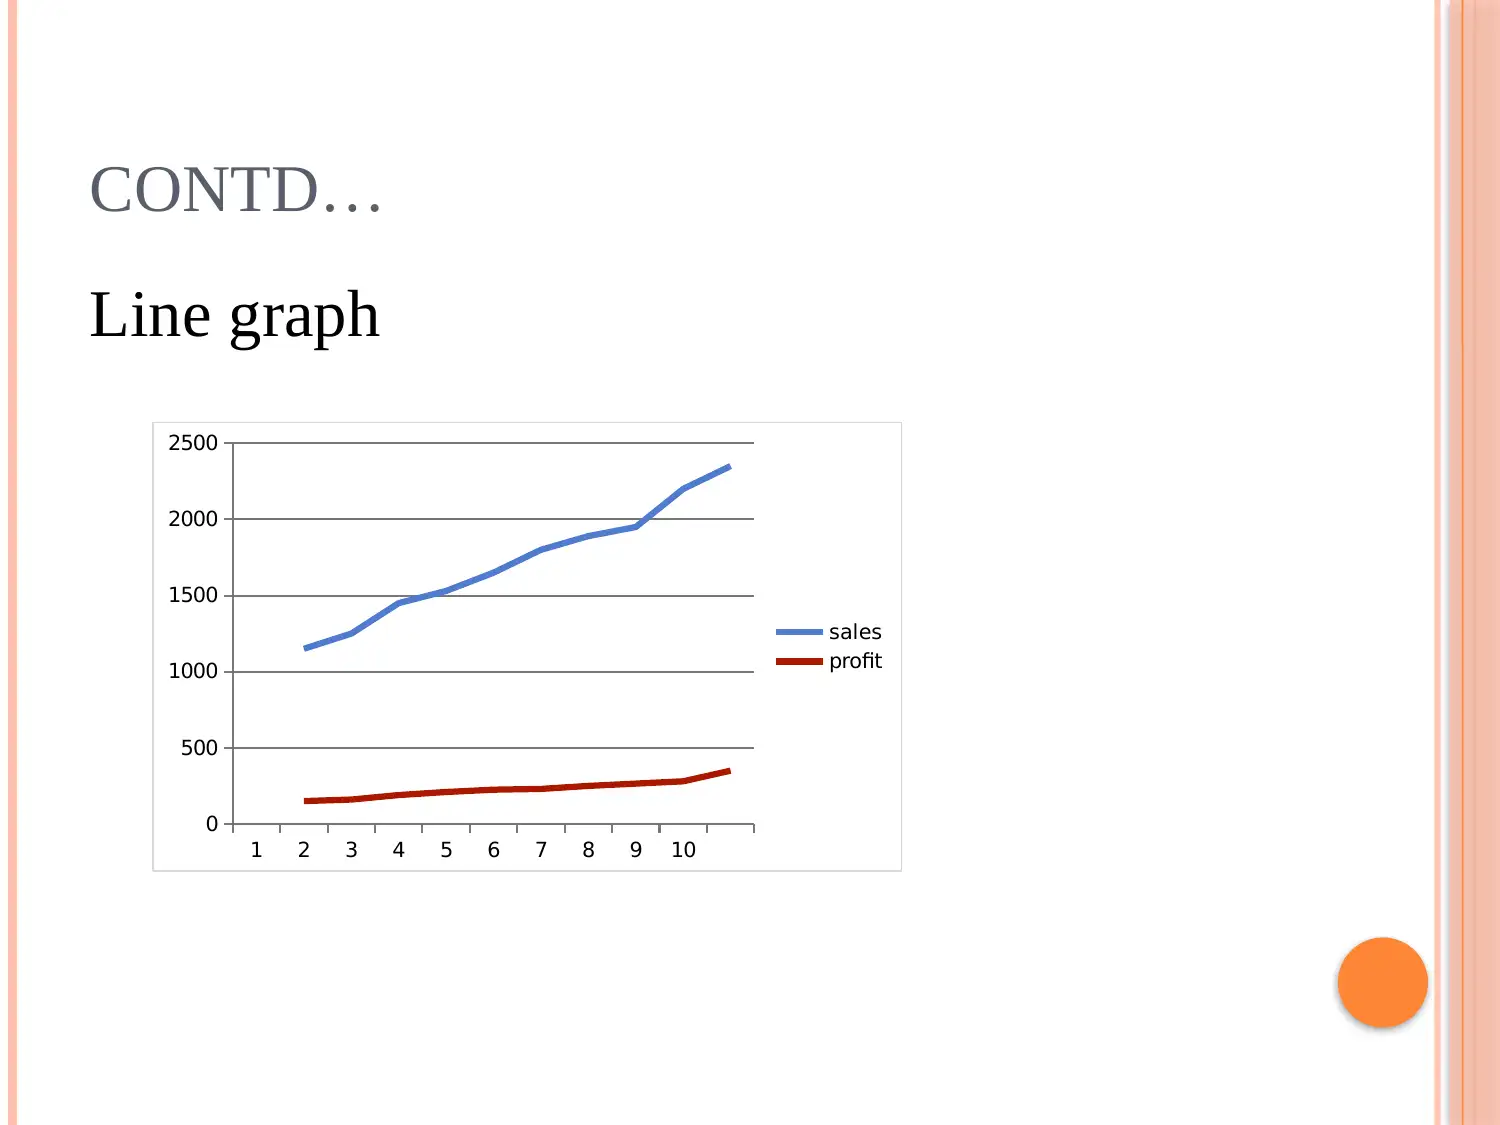
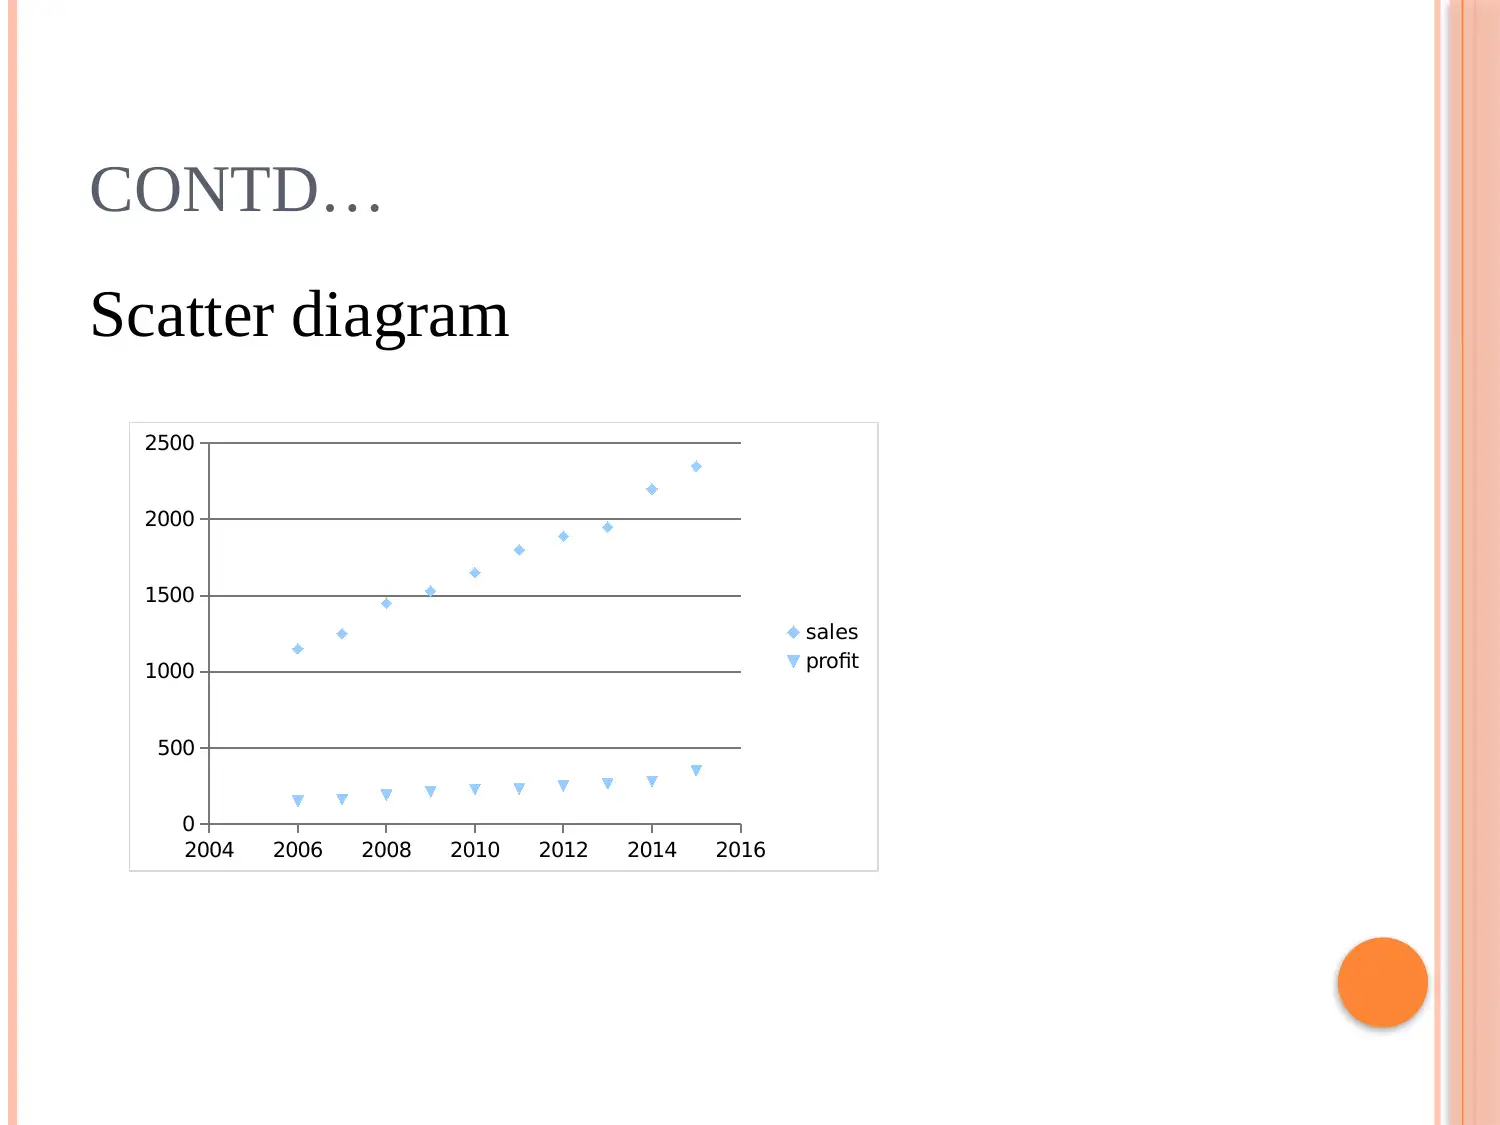
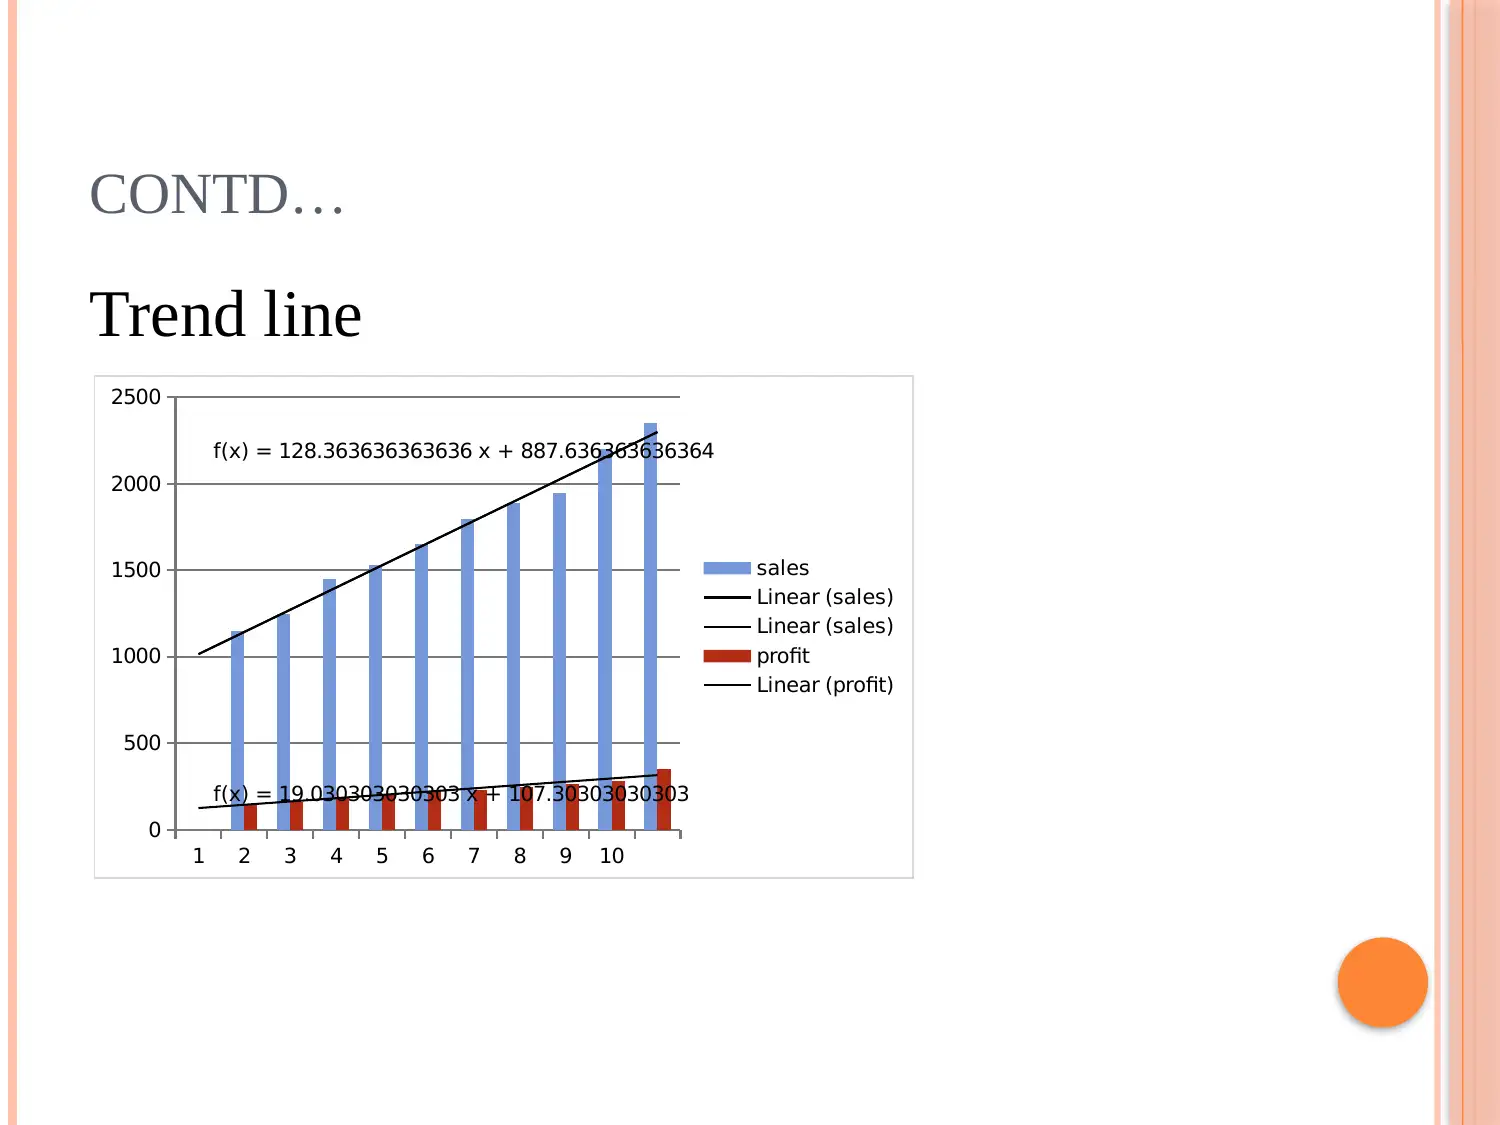
This project is a business presentation analyzing sales and profit data over a 10-year period. It utilizes various charts and graphs, including column, bar, line, and scatter diagrams, to illustrate sales and profit trends. The presentation highlights the continuous increase in sales and profit margins, particularly noting specific sales figures and profit growth. It emphasizes the success of the business in attracting customers and suggests strategies for further growth, such as developing unique tour packages to attract existing and potential customers. Trend lines are used to project future sales and profit increases, and the importance of customer loyalty is discussed. The document concludes with a list of cited references.
1 out of 11
Related Documents


Your All-in-One AI-Powered Toolkit for Academic Success.
+13062052269
info@desklib.com
Available 24*7 on WhatsApp / Email
![[object Object]](/_next/static/media/star-bottom.7253800d.svg)
Copyright © 2020–2026 A2Z Services. All Rights Reserved. Developed and managed by ZUCOL.