Business Decision Making Report: Analysis of Sales and Profit Trends

Verified

Added on  2023/04/10

|11
|464
|359
Report
AI Summary
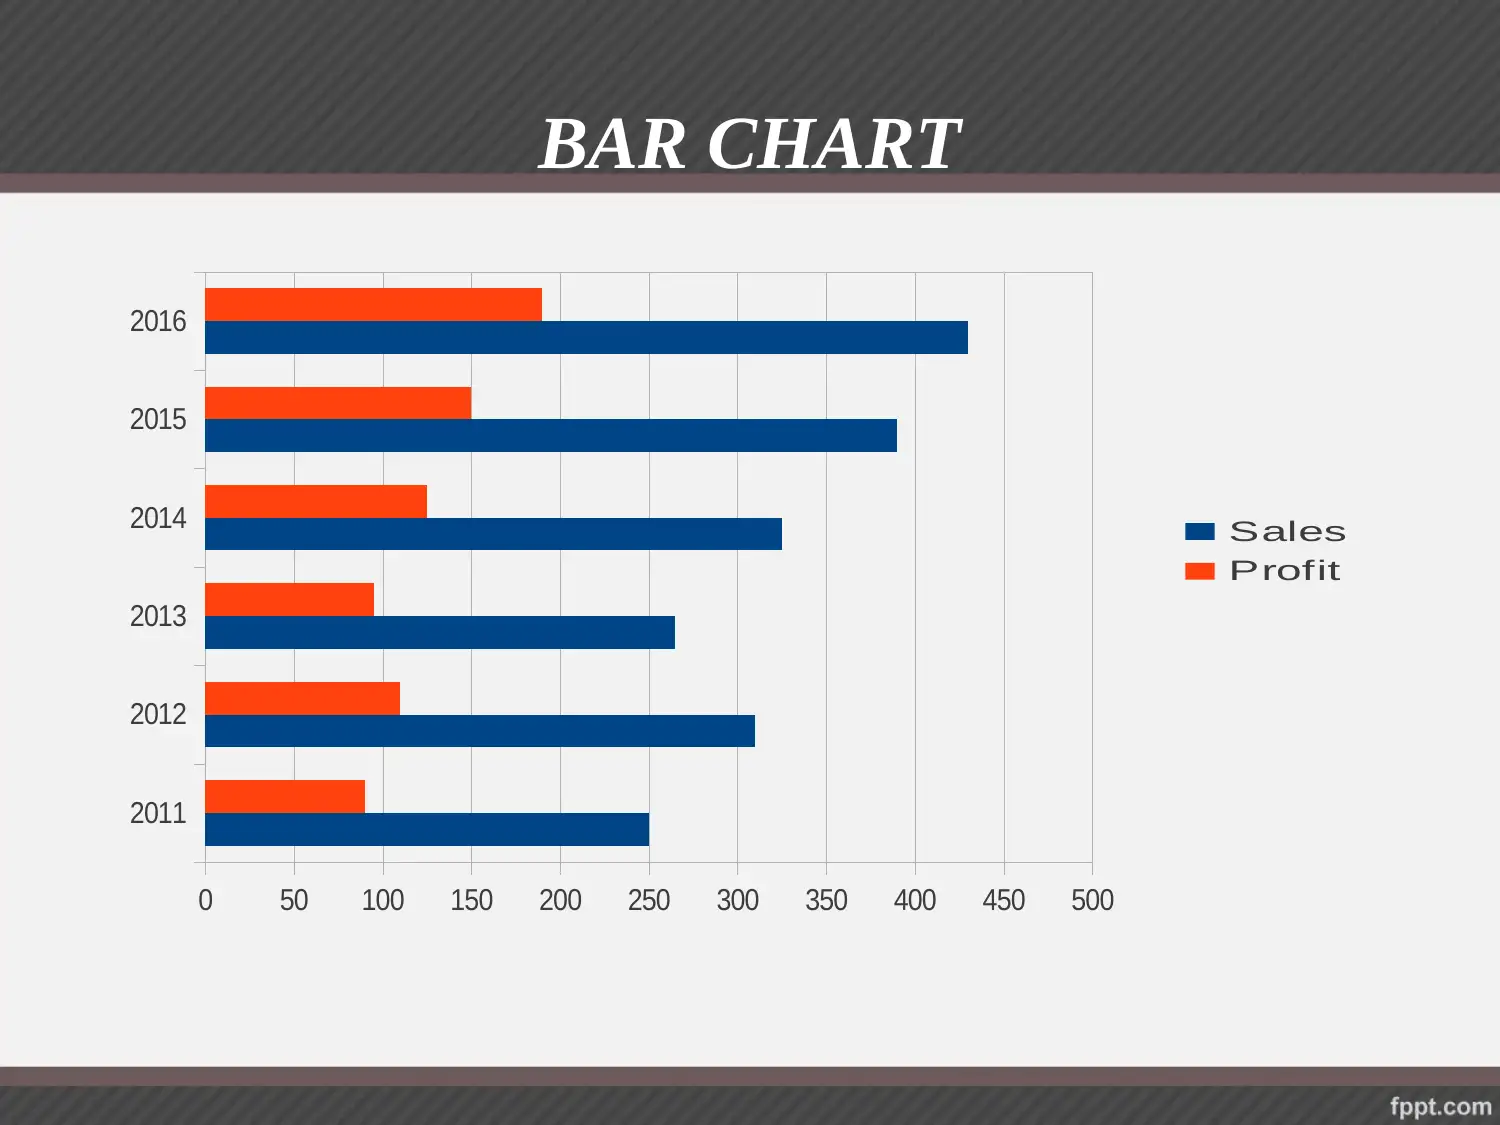
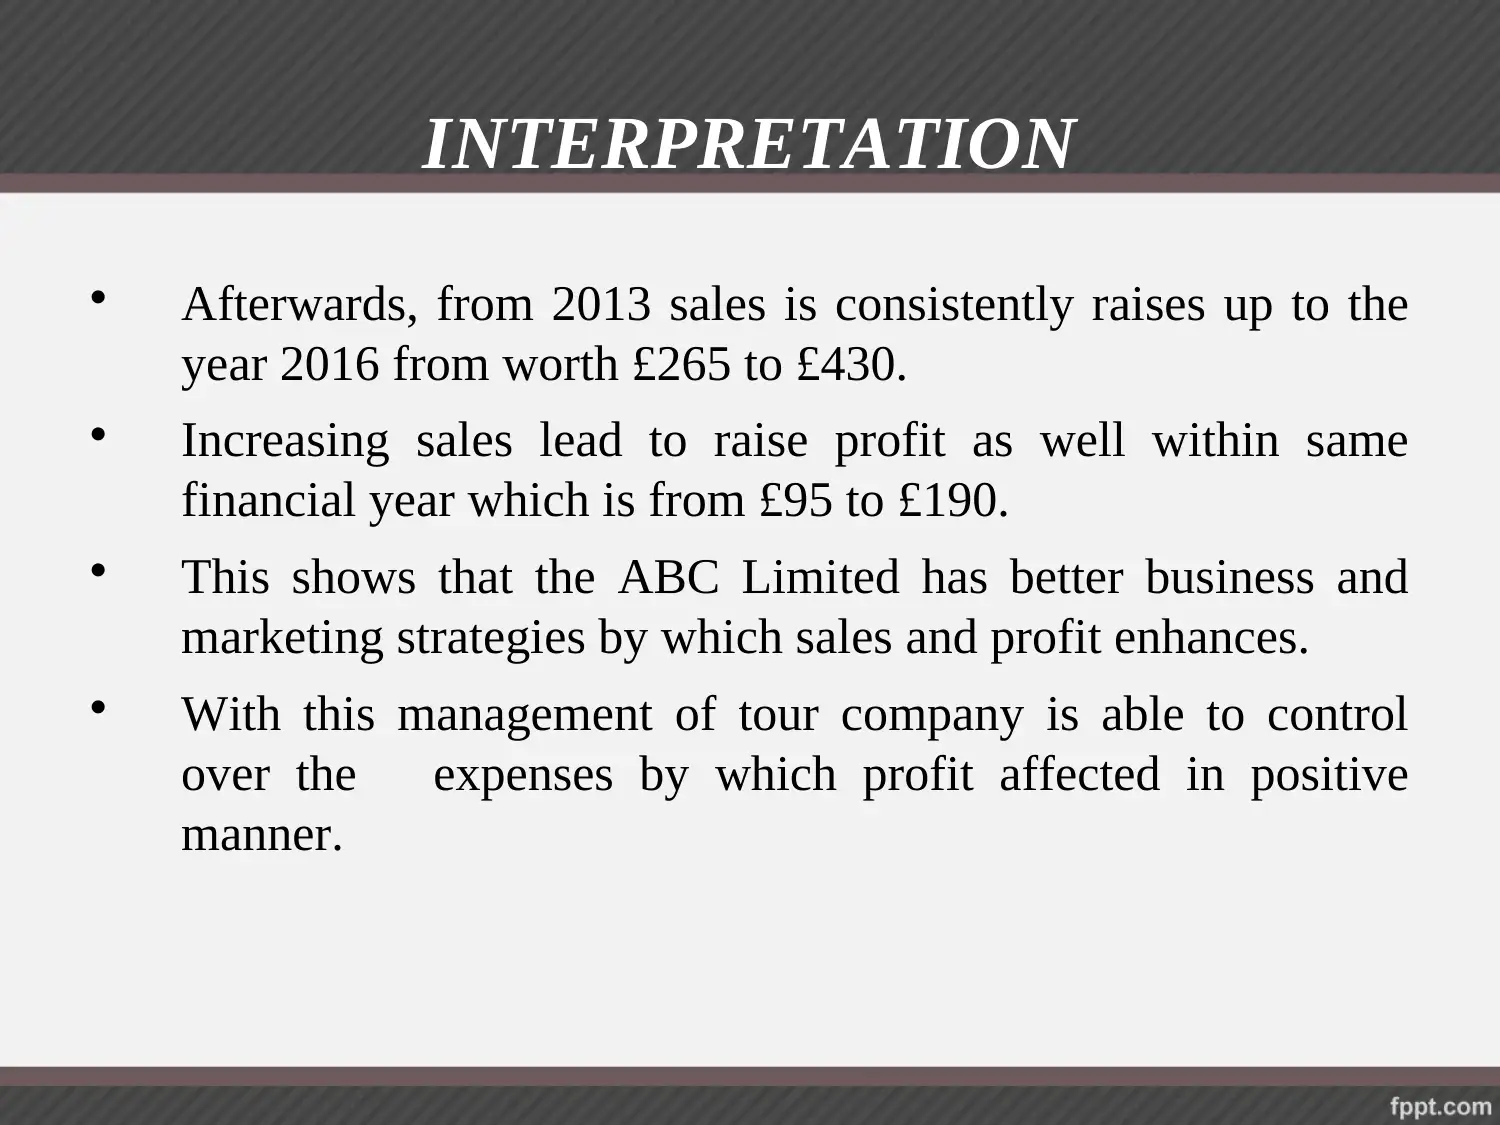
This report presents a detailed analysis of the sales and profit performance of ABC Limited from 2011 to 2016. The analysis includes various charts and graphs, such as pie charts, bar charts, and line charts, to visualize the company's financial data. The report interprets the trends in revenue and profit, highlighting the fluctuations and growth patterns over the six-year period. It also incorporates a trend line analysis to forecast future performance. The interpretation section discusses the factors influencing sales and profit, such as marketing strategies and expense management. The report concludes with a summary of key findings and includes references to relevant academic sources.
tabler-icon-diamond-filled.svg

Contribute Materials

Your contribution can guide someone’s learning journey. Share your documents today.
Document Page
BUSINESS DECISION
MAKING
TASK 3.3
tabler-icon-diamond-filled.svg

Secure Best Marks with AI Grader

Need help grading? Try our AI Grader for instant feedback on your assignments.
Document Page
PIE CHART FOR SALES
2011
2012
2013
2014
2015
2016
Document Page
PIE CHART FOR PROFIT
2011
2012
2013
2014
2015
2016
Document Page
BAR CHART
2011
2012
2013
2014
2015
2016
0 50 100 150 200 250 300 350 400 450 500
Sales
Profit
tabler-icon-diamond-filled.svg

Secure Best Marks with AI Grader

Need help grading? Try our AI Grader for instant feedback on your assignments.
Document Page
LINE CHART
2011 2012 2013 2014 2015 2016
0
50
100
150
200
250
300
350
400
450
500
Sales
Profit
Document Page
INTERPRETATION
The above drawn all the graphs and charts are shows sales
and profit earned by ABC Limited at the end of financial
year 2011 to 2016.
From the above charts and graphs it can be interpreted that
revenue of the ABC Limited is increases from the year 2011
to 2012 which shows that it is able to attract more number of
travellers and visitors in order to purchase its tour packages.
Further, due to this profit is also enhances from £90 to £110
in same year. Further, in the year 2013 sales and profit both
are reduces and come up at £265 and £95 respectively.
Document Page
INTERPRETATION
Afterwards, from 2013 sales is consistently raises up to the
year 2016 from worth £265 to £430.
Increasing sales lead to raise profit as well within same
financial year which is from £95 to £190.
This shows that the ABC Limited has better business and
marketing strategies by which sales and profit enhances.
With this management of tour company is able to control
over the expenses by which profit affected in positive
manner.
tabler-icon-diamond-filled.svg

Paraphrase This Document

Need a fresh take? Get an instant paraphrase of this document with our AI Paraphraser
Document Page
TREND LINE
2011 2012 2013 2014 2015 2016
0
50
100
150
200
250
300
350
400
450
500
f(x) = 34.2857142857x + 208.3333333333
f(x) = 18.5714285714x + 61.6666666667
Sales
Linear (Sales)
Profit
Linear (Profit)
Document Page
INTERPRETATION
The above mentioned trend line describes that sales as well as
profit both has upward trend from the financial year 2011 to
2016.
There is a difference is that revenue increasing with the higher
growth rate while rate of growth in the profit is lower compare
than sales.
It can be forecasted that ABC Limited will be generate revenue
in the upcoming accounting periods with the higher growth rate.
On the other side as per the margin it can be predicted that
management will earn profit in the future but at lower value in
comparison to sales and revenue.
Document Page
REFERENCES
Moradi, A., 2012, April. Statistical tools flavor side-channel
collision attacks. In Annual International Conference on the
Theory and Applications of Cryptographic Techniques. pp.
428-445.
Hsu, D., Kakade, S. M. and Zhang, T., 2012. A spectral
algorithm for learning hidden Markov models. Journal of
Computer and System Sciences. 78(5). pp. 1460-1480.
Aremu, C. O., 2012. Exploring statistical tools in measuring
genetic diversity for crop improvement. INTECH Open Access
Publisher.
tabler-icon-diamond-filled.svg

Secure Best Marks with AI Grader

Need help grading? Try our AI Grader for instant feedback on your assignments.
Document Page
THANK YOU
chevron_up_icon
1 out of 11
circle_padding
hide_on_mobile
zoom_out_icon
logo.png

Your All-in-One AI-Powered Toolkit for Academic Success.

Available 24*7 on WhatsApp / Email

[object Object]