Business Decision Making Report - Data Analysis and Findings
VerifiedAdded on 2020/01/28
|23
|5577
|152
Report
AI Summary
This report provides a comprehensive analysis of business decision-making, encompassing various aspects of data collection, statistical analysis, and financial tools. The report begins with a plan for gathering primary and secondary data, followed by a detailed explanation of survey methodology, sampling frames, and questionnaire design. Task 2 focuses on data summarization using mean, mode, and median to aid decision-making, alongside an analysis of results to draw valid business conclusions. Measures of dispersion, including range, interquartile range, and standard deviation, are used to inform stakeholders, and quartiles, percentiles, and correlation coefficients are explained. Task 3 involves the use of spreadsheets to produce information on pie charts, bar graphs, and line graphs, along with the creation of scatter graphs and trend lines for forecasting. The report concludes with a business presentation and formal report. Task 4 addresses inventory management, customer order processes, network diagrams, critical path determination, and the use of financial tools like NPV and IRR to evaluate investment options.

BUSINESS DECISION
MAKING
1
MAKING
1
Paraphrase This Document
Need a fresh take? Get an instant paraphrase of this document with our AI Paraphraser
Table of Contents
Introduction..........................................................................................................................................3
TASK 1.................................................................................................................................................3
1.1 Create a plan for the collection of primary and secondary data for the proposed market
research............................................................................................................................................3
1.2 Present the survey methodology and sampling frame you will use for the research.................3
1.3 Design an appropriate questionnaire..........................................................................................3
TASK 2.................................................................................................................................................6
2.1 Create information to aid decision making for the company by summarising data using the
mean, mode and median..................................................................................................................6
2.2 Analyse the results obtained above to draw valid business conclusions for the company........9
2.3 Analyse the data using measures of dispersion- the range, inter-quartile range and standard
deviation to inform the stakeholders..............................................................................................10
2.4 Explain how quartiles, percentiles and the correlation coefficient..........................................13
TASK 3...............................................................................................................................................15
3.1 Using spreadsheet, produce your information on pie charts, bar graphs, line graphs as
appropriate and draw valid business conclusions..........................................................................15
3.2 Produce scatter graphs and create trend lines of the total sales and cost data above to forecast
sales and costs for the next period.................................................................................................16
3.3 Prepare a business presentation to disseminate this information effectively...........................18
3.4 Business formal report.............................................................................................................18
TASK 4...............................................................................................................................................18
4.1 Explain how the company manages inventory and customer orders.......................................18
4.2 Use the information below to construct a network diagram and determine the critical path.. 19
4.3 Use financial tools NPV and IRR to decide which investment option is financially viable for
the company...................................................................................................................................20
Conclusion..........................................................................................................................................22
References..........................................................................................................................................23
2
INTRODUCTION
Decision in an entity is important in order to remove weaknesses lies in the business. This
project is all about collecting information whose accuracy will be verified by using statistical
measures. The project evaluation technique will be uses to select the project for future purpose.
TASK 1
1.1 Create a plan for the collection of primary and secondary data for the proposed market research
Primary data collection- The information are collected by the researcher by conducting a research
study in which data will be highly reliable and accurate as it is personally collected by them
(Abbasi, 2014). The information is collected from the real sources and not from any other medium
of collection of data.
Secondary data- Other method used by an entity includes accessing books, journals, magazine
articles, newspapers in order to collect data in order to accomplishes the desired aims and the
objectives of an entity.
Internal analysis- In this kind of analysis the data will be collected y an individual after analysing
all the internal structure of an entity in order to meet the information.
External analysis- External modes of information will be uses by an individual in which
information can be gathered from the external modes in order to verify its ability with the external
means.
1.2 Present the survey methodology and sampling frame you will use for the research
Survey methodology needs to design by an entity owner in order to collect important
information related to the business (Dollery, Kortt and Grant, 2013). Primary surveys are conducted
in which questionnaires are designed which will be circulated among all the customers. In the
questionnaires both open end and closed end information will be obtained with the help of this
particular technique.
Sampling- Cluster sampling method will be used in which whole information are divided into
different sub categories in order to collect evidences to support the aim of the business.
Samples- 100 samples are collected of the total universe or population in order to achieve the
desired aims and targets of an enterprise.
1.3 Design an appropriate questionnaire
QUESTIONNAIRE
Name-______________
Gender
3
⊘ This is a preview!⊘
Do you want full access?
Subscribe today to unlock all pages.
Trusted by 1+ million students worldwide
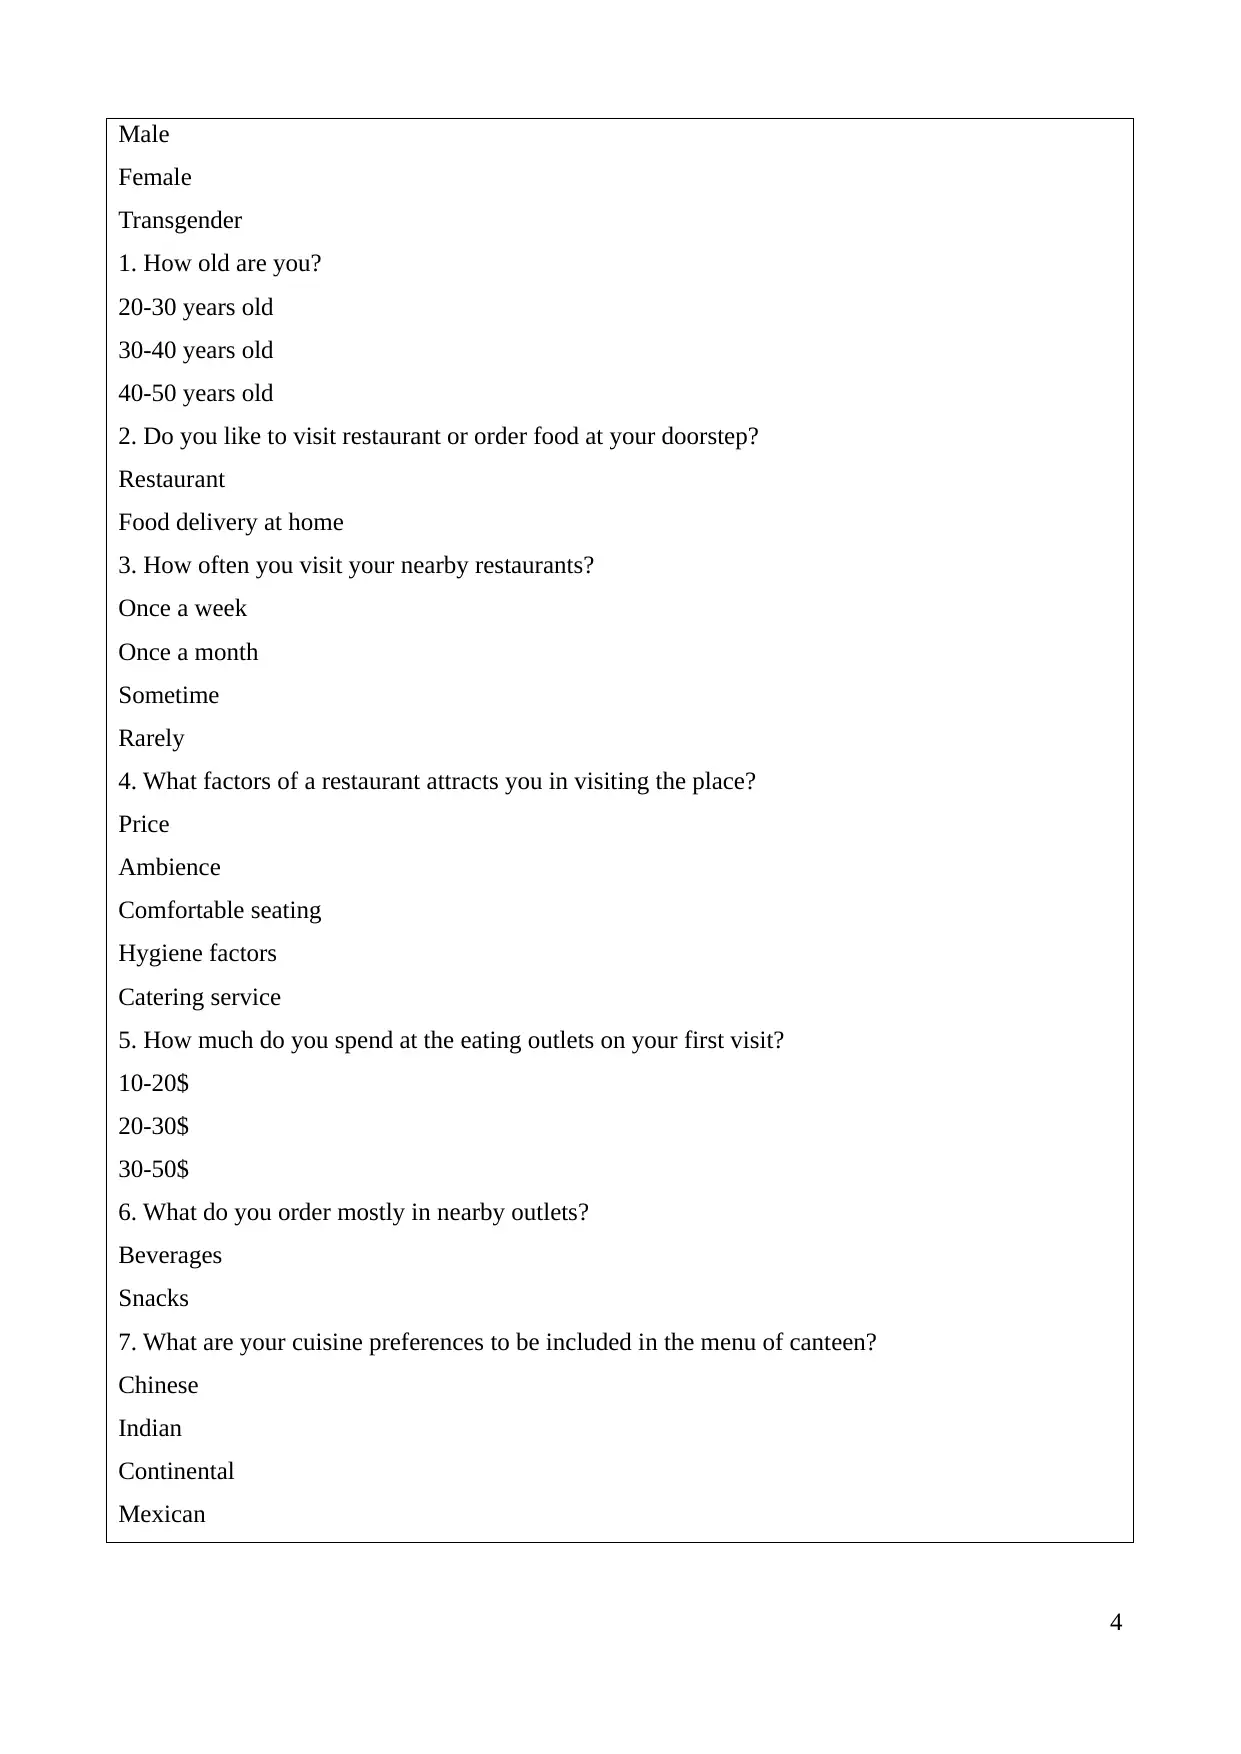
Male
Female
Transgender
1. How old are you?
20-30 years old
30-40 years old
40-50 years old
2. Do you like to visit restaurant or order food at your doorstep?
Restaurant
Food delivery at home
3. How often you visit your nearby restaurants?
Once a week
Once a month
Sometime
Rarely
4. What factors of a restaurant attracts you in visiting the place?
Price
Ambience
Comfortable seating
Hygiene factors
Catering service
5. How much do you spend at the eating outlets on your first visit?
10-20$
20-30$
30-50$
6. What do you order mostly in nearby outlets?
Beverages
Snacks
7. What are your cuisine preferences to be included in the menu of canteen?
Chinese
Indian
Continental
Mexican
4
Paraphrase This Document
Need a fresh take? Get an instant paraphrase of this document with our AI Paraphraser
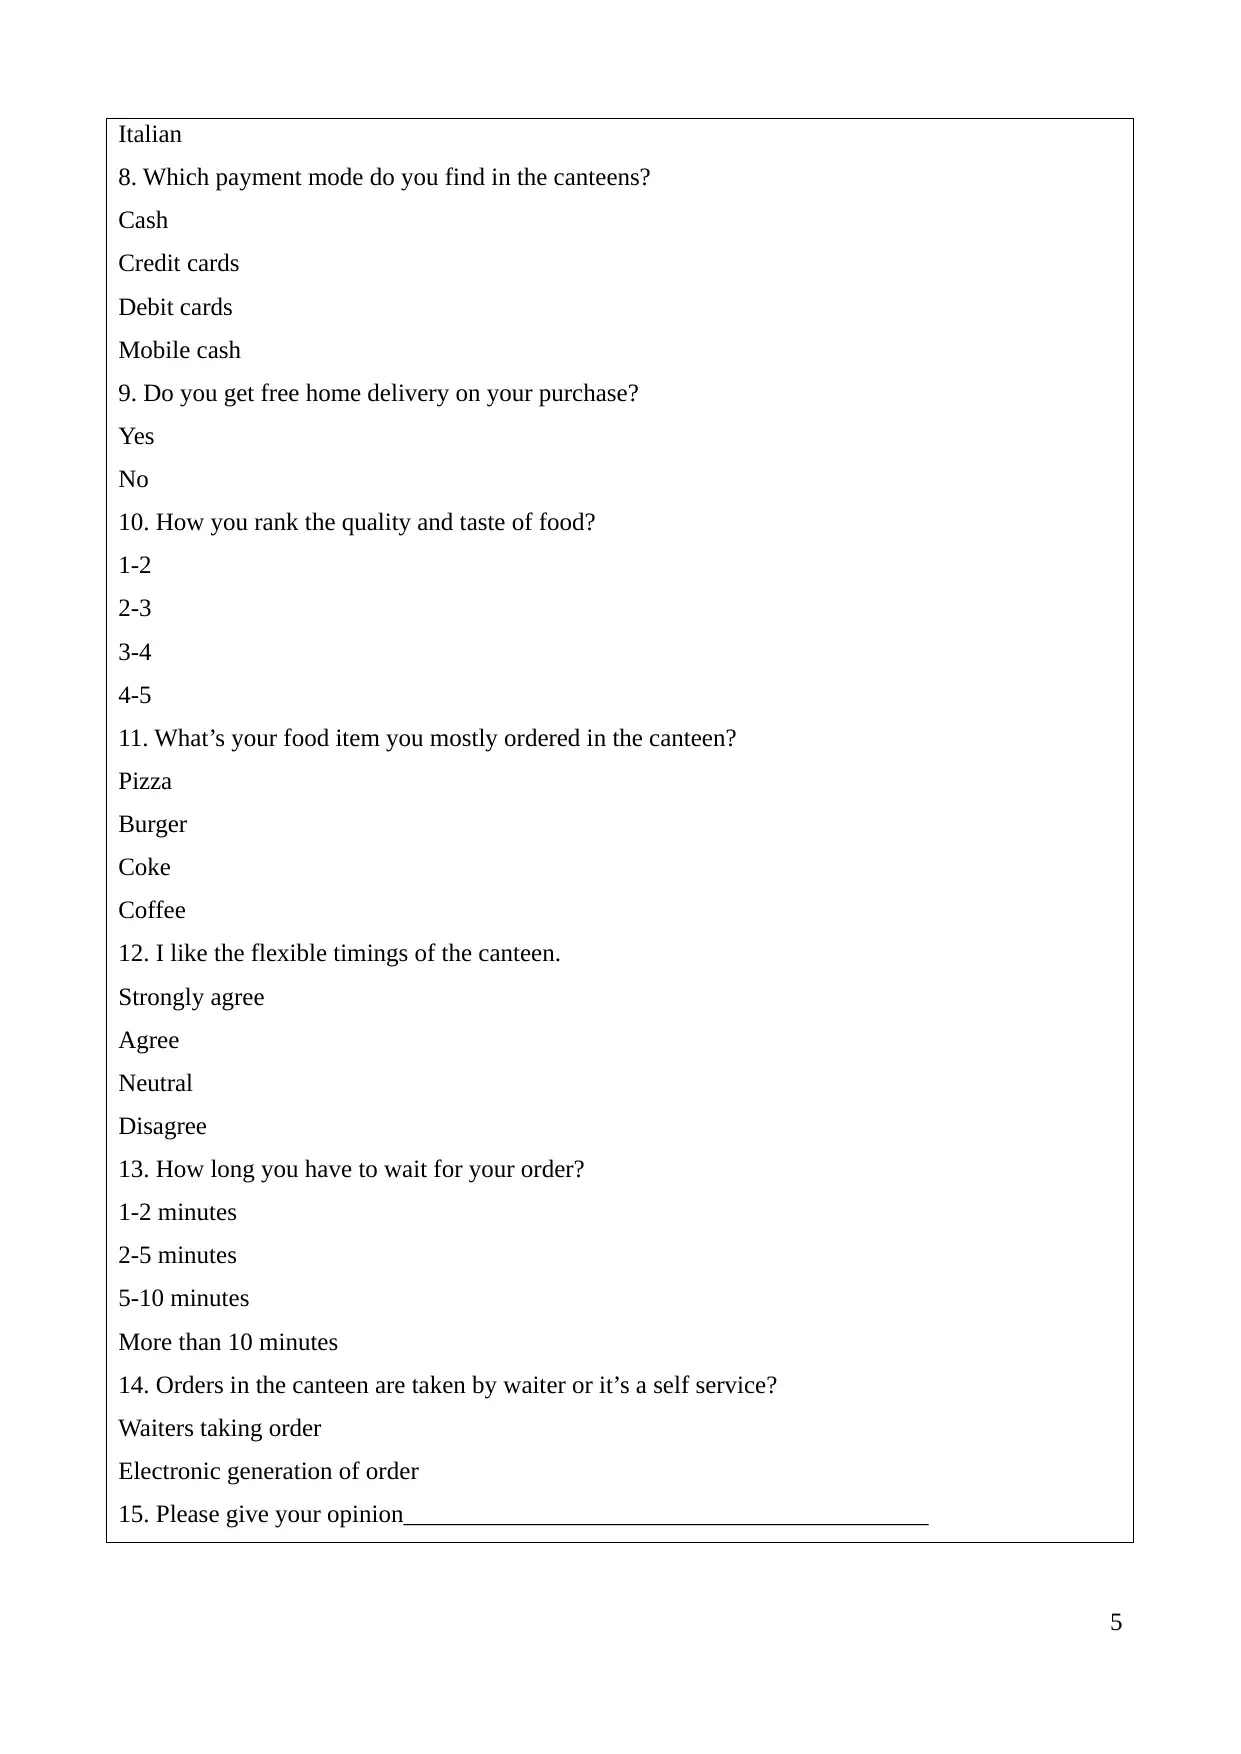
Italian
8. Which payment mode do you find in the canteens?
Cash
Credit cards
Debit cards
Mobile cash
9. Do you get free home delivery on your purchase?
Yes
No
10. How you rank the quality and taste of food?
1-2
2-3
3-4
4-5
11. What’s your food item you mostly ordered in the canteen?
Pizza
Burger
Coke
Coffee
12. I like the flexible timings of the canteen.
Strongly agree
Agree
Neutral
Disagree
13. How long you have to wait for your order?
1-2 minutes
2-5 minutes
5-10 minutes
More than 10 minutes
14. Orders in the canteen are taken by waiter or it’s a self service?
Waiters taking order
Electronic generation of order
15. Please give your opinion__________________________________________
5
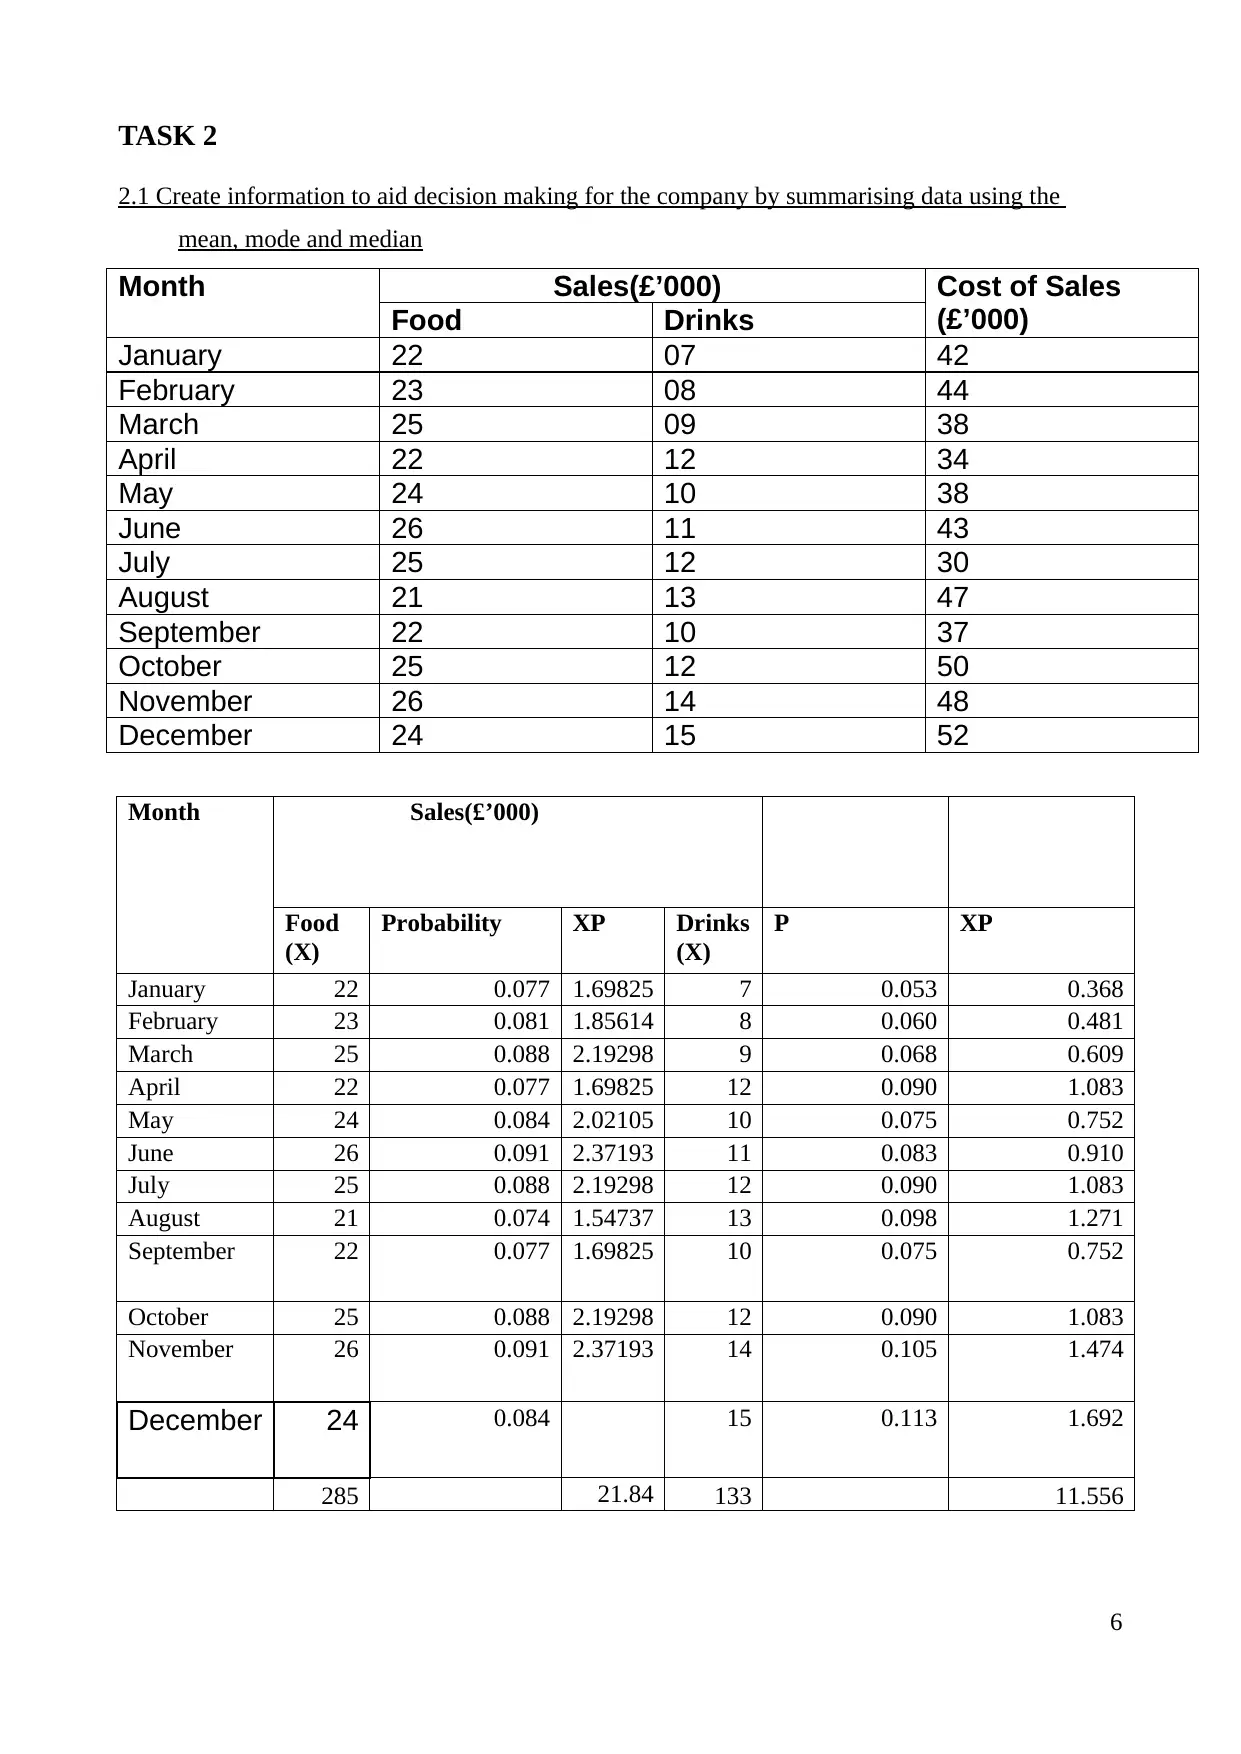
TASK 2
2.1 Create information to aid decision making for the company by summarising data using the
mean, mode and median
Month Sales(£’000) Cost of Sales
(£’000)Food Drinks
January 22 07 42
February 23 08 44
March 25 09 38
April 22 12 34
May 24 10 38
June 26 11 43
July 25 12 30
August 21 13 47
September 22 10 37
October 25 12 50
November 26 14 48
December 24 15 52
Month Sales(£’000)
Food
(X)
Probability XP Drinks
(X)
P XP
January 22 0.077 1.69825 7 0.053 0.368
February 23 0.081 1.85614 8 0.060 0.481
March 25 0.088 2.19298 9 0.068 0.609
April 22 0.077 1.69825 12 0.090 1.083
May 24 0.084 2.02105 10 0.075 0.752
June 26 0.091 2.37193 11 0.083 0.910
July 25 0.088 2.19298 12 0.090 1.083
August 21 0.074 1.54737 13 0.098 1.271
September 22 0.077 1.69825 10 0.075 0.752
October 25 0.088 2.19298 12 0.090 1.083
November 26 0.091 2.37193 14 0.105 1.474
December 24 0.084 15 0.113 1.692
285 21.84 133 11.556
6
⊘ This is a preview!⊘
Do you want full access?
Subscribe today to unlock all pages.
Trusted by 1+ million students worldwide
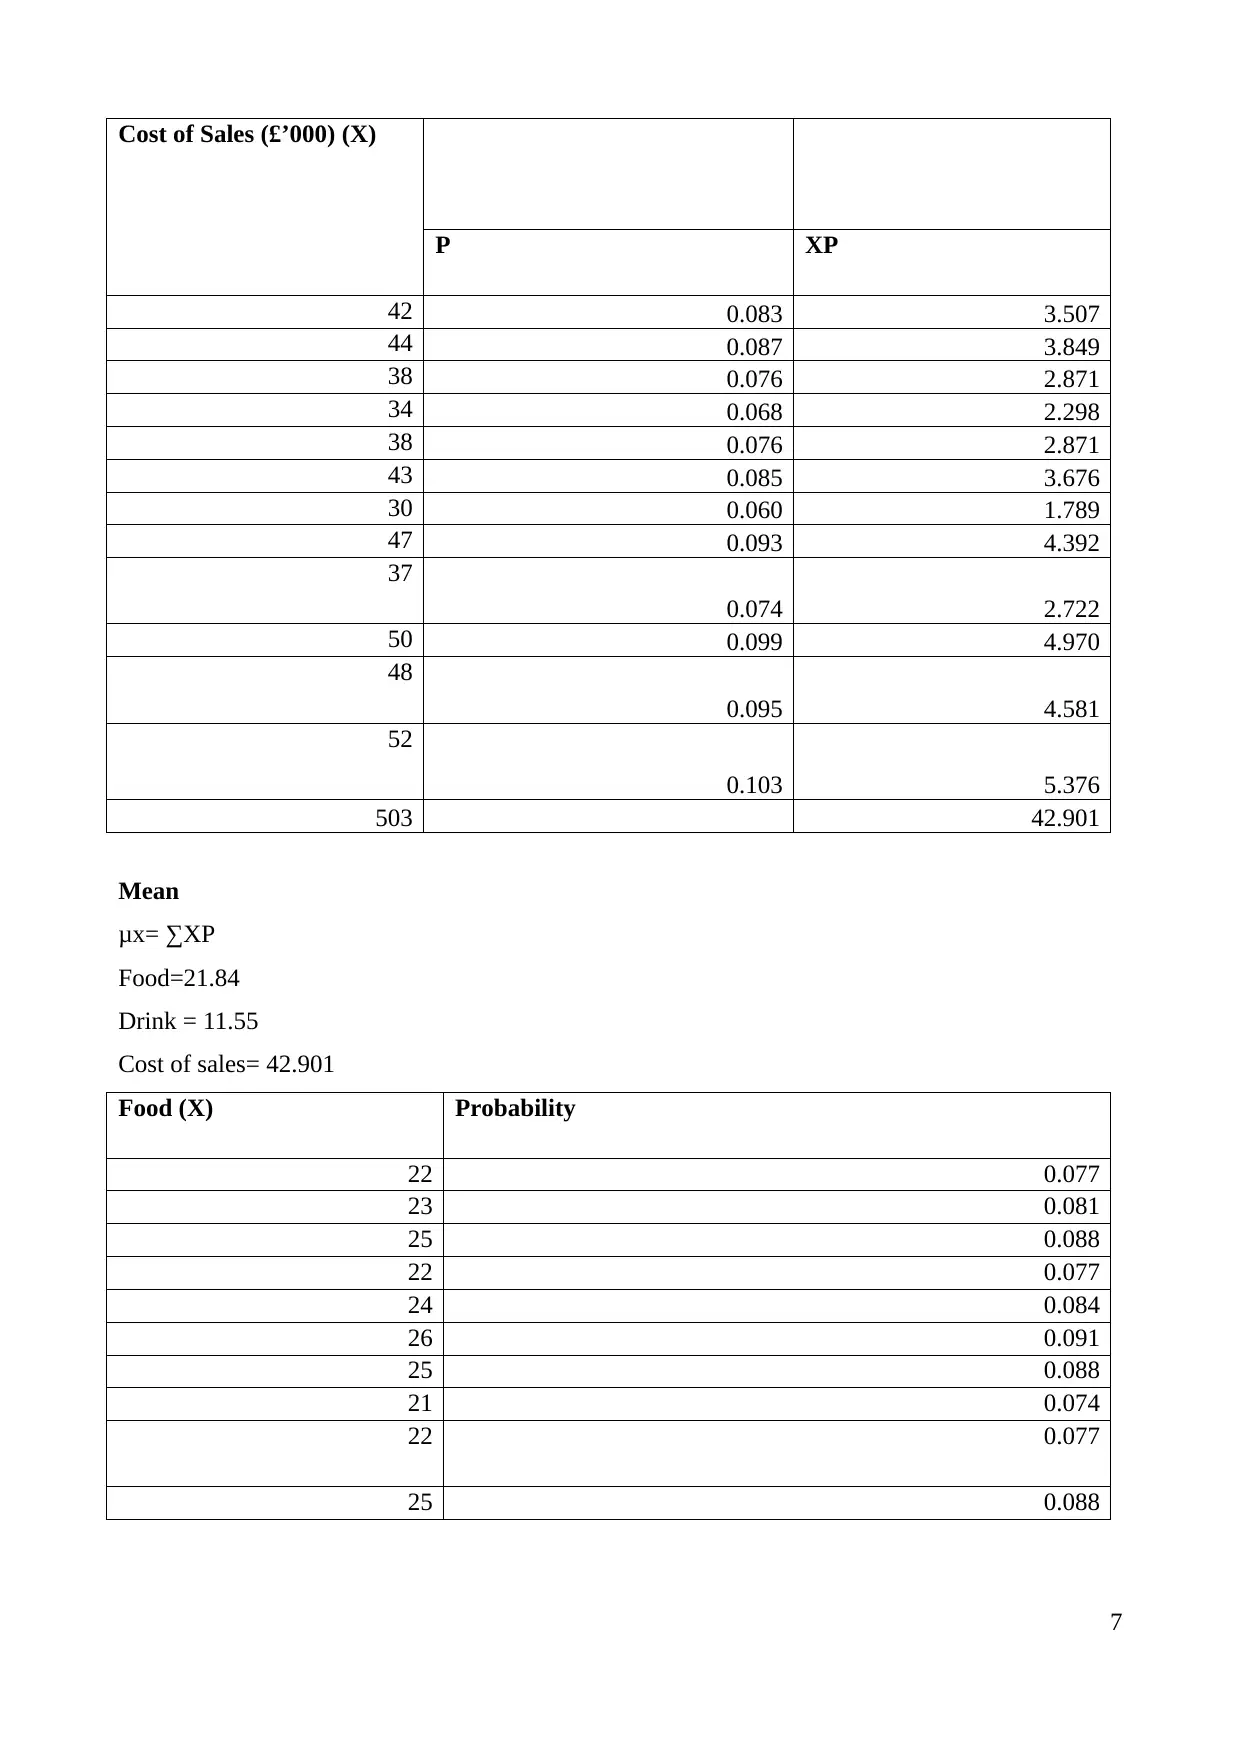
Cost of Sales (£’000) (X)
P XP
42 0.083 3.507
44 0.087 3.849
38 0.076 2.871
34 0.068 2.298
38 0.076 2.871
43 0.085 3.676
30 0.060 1.789
47 0.093 4.392
37
0.074 2.722
50 0.099 4.970
48
0.095 4.581
52
0.103 5.376
503 42.901
Mean
μx= ∑XP
Food=21.84
Drink = 11.55
Cost of sales= 42.901
Food (X) Probability
22 0.077
23 0.081
25 0.088
22 0.077
24 0.084
26 0.091
25 0.088
21 0.074
22 0.077
25 0.088
7
Paraphrase This Document
Need a fresh take? Get an instant paraphrase of this document with our AI Paraphraser
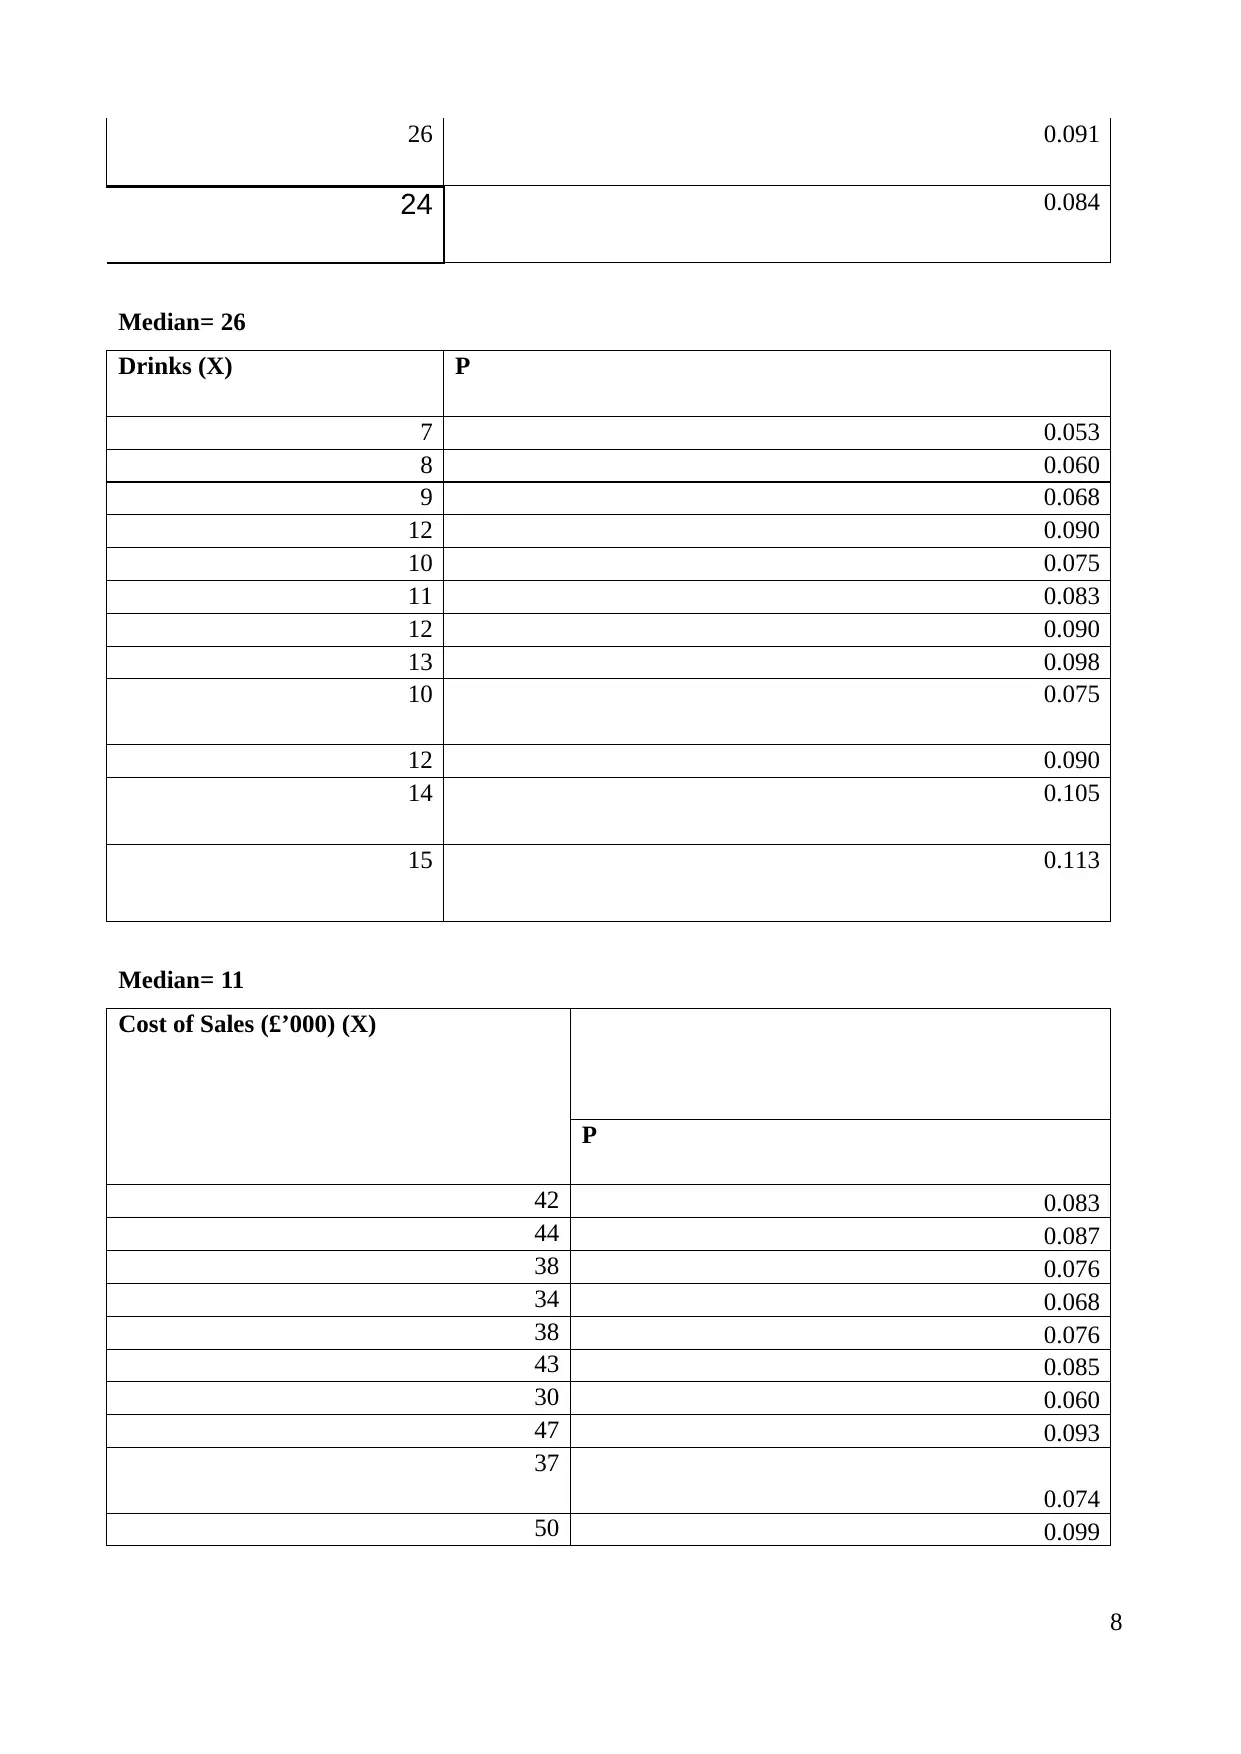
26 0.091
24 0.084
Median= 26
Drinks (X) P
7 0.053
8 0.060
9 0.068
12 0.090
10 0.075
11 0.083
12 0.090
13 0.098
10 0.075
12 0.090
14 0.105
15 0.113
Median= 11
Cost of Sales (£’000) (X)
P
42 0.083
44 0.087
38 0.076
34 0.068
38 0.076
43 0.085
30 0.060
47 0.093
37
0.074
50 0.099
8
24 0.084
Median= 26
Drinks (X) P
7 0.053
8 0.060
9 0.068
12 0.090
10 0.075
11 0.083
12 0.090
13 0.098
10 0.075
12 0.090
14 0.105
15 0.113
Median= 11
Cost of Sales (£’000) (X)
P
42 0.083
44 0.087
38 0.076
34 0.068
38 0.076
43 0.085
30 0.060
47 0.093
37
0.074
50 0.099
8
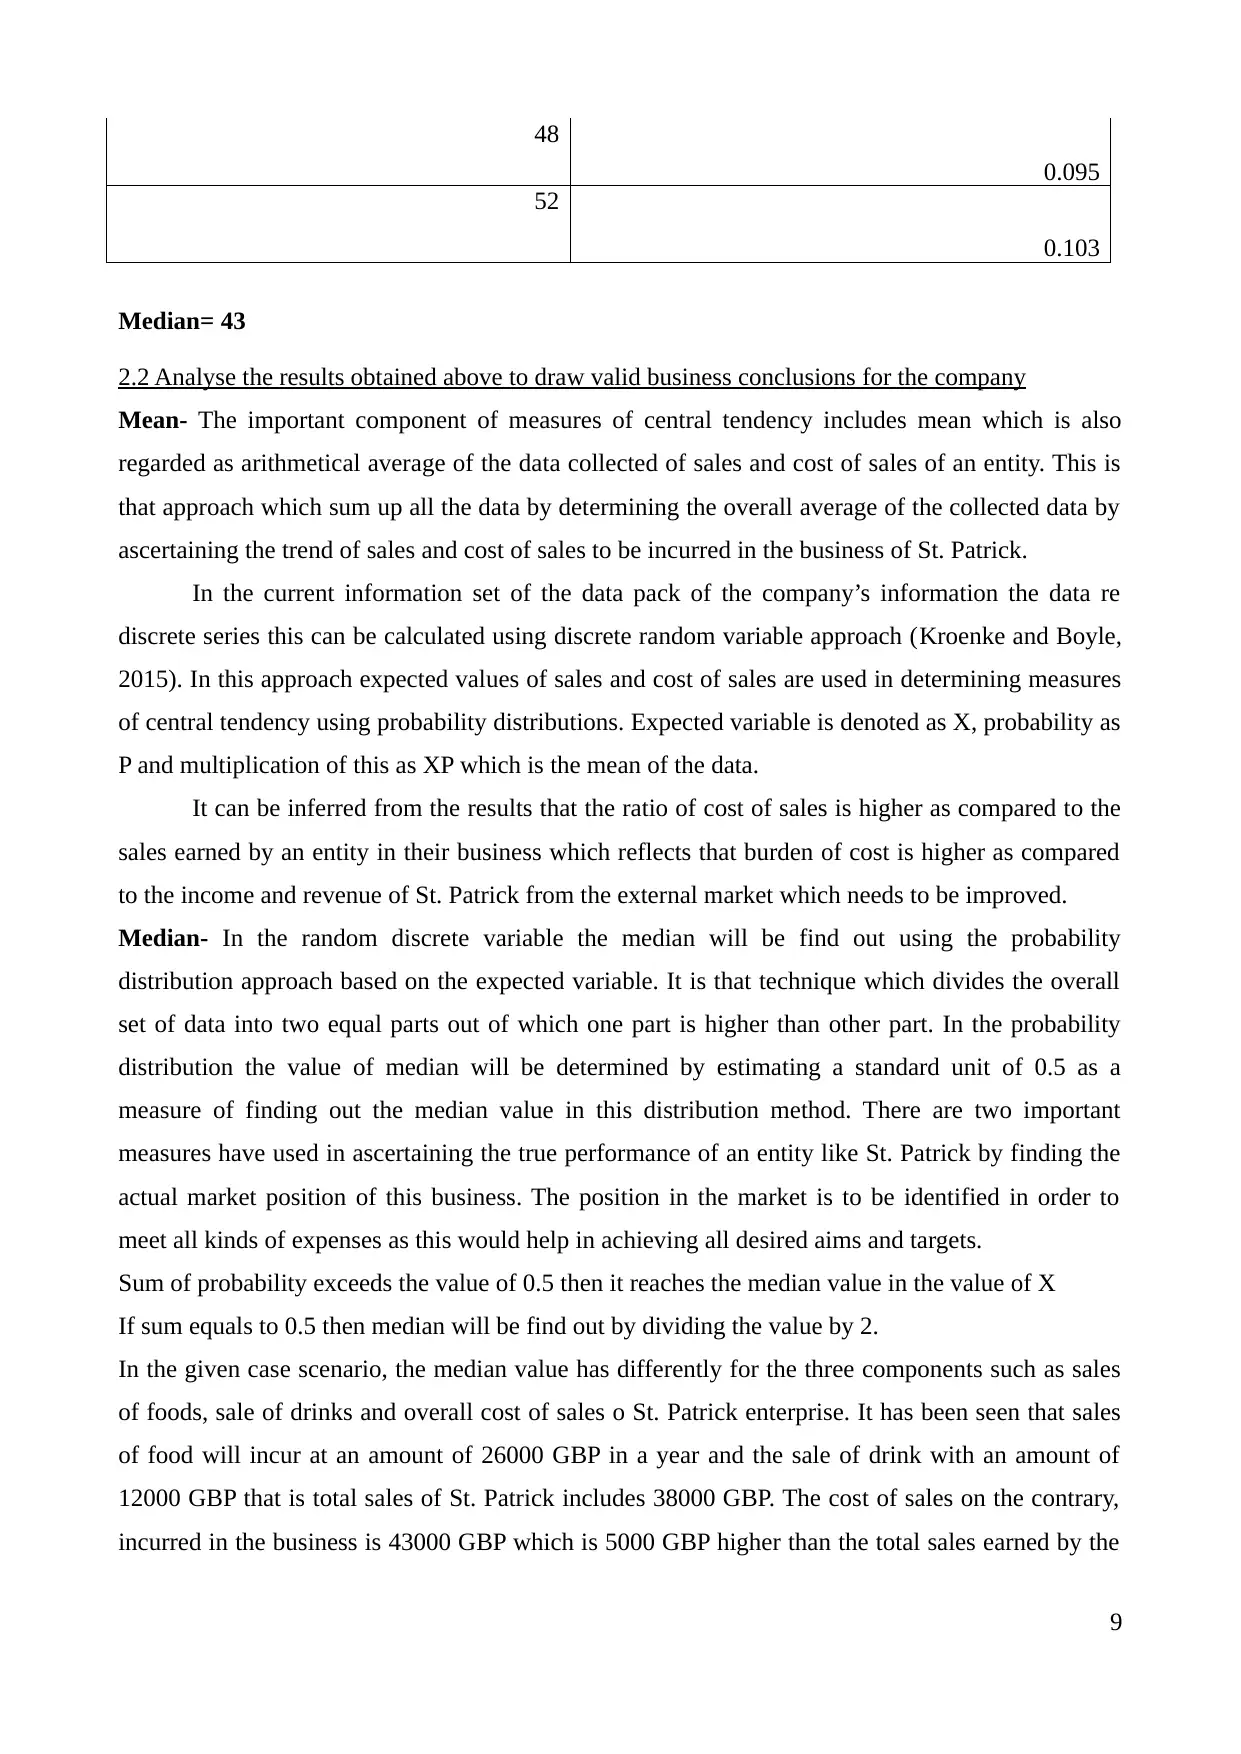
48
0.095
52
0.103
Median= 43
2.2 Analyse the results obtained above to draw valid business conclusions for the company
Mean- The important component of measures of central tendency includes mean which is also
regarded as arithmetical average of the data collected of sales and cost of sales of an entity. This is
that approach which sum up all the data by determining the overall average of the collected data by
ascertaining the trend of sales and cost of sales to be incurred in the business of St. Patrick.
In the current information set of the data pack of the company’s information the data re
discrete series this can be calculated using discrete random variable approach (Kroenke and Boyle,
2015). In this approach expected values of sales and cost of sales are used in determining measures
of central tendency using probability distributions. Expected variable is denoted as X, probability as
P and multiplication of this as XP which is the mean of the data.
It can be inferred from the results that the ratio of cost of sales is higher as compared to the
sales earned by an entity in their business which reflects that burden of cost is higher as compared
to the income and revenue of St. Patrick from the external market which needs to be improved.
Median- In the random discrete variable the median will be find out using the probability
distribution approach based on the expected variable. It is that technique which divides the overall
set of data into two equal parts out of which one part is higher than other part. In the probability
distribution the value of median will be determined by estimating a standard unit of 0.5 as a
measure of finding out the median value in this distribution method. There are two important
measures have used in ascertaining the true performance of an entity like St. Patrick by finding the
actual market position of this business. The position in the market is to be identified in order to
meet all kinds of expenses as this would help in achieving all desired aims and targets.
Sum of probability exceeds the value of 0.5 then it reaches the median value in the value of X
If sum equals to 0.5 then median will be find out by dividing the value by 2.
In the given case scenario, the median value has differently for the three components such as sales
of foods, sale of drinks and overall cost of sales o St. Patrick enterprise. It has been seen that sales
of food will incur at an amount of 26000 GBP in a year and the sale of drink with an amount of
12000 GBP that is total sales of St. Patrick includes 38000 GBP. The cost of sales on the contrary,
incurred in the business is 43000 GBP which is 5000 GBP higher than the total sales earned by the
9
⊘ This is a preview!⊘
Do you want full access?
Subscribe today to unlock all pages.
Trusted by 1+ million students worldwide
firm which shows that an entity will suffered with loss. This loss can be improved by focusing on
the sales and the revenue generation and reduction of cost of sales n order to compensate the level
of an enterprise.
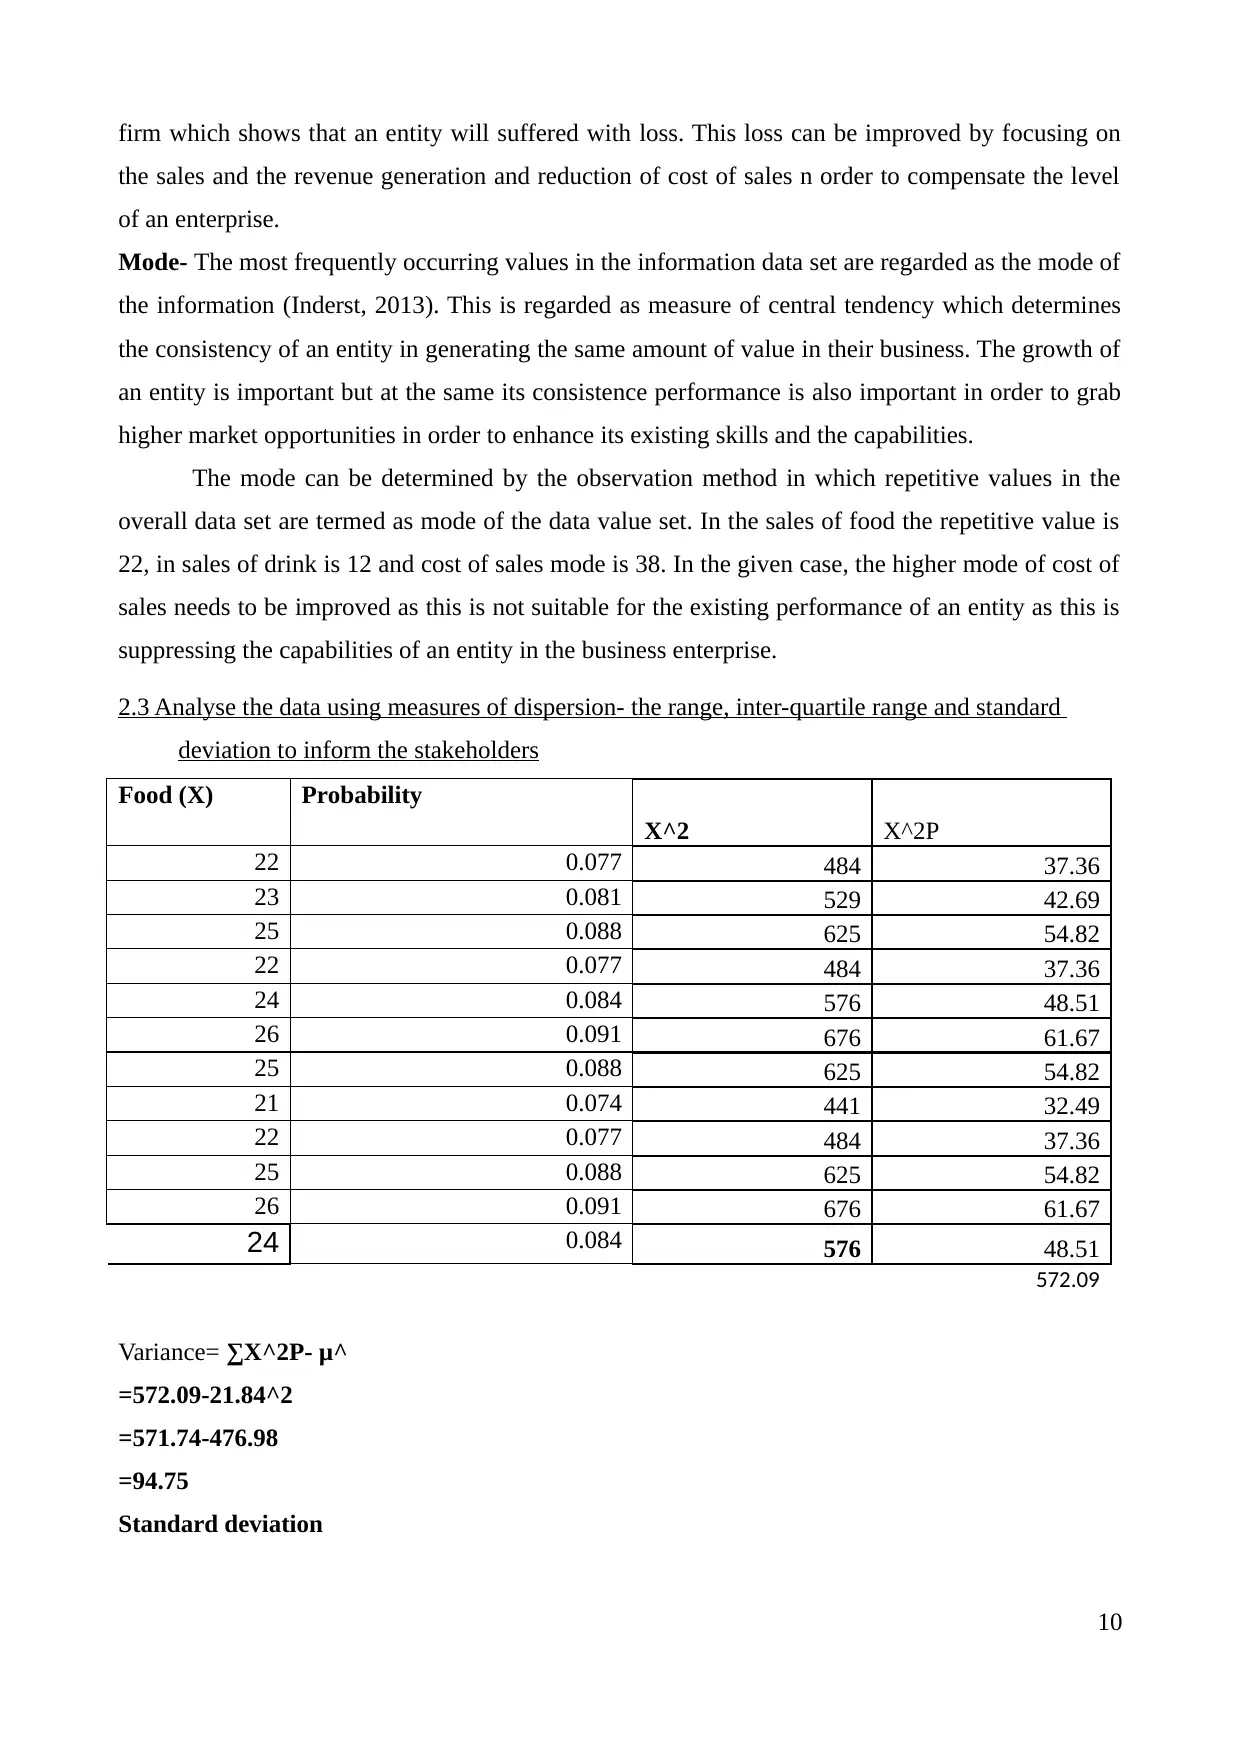
Mode- The most frequently occurring values in the information data set are regarded as the mode of
the information (Inderst, 2013). This is regarded as measure of central tendency which determines
the consistency of an entity in generating the same amount of value in their business. The growth of
an entity is important but at the same its consistence performance is also important in order to grab
higher market opportunities in order to enhance its existing skills and the capabilities.
The mode can be determined by the observation method in which repetitive values in the
overall data set are termed as mode of the data value set. In the sales of food the repetitive value is
22, in sales of drink is 12 and cost of sales mode is 38. In the given case, the higher mode of cost of
sales needs to be improved as this is not suitable for the existing performance of an entity as this is
suppressing the capabilities of an entity in the business enterprise.
2.3 Analyse the data using measures of dispersion- the range, inter-quartile range and standard
deviation to inform the stakeholders
Food (X) Probability
X^2 X^2P
22 0.077 484 37.36
23 0.081 529 42.69
25 0.088 625 54.82
22 0.077 484 37.36
24 0.084 576 48.51
26 0.091 676 61.67
25 0.088 625 54.82
21 0.074 441 32.49
22 0.077 484 37.36
25 0.088 625 54.82
26 0.091 676 61.67
24 0.084 576 48.51
572.09
Variance= ∑X^2P- μ^
=572.09-21.84^2
=571.74-476.98
=94.75
Standard deviation
10
the sales and the revenue generation and reduction of cost of sales n order to compensate the level
of an enterprise.
Mode- The most frequently occurring values in the information data set are regarded as the mode of
the information (Inderst, 2013). This is regarded as measure of central tendency which determines
the consistency of an entity in generating the same amount of value in their business. The growth of
an entity is important but at the same its consistence performance is also important in order to grab
higher market opportunities in order to enhance its existing skills and the capabilities.
The mode can be determined by the observation method in which repetitive values in the
overall data set are termed as mode of the data value set. In the sales of food the repetitive value is
22, in sales of drink is 12 and cost of sales mode is 38. In the given case, the higher mode of cost of
sales needs to be improved as this is not suitable for the existing performance of an entity as this is
suppressing the capabilities of an entity in the business enterprise.
2.3 Analyse the data using measures of dispersion- the range, inter-quartile range and standard
deviation to inform the stakeholders
Food (X) Probability
X^2 X^2P
22 0.077 484 37.36
23 0.081 529 42.69
25 0.088 625 54.82
22 0.077 484 37.36
24 0.084 576 48.51
26 0.091 676 61.67
25 0.088 625 54.82
21 0.074 441 32.49
22 0.077 484 37.36
25 0.088 625 54.82
26 0.091 676 61.67
24 0.084 576 48.51
572.09
Variance= ∑X^2P- μ^
=572.09-21.84^2
=571.74-476.98
=94.75
Standard deviation
10
Paraphrase This Document
Need a fresh take? Get an instant paraphrase of this document with our AI Paraphraser
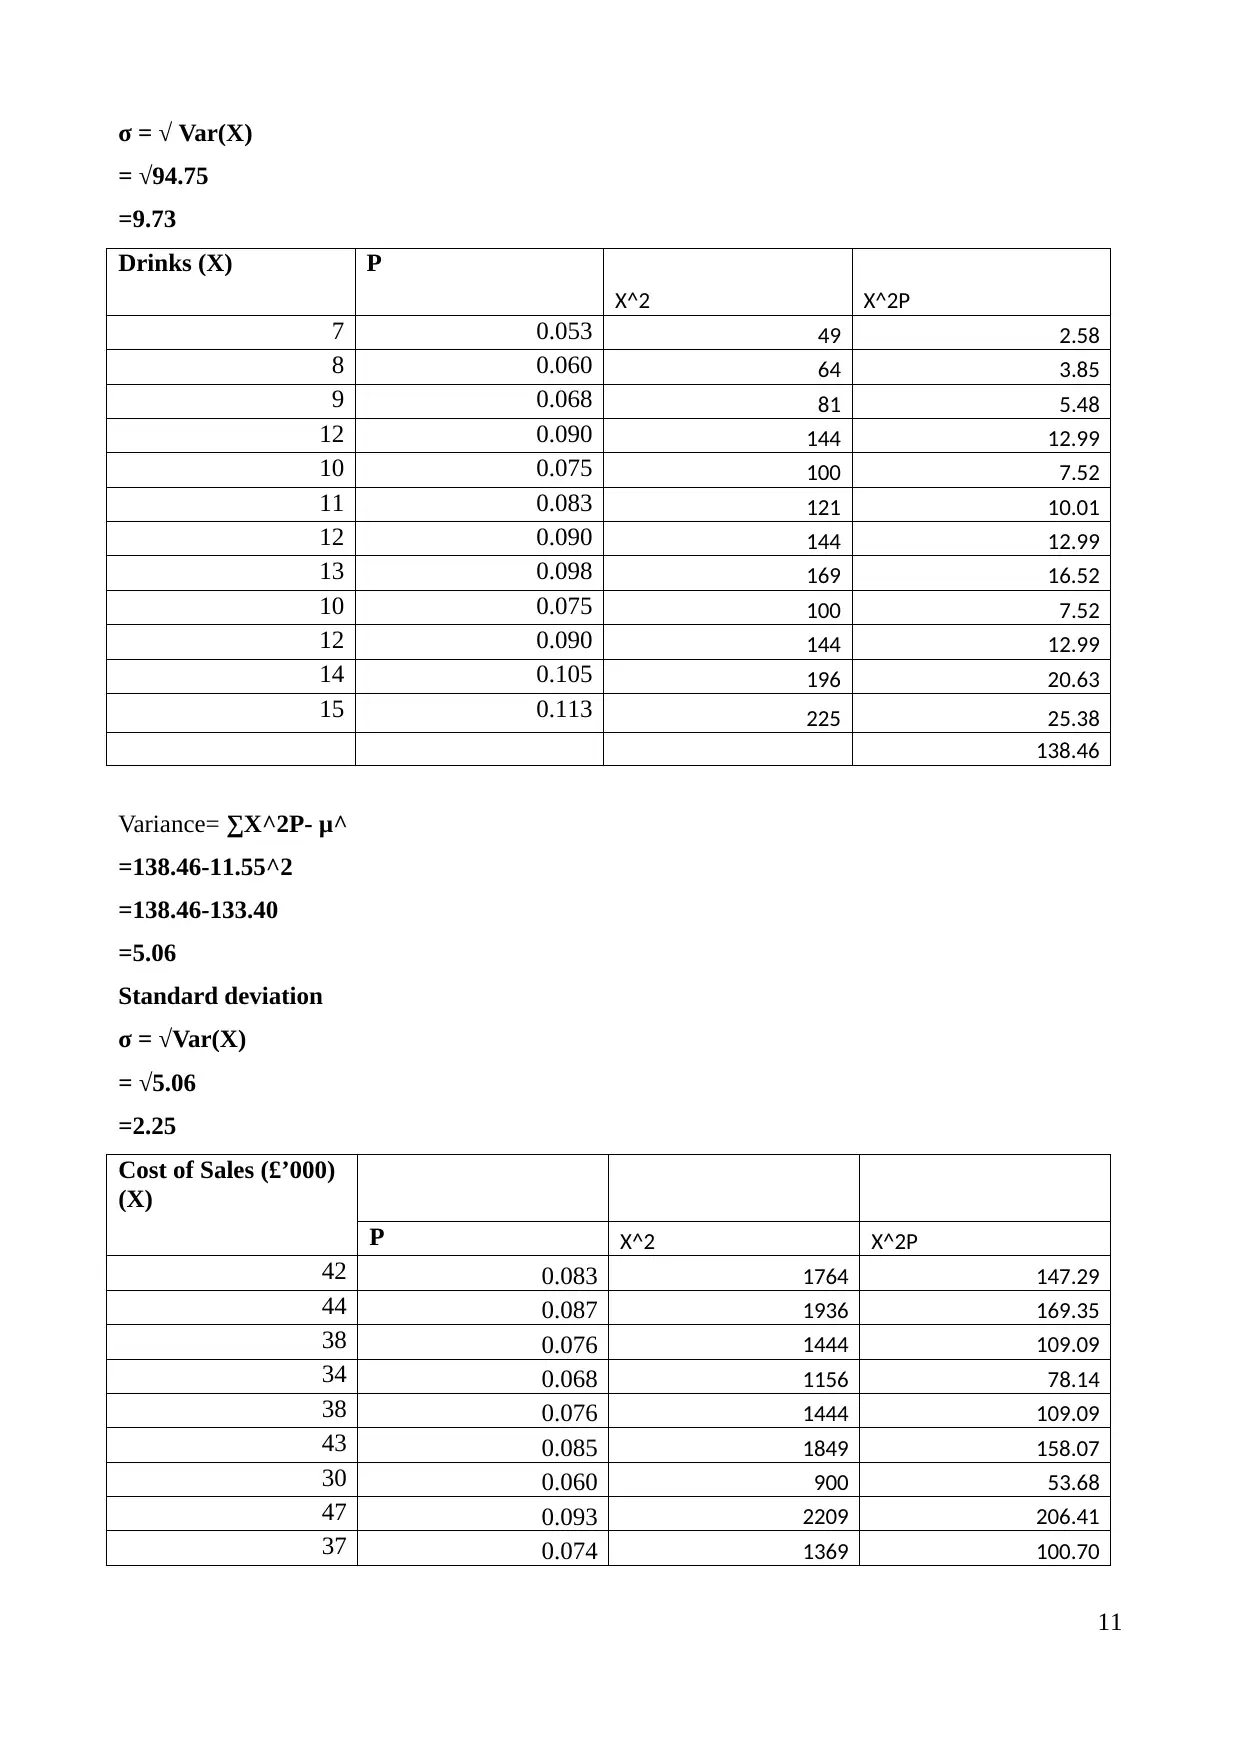
σ = √ Var(X)
= √94.75
=9.73
Drinks (X) P
X^2 X^2P
7 0.053 49 2.58
8 0.060 64 3.85
9 0.068 81 5.48
12 0.090 144 12.99
10 0.075 100 7.52
11 0.083 121 10.01
12 0.090 144 12.99
13 0.098 169 16.52
10 0.075 100 7.52
12 0.090 144 12.99
14 0.105 196 20.63
15 0.113 225 25.38
138.46
Variance= ∑X^2P- μ^
=138.46-11.55^2
=138.46-133.40
=5.06
Standard deviation
σ = √Var(X)
= √5.06
=2.25
Cost of Sales (£’000)
(X)
P X^2 X^2P
42 0.083 1764 147.29
44 0.087 1936 169.35
38 0.076 1444 109.09
34 0.068 1156 78.14
38 0.076 1444 109.09
43 0.085 1849 158.07
30 0.060 900 53.68
47 0.093 2209 206.41
37 0.074 1369 100.70
11
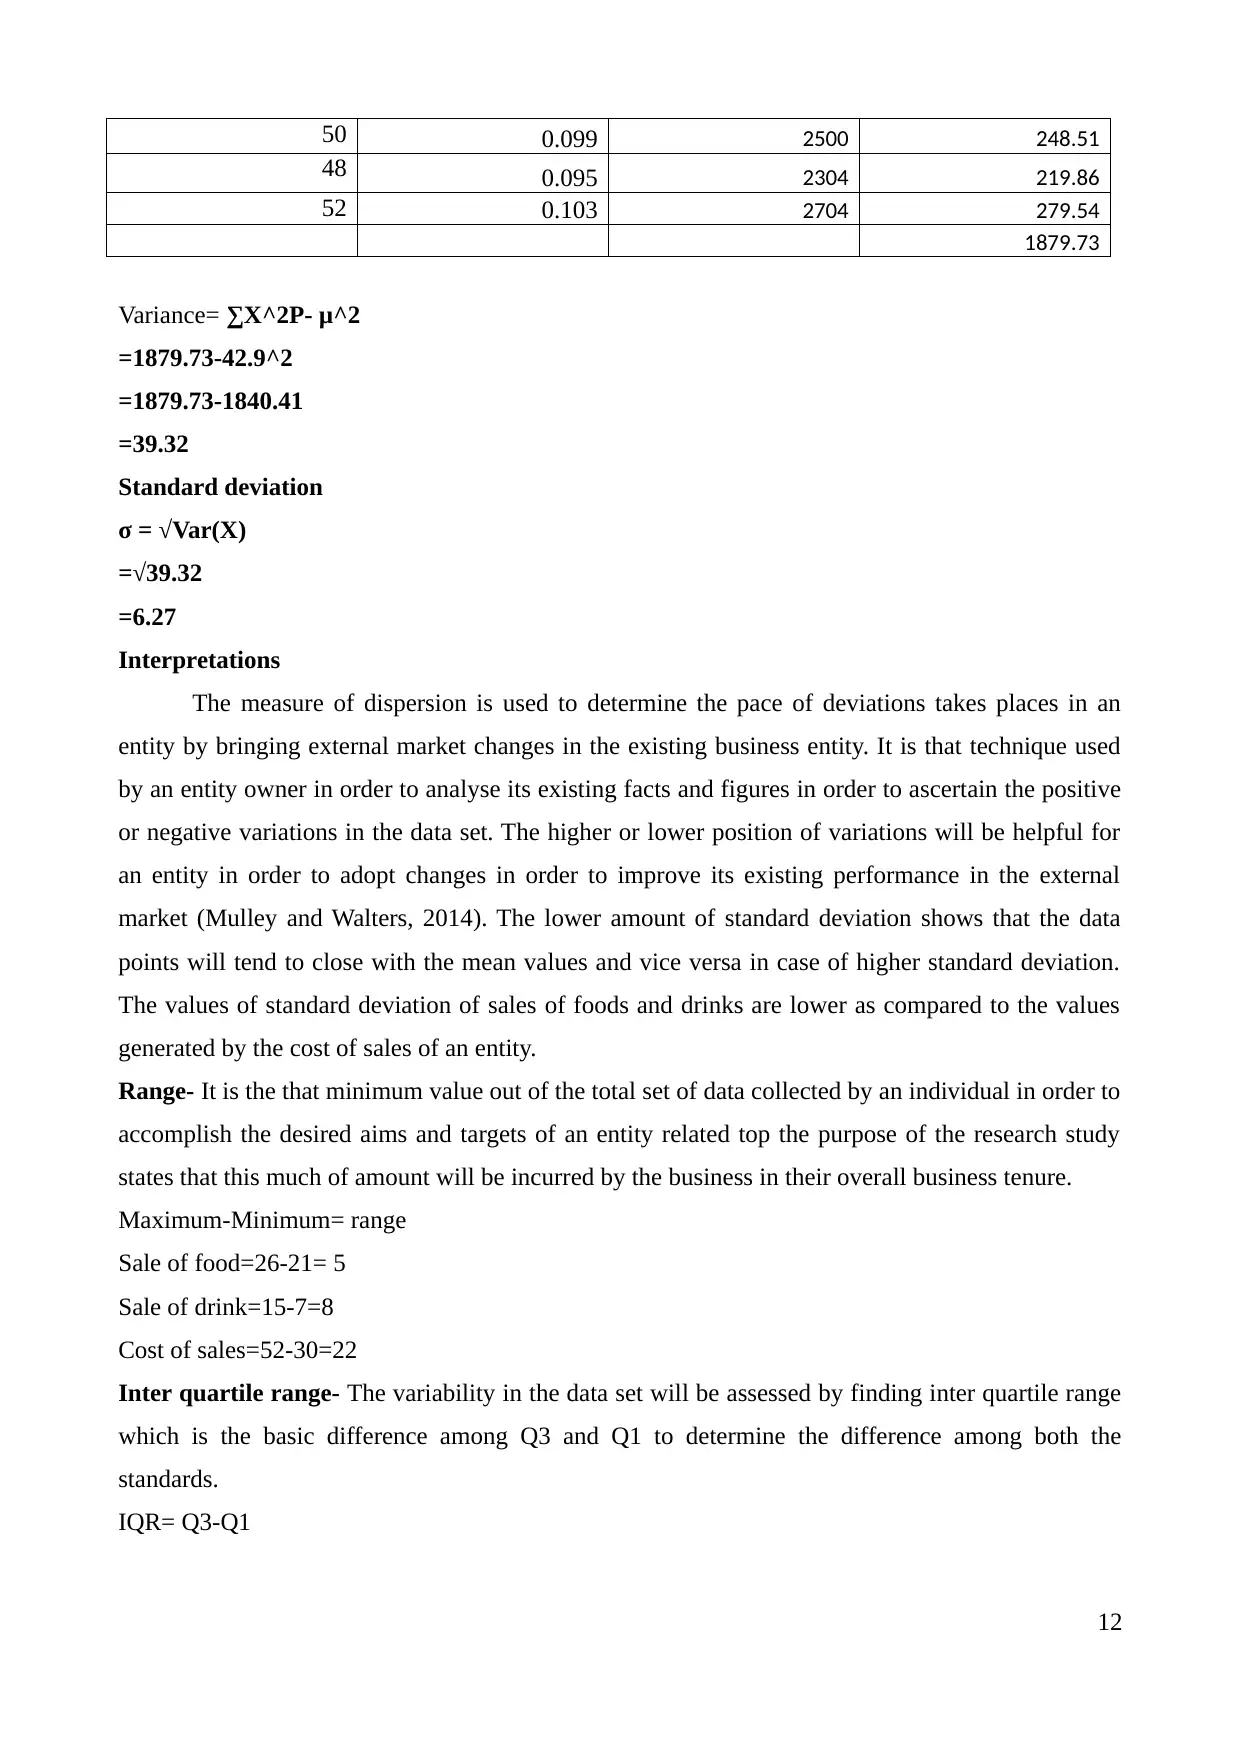
50 0.099 2500 248.51
48 0.095 2304 219.86
52 0.103 2704 279.54
1879.73
Variance= ∑X^2P- μ^2
=1879.73-42.9^2
=1879.73-1840.41
=39.32
Standard deviation
σ = √Var(X)
=√39.32
=6.27
Interpretations
The measure of dispersion is used to determine the pace of deviations takes places in an
entity by bringing external market changes in the existing business entity. It is that technique used
by an entity owner in order to analyse its existing facts and figures in order to ascertain the positive
or negative variations in the data set. The higher or lower position of variations will be helpful for
an entity in order to adopt changes in order to improve its existing performance in the external
market (Mulley and Walters, 2014). The lower amount of standard deviation shows that the data
points will tend to close with the mean values and vice versa in case of higher standard deviation.
The values of standard deviation of sales of foods and drinks are lower as compared to the values
generated by the cost of sales of an entity.
Range- It is the that minimum value out of the total set of data collected by an individual in order to
accomplish the desired aims and targets of an entity related top the purpose of the research study
states that this much of amount will be incurred by the business in their overall business tenure.
Maximum-Minimum= range
Sale of food=26-21= 5
Sale of drink=15-7=8
Cost of sales=52-30=22
Inter quartile range- The variability in the data set will be assessed by finding inter quartile range
which is the basic difference among Q3 and Q1 to determine the difference among both the
standards.
IQR= Q3-Q1
12
⊘ This is a preview!⊘
Do you want full access?
Subscribe today to unlock all pages.
Trusted by 1+ million students worldwide
1 out of 23
Related Documents


Your All-in-One AI-Powered Toolkit for Academic Success.
+13062052269
info@desklib.com
Available 24*7 on WhatsApp / Email
![[object Object]](/_next/static/media/star-bottom.7253800d.svg)
Unlock your academic potential
Copyright © 2020–2026 A2Z Services. All Rights Reserved. Developed and managed by ZUCOL.