Business Decision Making Report: Data Analysis and Interpretation
VerifiedAdded on 2020/02/05
|19
|3736
|361
Report
AI Summary
This report delves into business decision-making, utilizing statistical tools to analyze data and evaluate projects. It begins with an introduction to statistical methods, including mean, median, and mode, and their application to business data. Task 1 outlines the plan for data collection, sampling design, and a detailed questionnaire used for market research. Task 2 focuses on the calculation and interpretation of representative statistical values, measures of dispersion, and correlation. Task 3 presents a graphic representation of the collected data, trend line creation for prediction, and a formal business report summarizing the findings. Finally, Task 4 covers information processing tools, project planning, and evaluation techniques, including payback period, ARR, NPV, and IRR calculations, to determine the most viable project for the firm. The report provides charts, graphs, and tables to support the analysis and recommendations.

BUSINESS DECISION
MAKING
MAKING
Paraphrase This Document
Need a fresh take? Get an instant paraphrase of this document with our AI Paraphraser
TABLE OF CONTENTS
INTRODUCTION...........................................................................................................................4
TASK 1............................................................................................................................................4
1.1 Plan for collection of primary and secondary data...........................................................4
1.2 Sampling design for research...........................................................................................4
1.3 Questionnaire for research................................................................................................5
TASK 2............................................................................................................................................6
2.1 Representative values of statistical tools..........................................................................6
2.2 Analysis of results of mean median and mode.................................................................7
2.3 Measures of dispersion.....................................................................................................7
2.4 Calculation of quartile, percentile and correlation...........................................................8
TASK 3............................................................................................................................................9
3.1 Graphic representation of collected data..........................................................................9
3.2 Creation of trend line for prediction...............................................................................12
3.3 Covered in PPT...............................................................................................................12
3.4 Formal business report...................................................................................................12
TASK 4..........................................................................................................................................13
4.1 Information processing tools for business......................................................................13
4.2 Project plan for business project ....................................................................................14
4.3 Project evaluation techniques.........................................................................................15
CONCLUSION..............................................................................................................................17
INDEX OF TABLES
Table 1: Calculation of mean, median and mode............................................................................6
Table 2: Measures of dispersion......................................................................................................7
Table 3: Calculation of quartile and percentile................................................................................8
Table 4: Calculation of correlation..................................................................................................8
Table 5: Sales, cost and profit data..................................................................................................9
Table 6: Calculation of pay back period method...........................................................................16
Table 7: Calculation of ARR.........................................................................................................17
Table 8: Calculation of NPV..........................................................................................................17
Table 9: Calculation of IRR...........................................................................................................17
ILLUSTRATION INDEX
Illustration 1: Chart on sales, cost and profit data...........................................................................9
Illustration 2: People opinion on factors that greatly affect their purchase decisions...................10
Illustration 3: People opinion on Syngenta pricing policy.............................................................11
Illustration 4: Trend line for Sygenta.............................................................................................12
Illustration 5: GANTT chart..........................................................................................................14
Illustration 6: Network diagram.....................................................................................................15
⊘ This is a preview!⊘
Do you want full access?
Subscribe today to unlock all pages.
Trusted by 1+ million students worldwide
INTRODUCTION
Statistics is tool that is commonly used by the business firms to analyze huge set of data.
In this report, statistical tools like mean, median and mode is applied on data and results are
interpreted. In the middle part of the report primary data is analyzed by preparing a charts. In end
part of the report, project evaluation methods are described and their results are interpreted. On
the basis of calculation most viable project is selected for the firm.
TASK 1
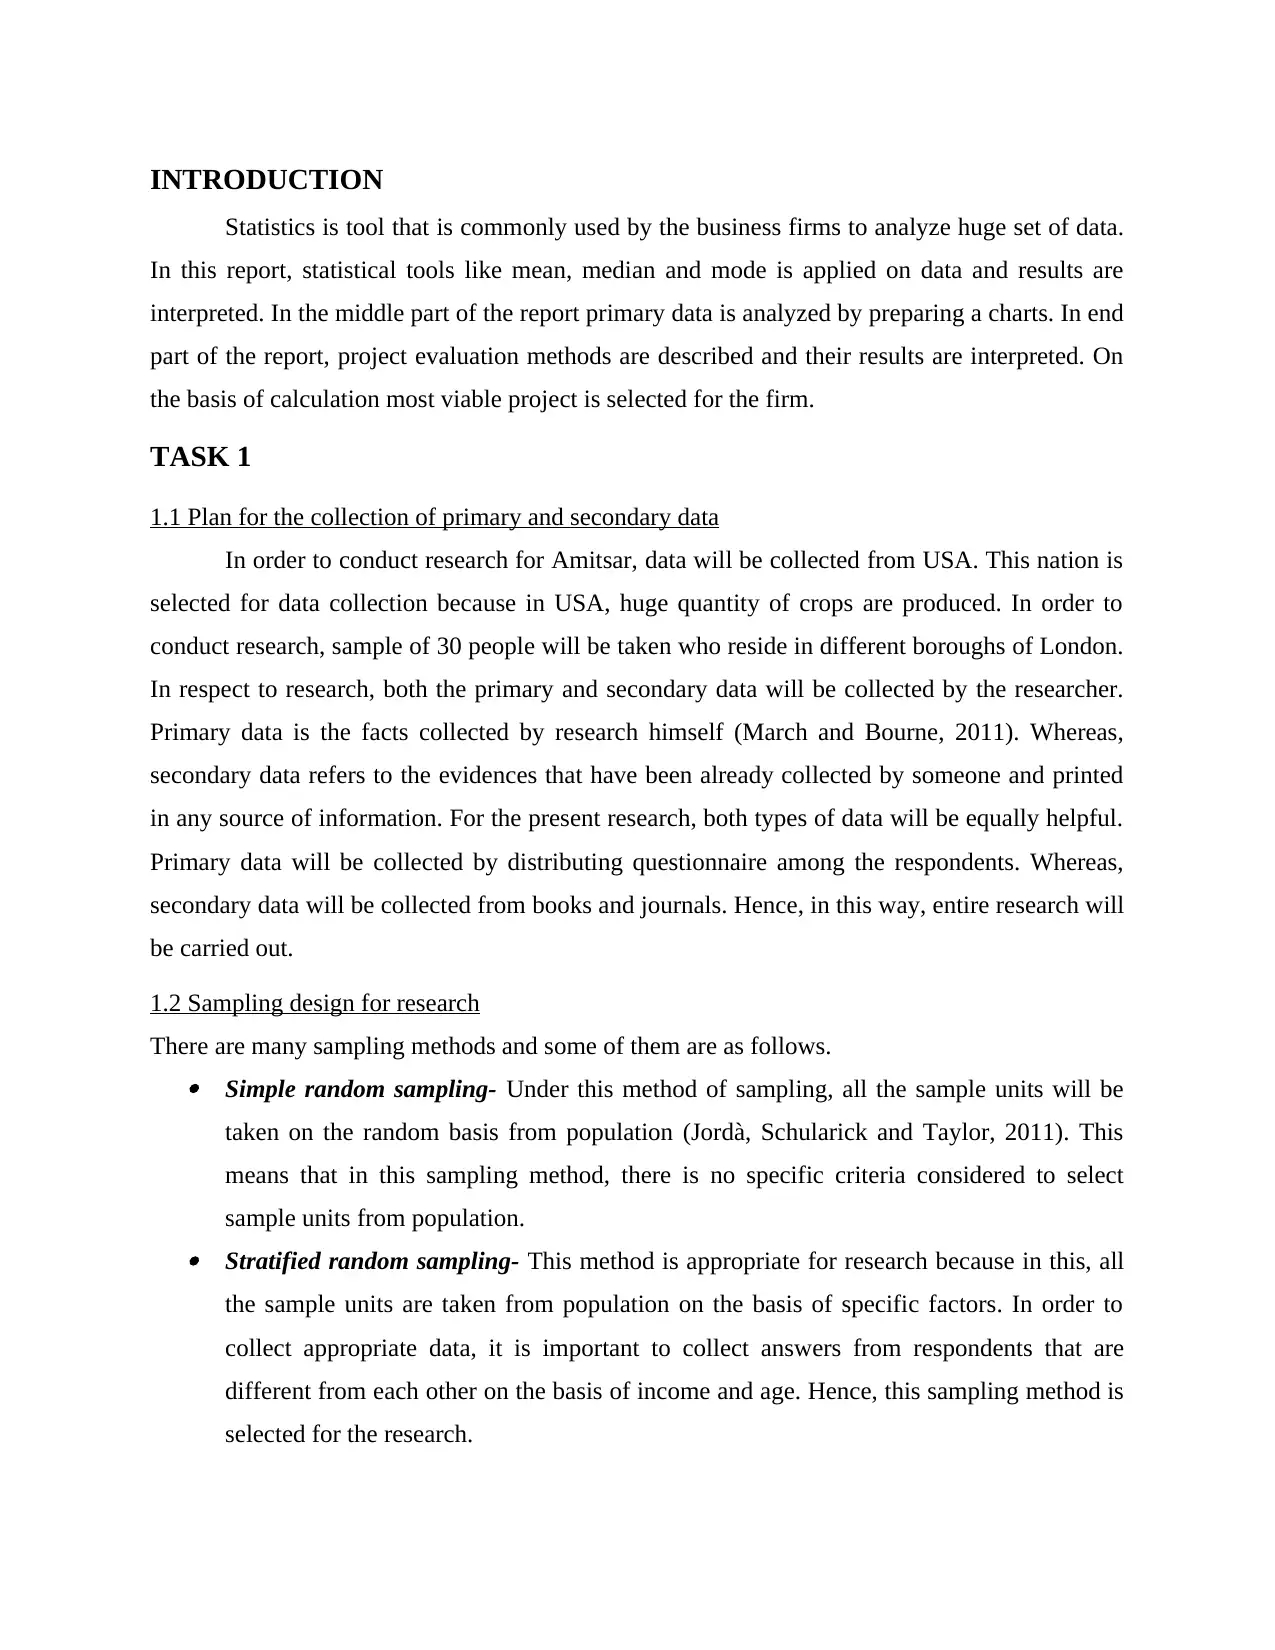
1.1 Plan for the collection of primary and secondary data
In order to conduct research for Amitsar, data will be collected from USA. This nation is
selected for data collection because in USA, huge quantity of crops are produced. In order to
conduct research, sample of 30 people will be taken who reside in different boroughs of London.
In respect to research, both the primary and secondary data will be collected by the researcher.
Primary data is the facts collected by research himself (March and Bourne, 2011). Whereas,
secondary data refers to the evidences that have been already collected by someone and printed
in any source of information. For the present research, both types of data will be equally helpful.
Primary data will be collected by distributing questionnaire among the respondents. Whereas,
secondary data will be collected from books and journals. Hence, in this way, entire research will
be carried out.
1.2 Sampling design for research
There are many sampling methods and some of them are as follows. Simple random sampling- Under this method of sampling, all the sample units will be
taken on the random basis from population (Jordà, Schularick and Taylor, 2011). This
means that in this sampling method, there is no specific criteria considered to select
sample units from population. Stratified random sampling- This method is appropriate for research because in this, all
the sample units are taken from population on the basis of specific factors. In order to
collect appropriate data, it is important to collect answers from respondents that are
different from each other on the basis of income and age. Hence, this sampling method is
selected for the research.
Statistics is tool that is commonly used by the business firms to analyze huge set of data.
In this report, statistical tools like mean, median and mode is applied on data and results are
interpreted. In the middle part of the report primary data is analyzed by preparing a charts. In end
part of the report, project evaluation methods are described and their results are interpreted. On
the basis of calculation most viable project is selected for the firm.
TASK 1
1.1 Plan for the collection of primary and secondary data
In order to conduct research for Amitsar, data will be collected from USA. This nation is
selected for data collection because in USA, huge quantity of crops are produced. In order to
conduct research, sample of 30 people will be taken who reside in different boroughs of London.
In respect to research, both the primary and secondary data will be collected by the researcher.
Primary data is the facts collected by research himself (March and Bourne, 2011). Whereas,
secondary data refers to the evidences that have been already collected by someone and printed
in any source of information. For the present research, both types of data will be equally helpful.
Primary data will be collected by distributing questionnaire among the respondents. Whereas,
secondary data will be collected from books and journals. Hence, in this way, entire research will
be carried out.
1.2 Sampling design for research
There are many sampling methods and some of them are as follows. Simple random sampling- Under this method of sampling, all the sample units will be
taken on the random basis from population (Jordà, Schularick and Taylor, 2011). This
means that in this sampling method, there is no specific criteria considered to select
sample units from population. Stratified random sampling- This method is appropriate for research because in this, all
the sample units are taken from population on the basis of specific factors. In order to
collect appropriate data, it is important to collect answers from respondents that are
different from each other on the basis of income and age. Hence, this sampling method is
selected for the research.
Paraphrase This Document
Need a fresh take? Get an instant paraphrase of this document with our AI Paraphraser
Cluster sampling- In this method, geographic area is divided into several parts and
sample units are taken from same. This method is used in population census.
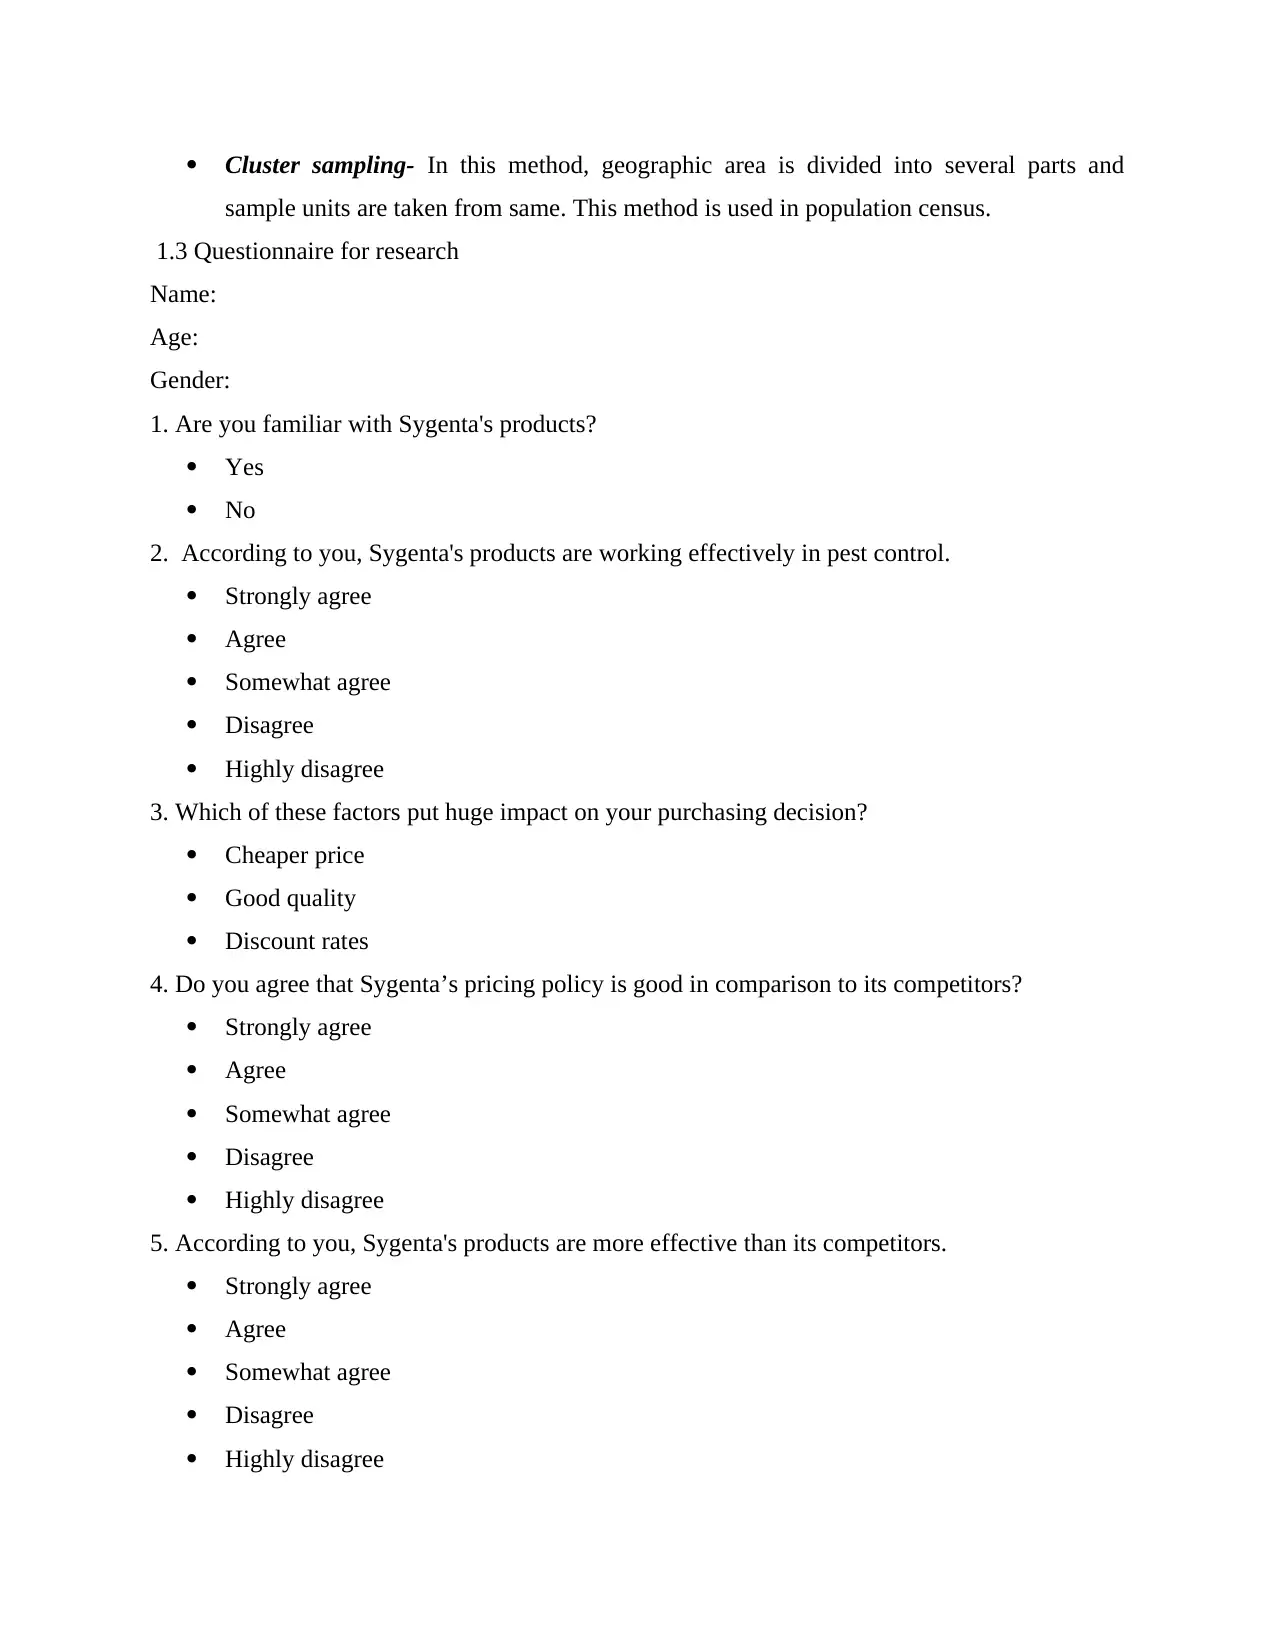
1.3 Questionnaire for research
Name:
Age:
Gender:
1. Are you familiar with Sygenta's products?
Yes
No
2. According to you, Sygenta's products are working effectively in pest control.
Strongly agree
Agree
Somewhat agree
Disagree
Highly disagree
3. Which of these factors put huge impact on your purchasing decision?
Cheaper price
Good quality
Discount rates
4. Do you agree that Sygenta’s pricing policy is good in comparison to its competitors?
Strongly agree
Agree
Somewhat agree
Disagree
Highly disagree
5. According to you, Sygenta's products are more effective than its competitors.
Strongly agree
Agree
Somewhat agree
Disagree
Highly disagree
sample units are taken from same. This method is used in population census.
1.3 Questionnaire for research
Name:
Age:
Gender:
1. Are you familiar with Sygenta's products?
Yes
No
2. According to you, Sygenta's products are working effectively in pest control.
Strongly agree
Agree
Somewhat agree
Disagree
Highly disagree
3. Which of these factors put huge impact on your purchasing decision?
Cheaper price
Good quality
Discount rates
4. Do you agree that Sygenta’s pricing policy is good in comparison to its competitors?
Strongly agree
Agree
Somewhat agree
Disagree
Highly disagree
5. According to you, Sygenta's products are more effective than its competitors.
Strongly agree
Agree
Somewhat agree
Disagree
Highly disagree
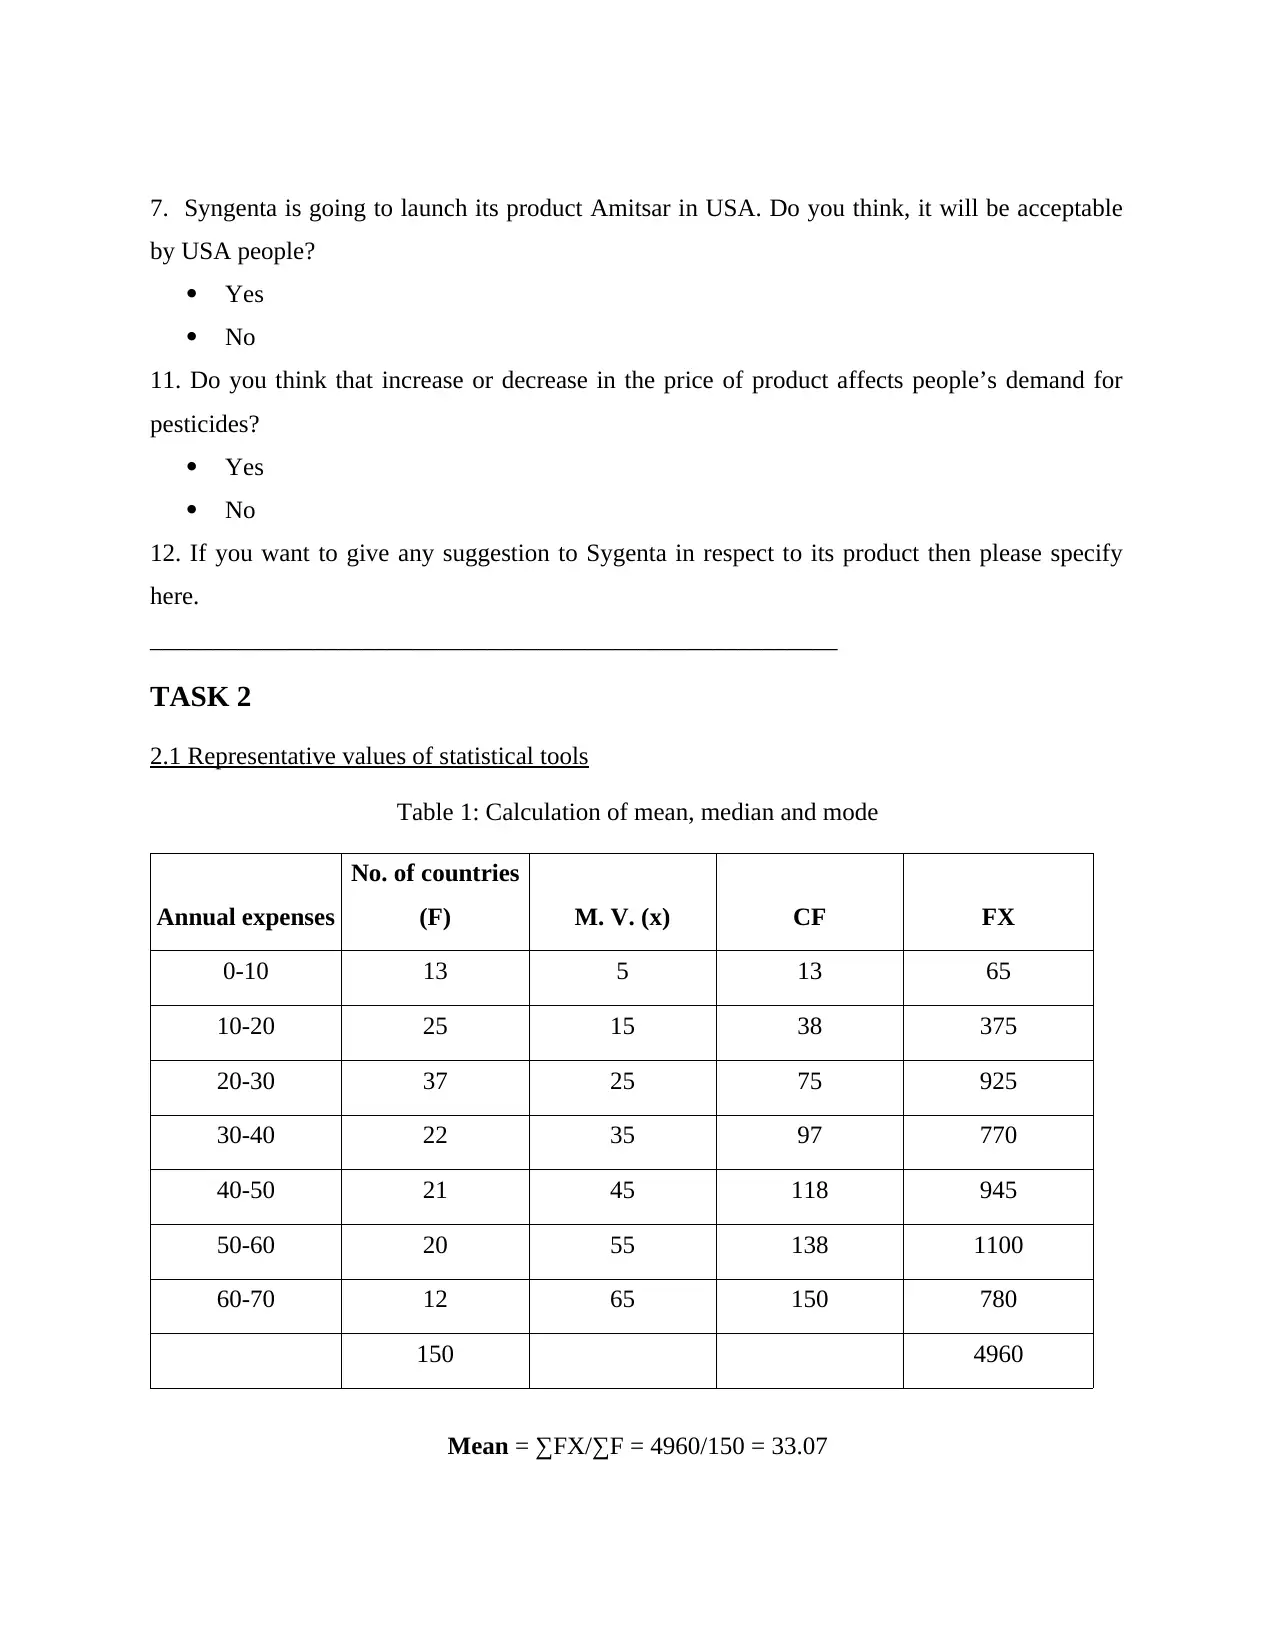
7. Syngenta is going to launch its product Amitsar in USA. Do you think, it will be acceptable
by USA people?
Yes
No
11. Do you think that increase or decrease in the price of product affects people’s demand for
pesticides?
Yes
No
12. If you want to give any suggestion to Sygenta in respect to its product then please specify
here.
_______________________________________________________
TASK 2
2.1 Representative values of statistical tools
Table 1: Calculation of mean, median and mode
Annual expenses
No. of countries
(F) M. V. (x) CF FX
0-10 13 5 13 65
10-20 25 15 38 375
20-30 37 25 75 925
30-40 22 35 97 770
40-50 21 45 118 945
50-60 20 55 138 1100
60-70 12 65 150 780
150 4960
Mean = ∑FX/∑F = 4960/150 = 33.07
⊘ This is a preview!⊘
Do you want full access?
Subscribe today to unlock all pages.
Trusted by 1+ million students worldwide
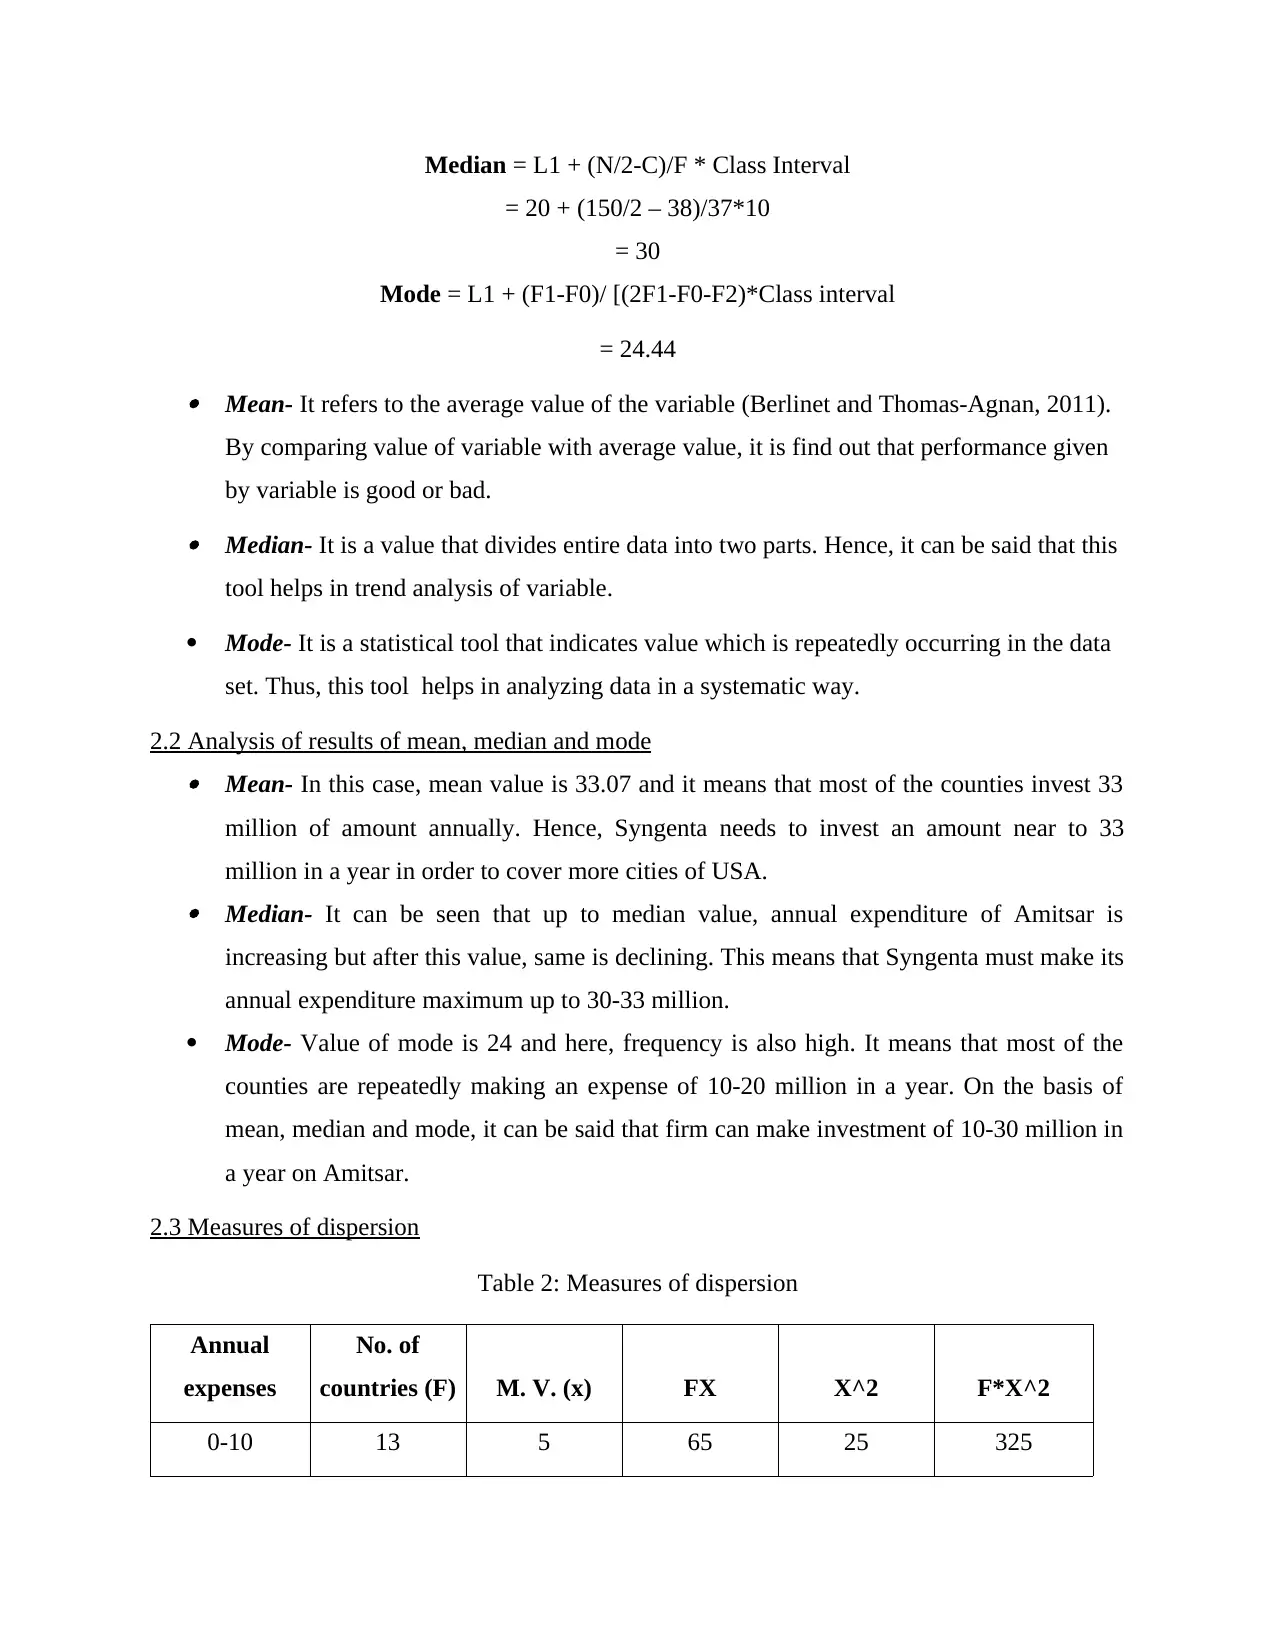
Median = L1 + (N/2-C)/F * Class Interval
= 20 + (150/2 – 38)/37*10
= 30
Mode = L1 + (F1-F0)/ [(2F1-F0-F2)*Class interval
= 24.44 Mean- It refers to the average value of the variable (Berlinet and Thomas-Agnan, 2011).
By comparing value of variable with average value, it is find out that performance given
by variable is good or bad. Median- It is a value that divides entire data into two parts. Hence, it can be said that this
tool helps in trend analysis of variable.
Mode- It is a statistical tool that indicates value which is repeatedly occurring in the data
set. Thus, this tool helps in analyzing data in a systematic way.
2.2 Analysis of results of mean, median and mode Mean- In this case, mean value is 33.07 and it means that most of the counties invest 33
million of amount annually. Hence, Syngenta needs to invest an amount near to 33
million in a year in order to cover more cities of USA. Median- It can be seen that up to median value, annual expenditure of Amitsar is
increasing but after this value, same is declining. This means that Syngenta must make its
annual expenditure maximum up to 30-33 million.
Mode- Value of mode is 24 and here, frequency is also high. It means that most of the
counties are repeatedly making an expense of 10-20 million in a year. On the basis of
mean, median and mode, it can be said that firm can make investment of 10-30 million in
a year on Amitsar.
2.3 Measures of dispersion
Table 2: Measures of dispersion
Annual
expenses
No. of
countries (F) M. V. (x) FX X^2 F*X^2
0-10 13 5 65 25 325
Paraphrase This Document
Need a fresh take? Get an instant paraphrase of this document with our AI Paraphraser
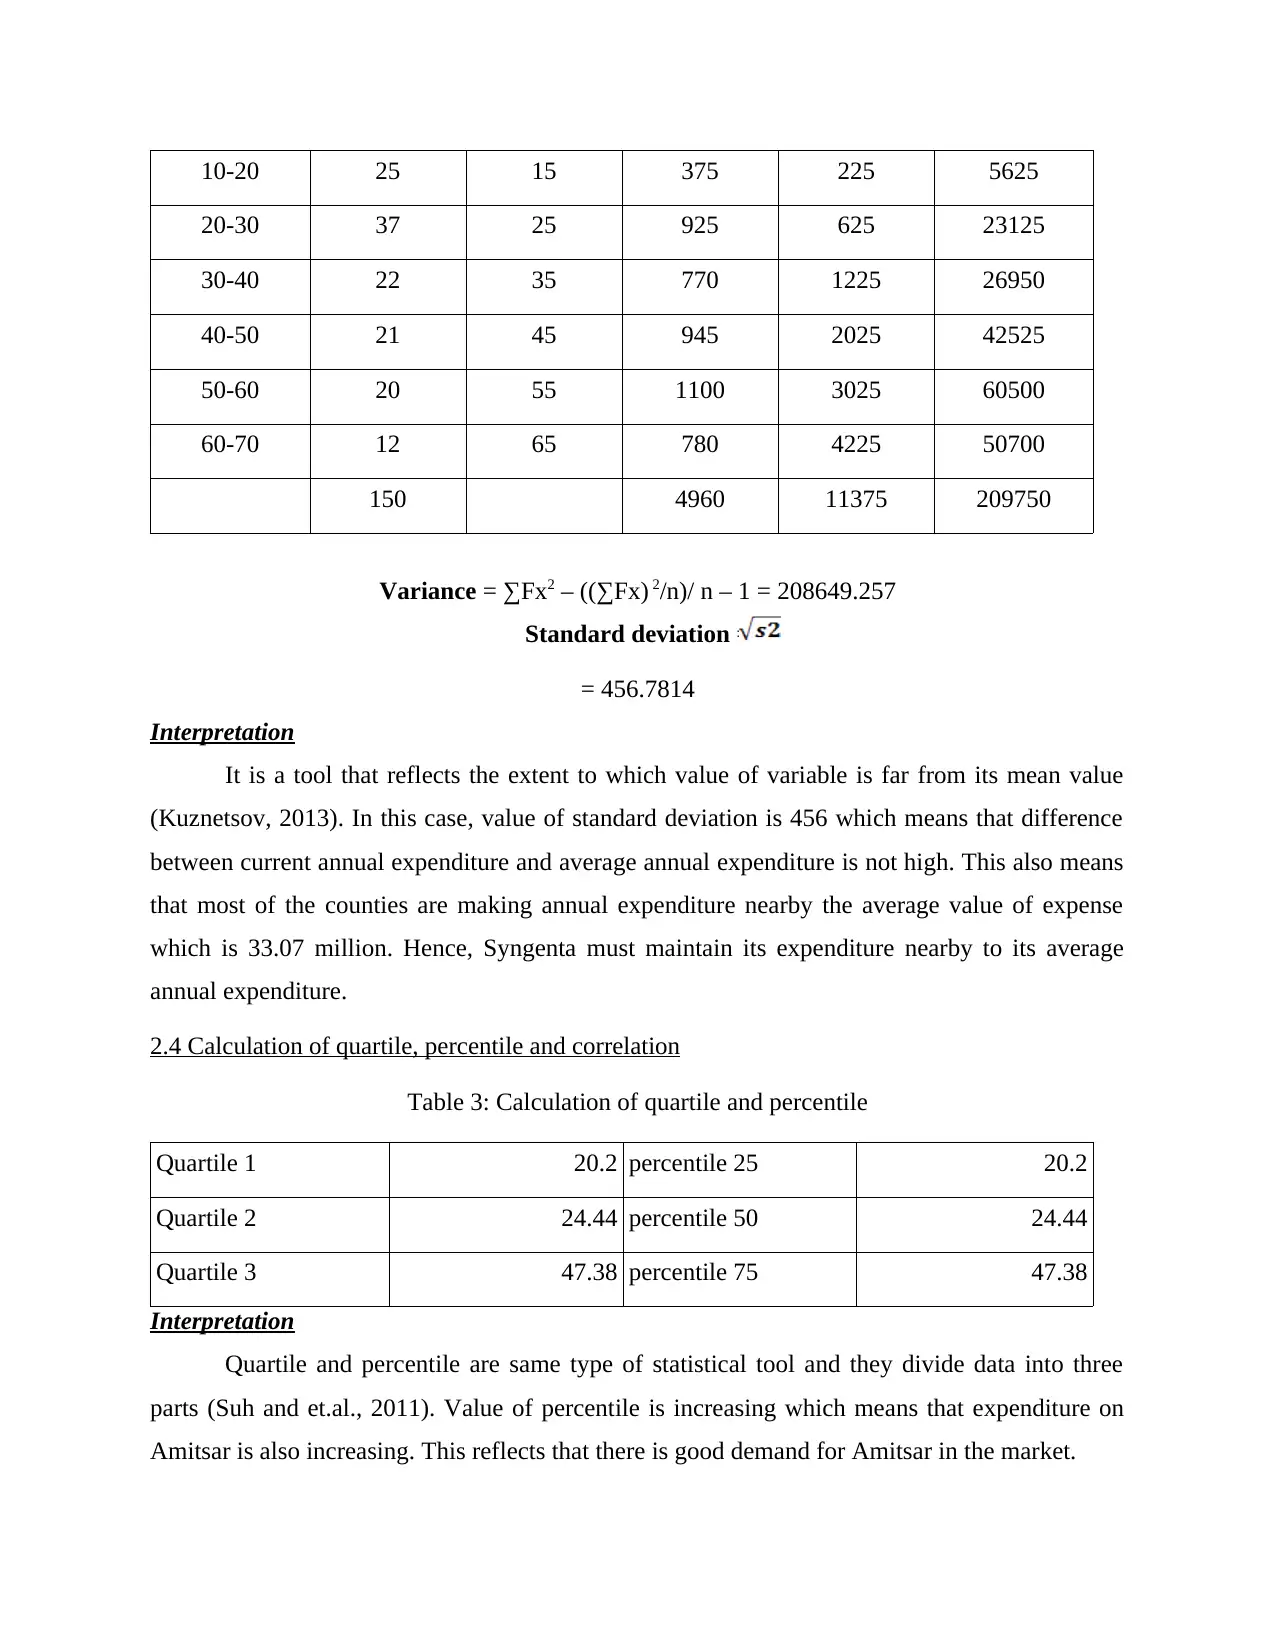
10-20 25 15 375 225 5625
20-30 37 25 925 625 23125
30-40 22 35 770 1225 26950
40-50 21 45 945 2025 42525
50-60 20 55 1100 3025 60500
60-70 12 65 780 4225 50700
150 4960 11375 209750
Variance = ∑Fx2 – ((∑Fx) 2/n)/ n – 1 = 208649.257
Standard deviation =
= 456.7814
Interpretation
It is a tool that reflects the extent to which value of variable is far from its mean value
(Kuznetsov, 2013). In this case, value of standard deviation is 456 which means that difference
between current annual expenditure and average annual expenditure is not high. This also means
that most of the counties are making annual expenditure nearby the average value of expense
which is 33.07 million. Hence, Syngenta must maintain its expenditure nearby to its average
annual expenditure.
2.4 Calculation of quartile, percentile and correlation
Table 3: Calculation of quartile and percentile
Quartile 1 20.2 percentile 25 20.2
Quartile 2 24.44 percentile 50 24.44
Quartile 3 47.38 percentile 75 47.38
Interpretation
Quartile and percentile are same type of statistical tool and they divide data into three
parts (Suh and et.al., 2011). Value of percentile is increasing which means that expenditure on
Amitsar is also increasing. This reflects that there is good demand for Amitsar in the market.
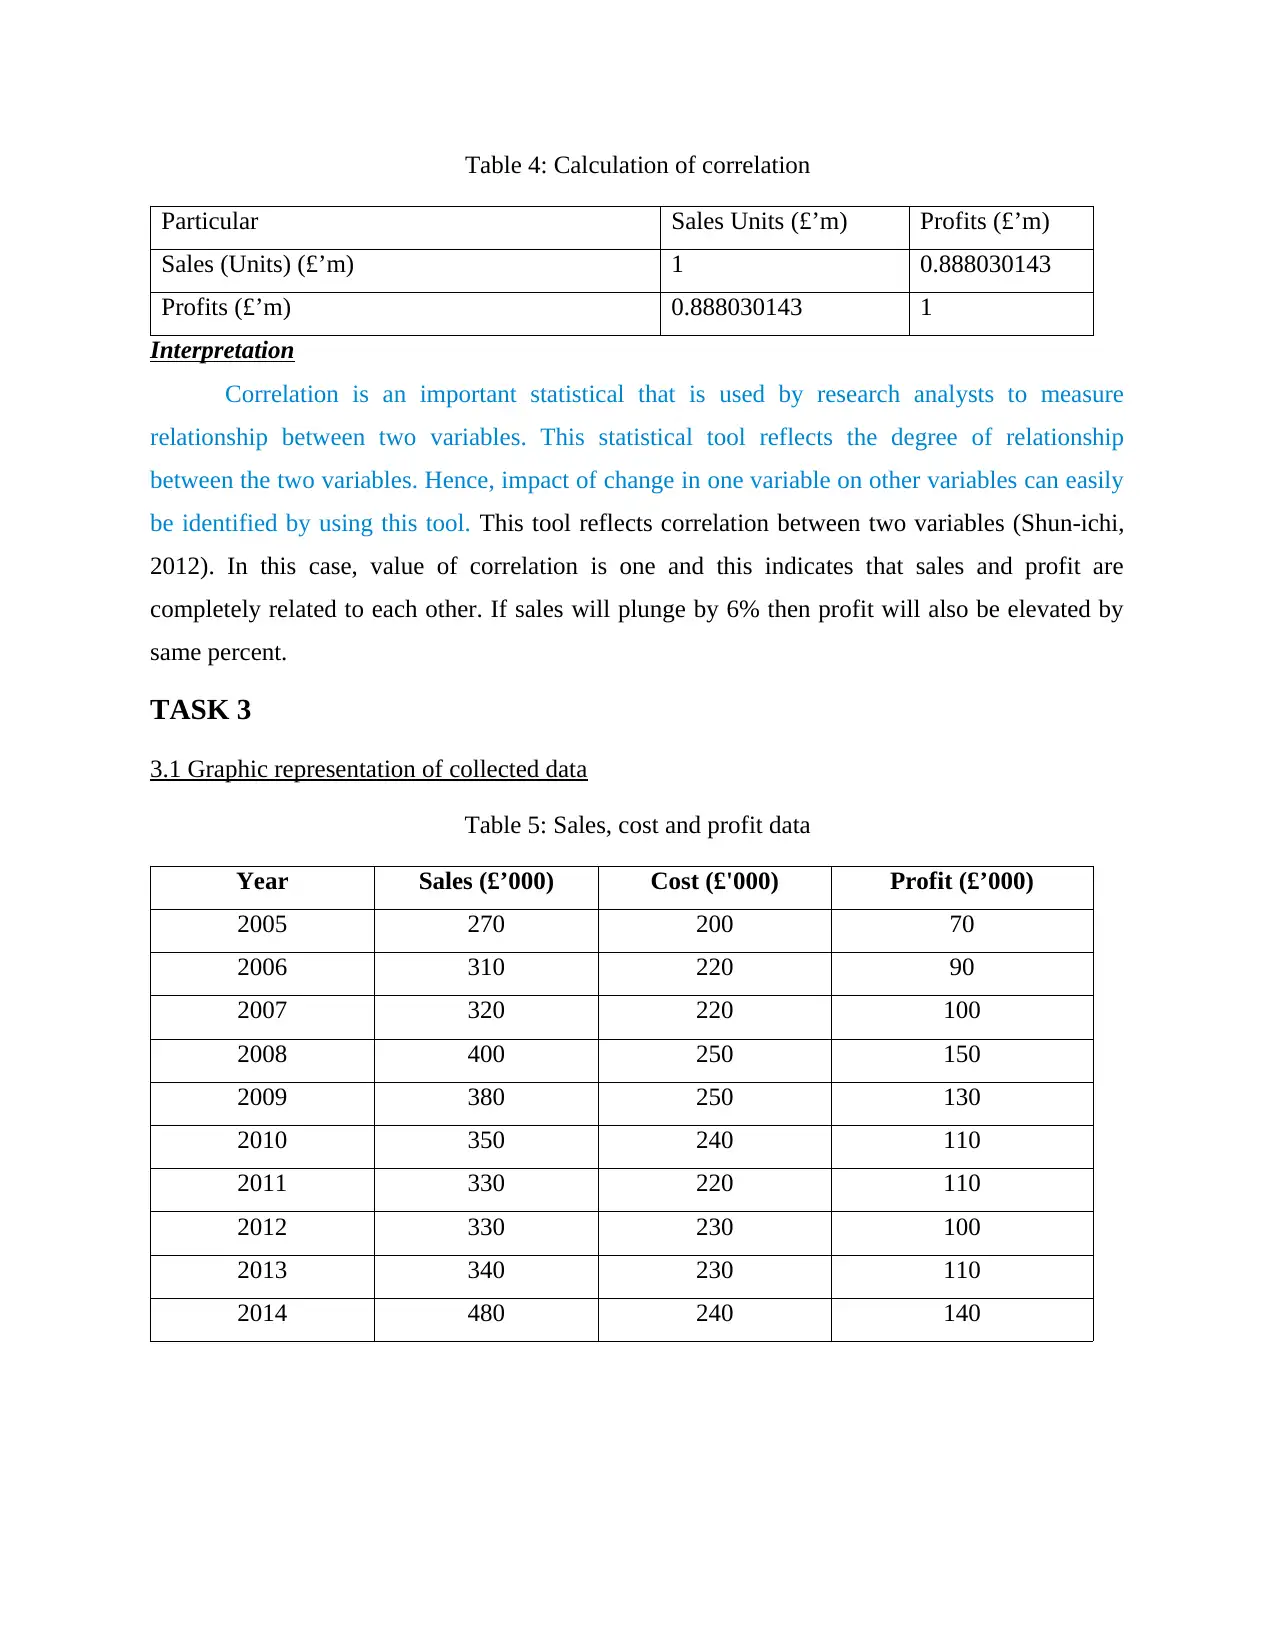
Table 4: Calculation of correlation
Particular Sales Units (£’m) Profits (£’m)
Sales (Units) (£’m) 1 0.888030143
Profits (£’m) 0.888030143 1
Interpretation
Correlation is an important statistical that is used by research analysts to measure
relationship between two variables. This statistical tool reflects the degree of relationship
between the two variables. Hence, impact of change in one variable on other variables can easily
be identified by using this tool. This tool reflects correlation between two variables (Shun-ichi,
2012). In this case, value of correlation is one and this indicates that sales and profit are
completely related to each other. If sales will plunge by 6% then profit will also be elevated by
same percent.
TASK 3
3.1 Graphic representation of collected data
Table 5: Sales, cost and profit data
Year Sales (£’000) Cost (£'000) Profit (£’000)
2005 270 200 70
2006 310 220 90
2007 320 220 100
2008 400 250 150
2009 380 250 130
2010 350 240 110
2011 330 220 110
2012 330 230 100
2013 340 230 110
2014 480 240 140
⊘ This is a preview!⊘
Do you want full access?
Subscribe today to unlock all pages.
Trusted by 1+ million students worldwide
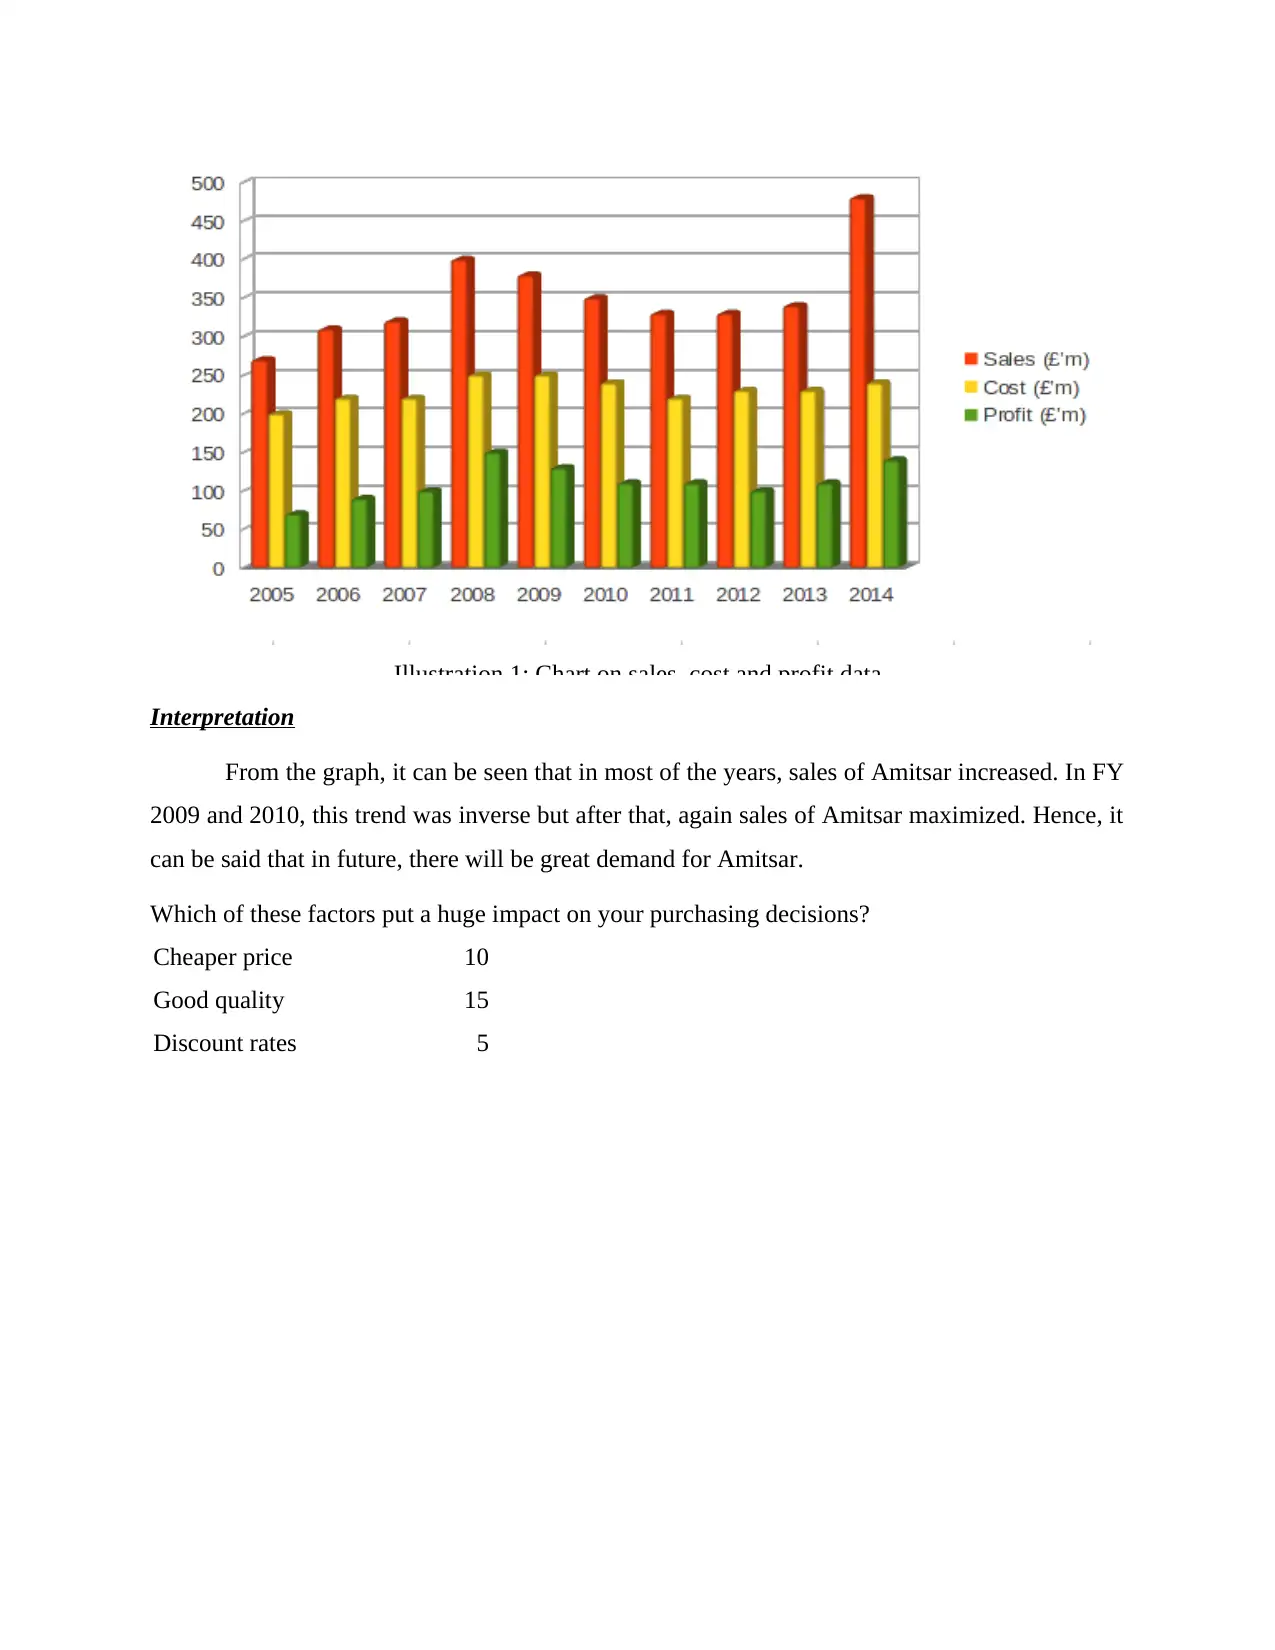
Illustration 1: Chart on sales, cost and profit data
Interpretation
From the graph, it can be seen that in most of the years, sales of Amitsar increased. In FY
2009 and 2010, this trend was inverse but after that, again sales of Amitsar maximized. Hence, it
can be said that in future, there will be great demand for Amitsar.
Which of these factors put a huge impact on your purchasing decisions?
Cheaper price 10
Good quality 15
Discount rates 5
Paraphrase This Document
Need a fresh take? Get an instant paraphrase of this document with our AI Paraphraser
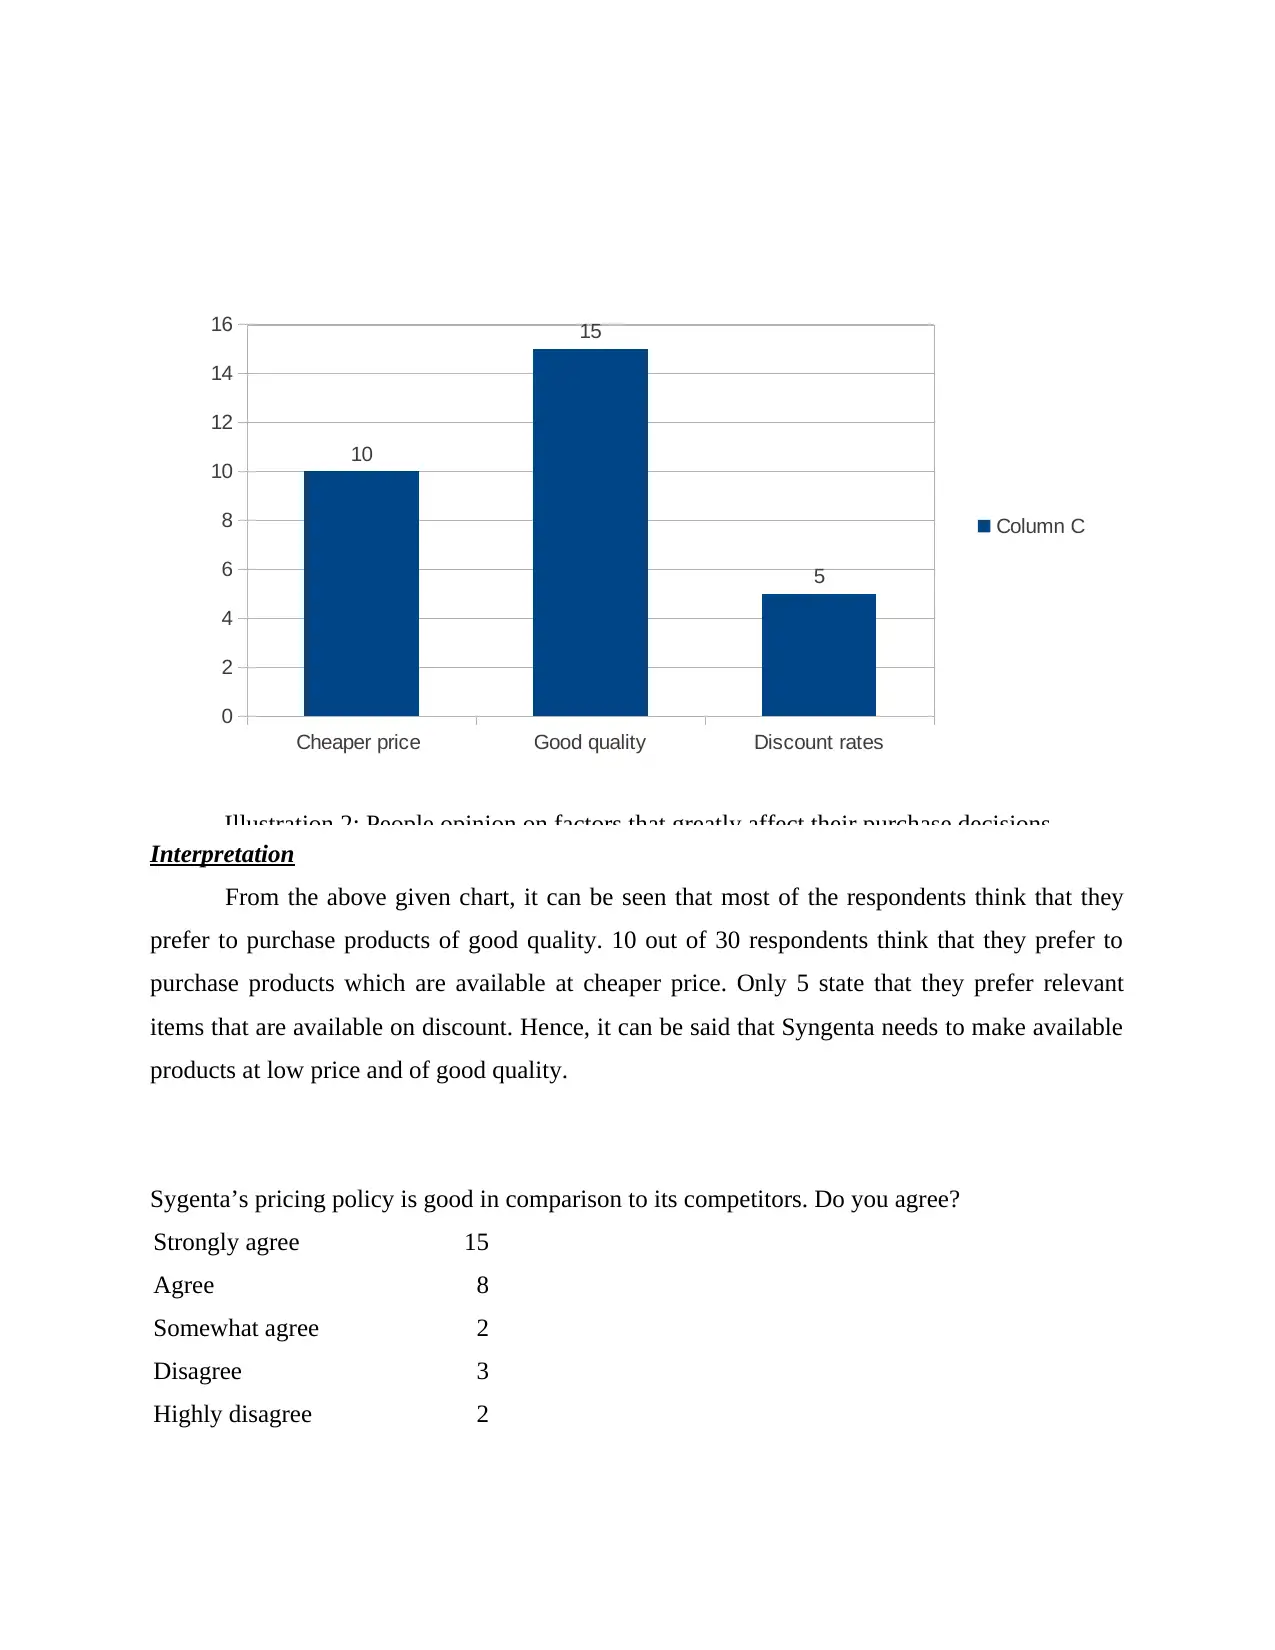
Interpretation
From the above given chart, it can be seen that most of the respondents think that they
prefer to purchase products of good quality. 10 out of 30 respondents think that they prefer to
purchase products which are available at cheaper price. Only 5 state that they prefer relevant
items that are available on discount. Hence, it can be said that Syngenta needs to make available
products at low price and of good quality.
Sygenta’s pricing policy is good in comparison to its competitors. Do you agree?
Strongly agree 15
Agree 8
Somewhat agree 2
Disagree 3
Highly disagree 2
Cheaper price Good quality Discount rates
0
2
4
6
8
10
12
14
16
10
15
5
Column C
Illustration 2: People opinion on factors that greatly affect their purchase decisions
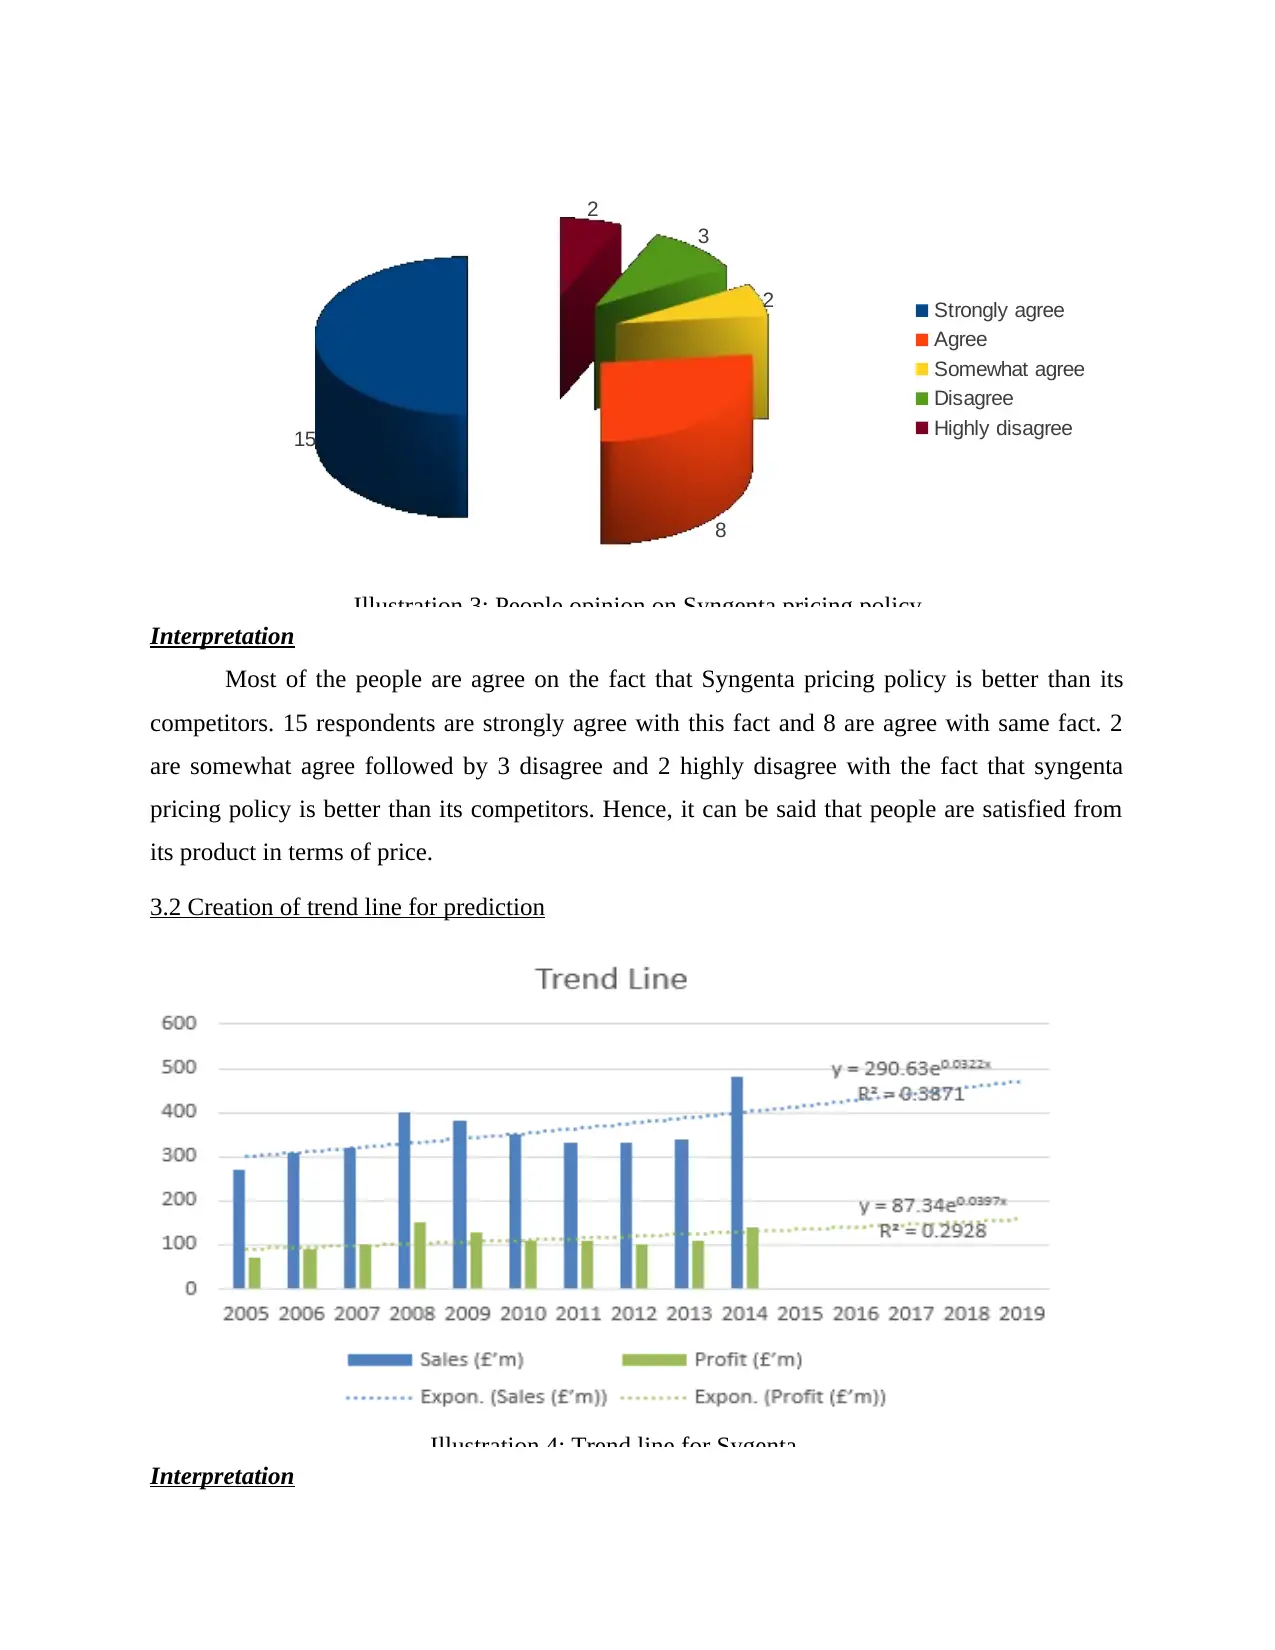
Interpretation
Most of the people are agree on the fact that Syngenta pricing policy is better than its
competitors. 15 respondents are strongly agree with this fact and 8 are agree with same fact. 2
are somewhat agree followed by 3 disagree and 2 highly disagree with the fact that syngenta
pricing policy is better than its competitors. Hence, it can be said that people are satisfied from
its product in terms of price.
3.2 Creation of trend line for prediction
Illustration 4: Trend line for Sygenta
Interpretation
15
8
2
3
2
Strongly agree
Agree
Somewhat agree
Disagree
Highly disagree
Illustration 3: People opinion on Syngenta pricing policy
⊘ This is a preview!⊘
Do you want full access?
Subscribe today to unlock all pages.
Trusted by 1+ million students worldwide
1 out of 19
Related Documents


Your All-in-One AI-Powered Toolkit for Academic Success.
+13062052269
info@desklib.com
Available 24*7 on WhatsApp / Email
![[object Object]](/_next/static/media/star-bottom.7253800d.svg)
Unlock your academic potential
Copyright © 2020–2026 A2Z Services. All Rights Reserved. Developed and managed by ZUCOL.