Business Decision Making Report: Statistical Analysis of Data
VerifiedAdded on 2020/06/04
|17
|3658
|120
Report
AI Summary
This report focuses on business decision-making for Thomas Cook Plc, a tour operator planning a new product. It covers data collection methods, including primary (online questionnaires) and secondary data (annual reports), and survey methodology with simple random sampling. The report presents a questionnaire designed to gather consumer preferences. Statistical analysis is performed, including calculating mean, median, mode, and standard deviation to determine optimal pricing strategies. Results are analyzed to draw conclusions and recommendations for pricing and product development. The report also touches upon measures of dispersion, quartiles, percentiles, correlation coefficient, and investment appraisal techniques to aid in effective decision-making. Finally, it presents graphs, charts, trend line graphs, business presentations, and formal business reports to present findings and recommendations for Thomas Cook Plc.

UNIT 6 BDM
Paraphrase This Document
Need a fresh take? Get an instant paraphrase of this document with our AI Paraphraser
TABLE OF CONTENTS
INTRODUCTION...........................................................................................................................1
TASK 1............................................................................................................................................1
1.1 Producing plan for collecting data....................................................................................1
1.2 Presenting survey methodology.......................................................................................2
1.3 Questionnaire....................................................................................................................2
TASK 2............................................................................................................................................4
2.1 Summarising raw data......................................................................................................4
2.2 Analysing results and drawing out conclusion.................................................................6
2.3 Measures of dispersion.....................................................................................................7
2.4 Quartiles, percentiles and correlation coefficient.............................................................8
TASK 3............................................................................................................................................8
3.1 Presenting graphs and charts............................................................................................8
3.2 Trend line graphs............................................................................................................12
3.3 Business presentation.....................................................................................................13
3.4 Formal business report...................................................................................................13
TASK 4..........................................................................................................................................14
4.1 Information processing tools..........................................................................................14
4.2 Project plan and critical path..........................................................................................15
4.3 Investment appraisal techniques.....................................................................................15
CONCLUSION..............................................................................................................................17
REFERENCES..............................................................................................................................18
INTRODUCTION
Business decision-making is crucial for organisation so that it may flourish in the market
quite effectively. The present report deals with Thomas Cook Plc which is engaged in tour
operations is planning for designing new tour product so that it may achieve more revenue with
much ease. Various statistical methods such as mean, median, mode and standard deviation are
carried out to make decision. Moreover, investment appraisal techniques are also used to make
decision for the betterment of the company.
TASK 1
1.1 Producing plan for collecting data
Data collection is quite essential so that appropriate decisions can be taken with much
ease. Thomas Cook Plc which has great name in the travel and tourism sector. It is required to
collect information so that new product may be developed and launch to satisfy customers. Data
collection is required so that market analysis can be done by the company regarding consumer
preferences, tastes. Data can be collected through two ways such as primary and secondary data.
Primary data is collected for the first time and as such, it is first handed data to be used by the
researcher. Whereas, secondary data is second-handed data already used by the researcher
(Pettigrew, 2014).
The plan for collecting primary data is that online questionnaires may be provided so that
they may answer those within stipulated time. It is quite easier method which help management
to have clear understanding of consumer preferences so that appropriate information may be
gathered to develop and launch new tour product in effective way. Online questionnaires are
quite cost effective for the firm and data can be easily gathered. Responses can be easily
analysed to draw valid conclusions (Sutherland and Holstead, 2014).
In addition to this, plan for collecting secondary data is that Thomas Cook's annual report
for past years can be taken so that relevant information may be gathered. Annual report provides
clear information regarding sales made and income generated by the company and is good source
for assessing the financial health of organisation in effective way. Thus, the plan for data
collection through primary and secondary method can be implemented to generate adequate
information.
1
⊘ This is a preview!⊘
Do you want full access?
Subscribe today to unlock all pages.
Trusted by 1+ million students worldwide
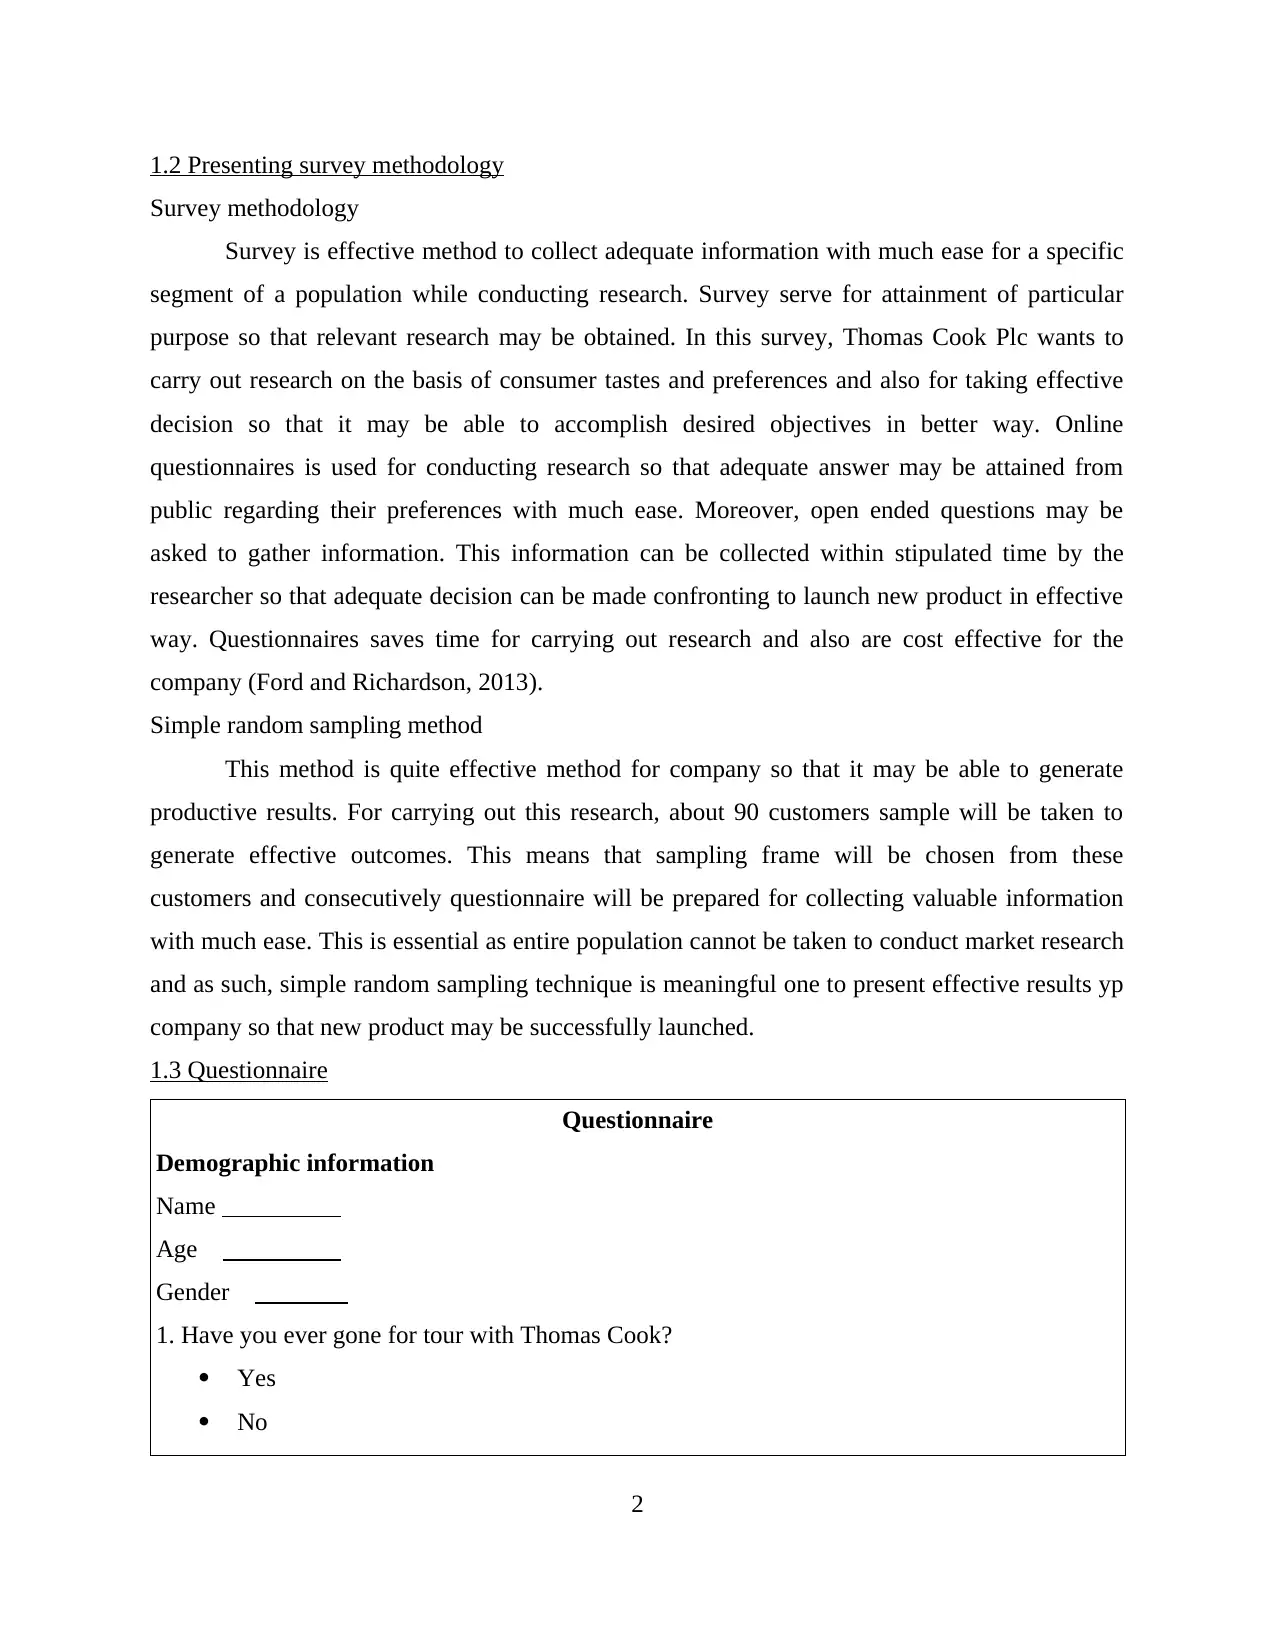
1.2 Presenting survey methodology
Survey methodology
Survey is effective method to collect adequate information with much ease for a specific
segment of a population while conducting research. Survey serve for attainment of particular
purpose so that relevant research may be obtained. In this survey, Thomas Cook Plc wants to
carry out research on the basis of consumer tastes and preferences and also for taking effective
decision so that it may be able to accomplish desired objectives in better way. Online
questionnaires is used for conducting research so that adequate answer may be attained from
public regarding their preferences with much ease. Moreover, open ended questions may be
asked to gather information. This information can be collected within stipulated time by the
researcher so that adequate decision can be made confronting to launch new product in effective
way. Questionnaires saves time for carrying out research and also are cost effective for the
company (Ford and Richardson, 2013).
Simple random sampling method
This method is quite effective method for company so that it may be able to generate
productive results. For carrying out this research, about 90 customers sample will be taken to
generate effective outcomes. This means that sampling frame will be chosen from these
customers and consecutively questionnaire will be prepared for collecting valuable information
with much ease. This is essential as entire population cannot be taken to conduct market research
and as such, simple random sampling technique is meaningful one to present effective results yp
company so that new product may be successfully launched.
1.3 Questionnaire
Questionnaire
Demographic information
Name
Age
Gender
1. Have you ever gone for tour with Thomas Cook?
Yes
No
2
Paraphrase This Document
Need a fresh take? Get an instant paraphrase of this document with our AI Paraphraser
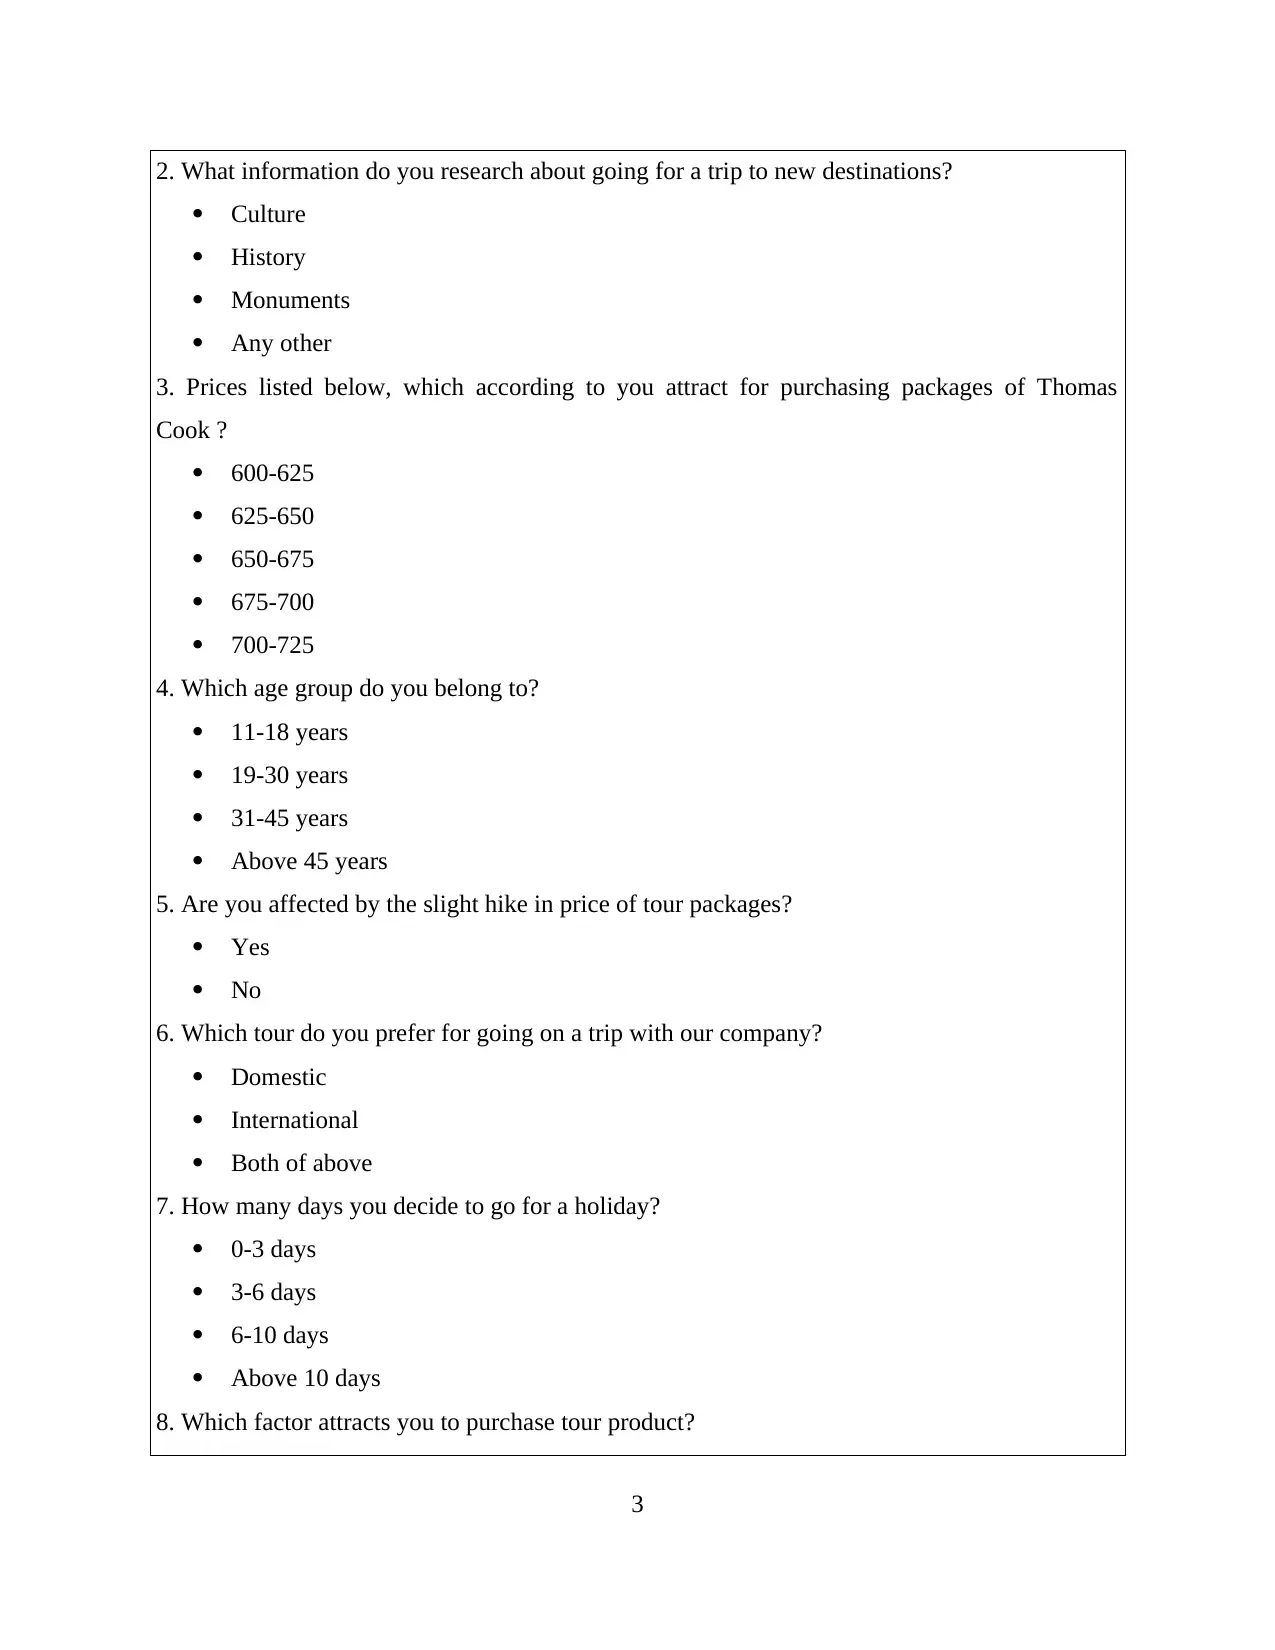
2. What information do you research about going for a trip to new destinations?
Culture
History
Monuments
Any other
3. Prices listed below, which according to you attract for purchasing packages of Thomas
Cook ?
600-625
625-650
650-675
675-700
700-725
4. Which age group do you belong to?
11-18 years
19-30 years
31-45 years
Above 45 years
5. Are you affected by the slight hike in price of tour packages?
Yes
No
6. Which tour do you prefer for going on a trip with our company?
Domestic
International
Both of above
7. How many days you decide to go for a holiday?
0-3 days
3-6 days
6-10 days
Above 10 days
8. Which factor attracts you to purchase tour product?
3
Low cost
Food quality
Accommodation facilities
Brand value
9. Which marketing factor lures to buy tour packages of Thomas Cook Plc?
Advertisement in newspapers
Promotion in Television
Social media
Any other factor
10. Kindly provide your valuable suggestions so that improvement in facilities can be provided
for enhancing customer satisfaction
TASK 2
2.1 Summarising raw data
To have the appropriate pricing decision there has been measurements of the presented
questionnaires. Here the professionals has analysed the various pricing categories which will be
on the basis of analysing the 90 consumer's view on it. Thus, it will be helpful to the
professionals or Thomas Cook in determining the suitable prices for the operations. However,
the analysis for the prices over the tour packages as the various analysis as follows:
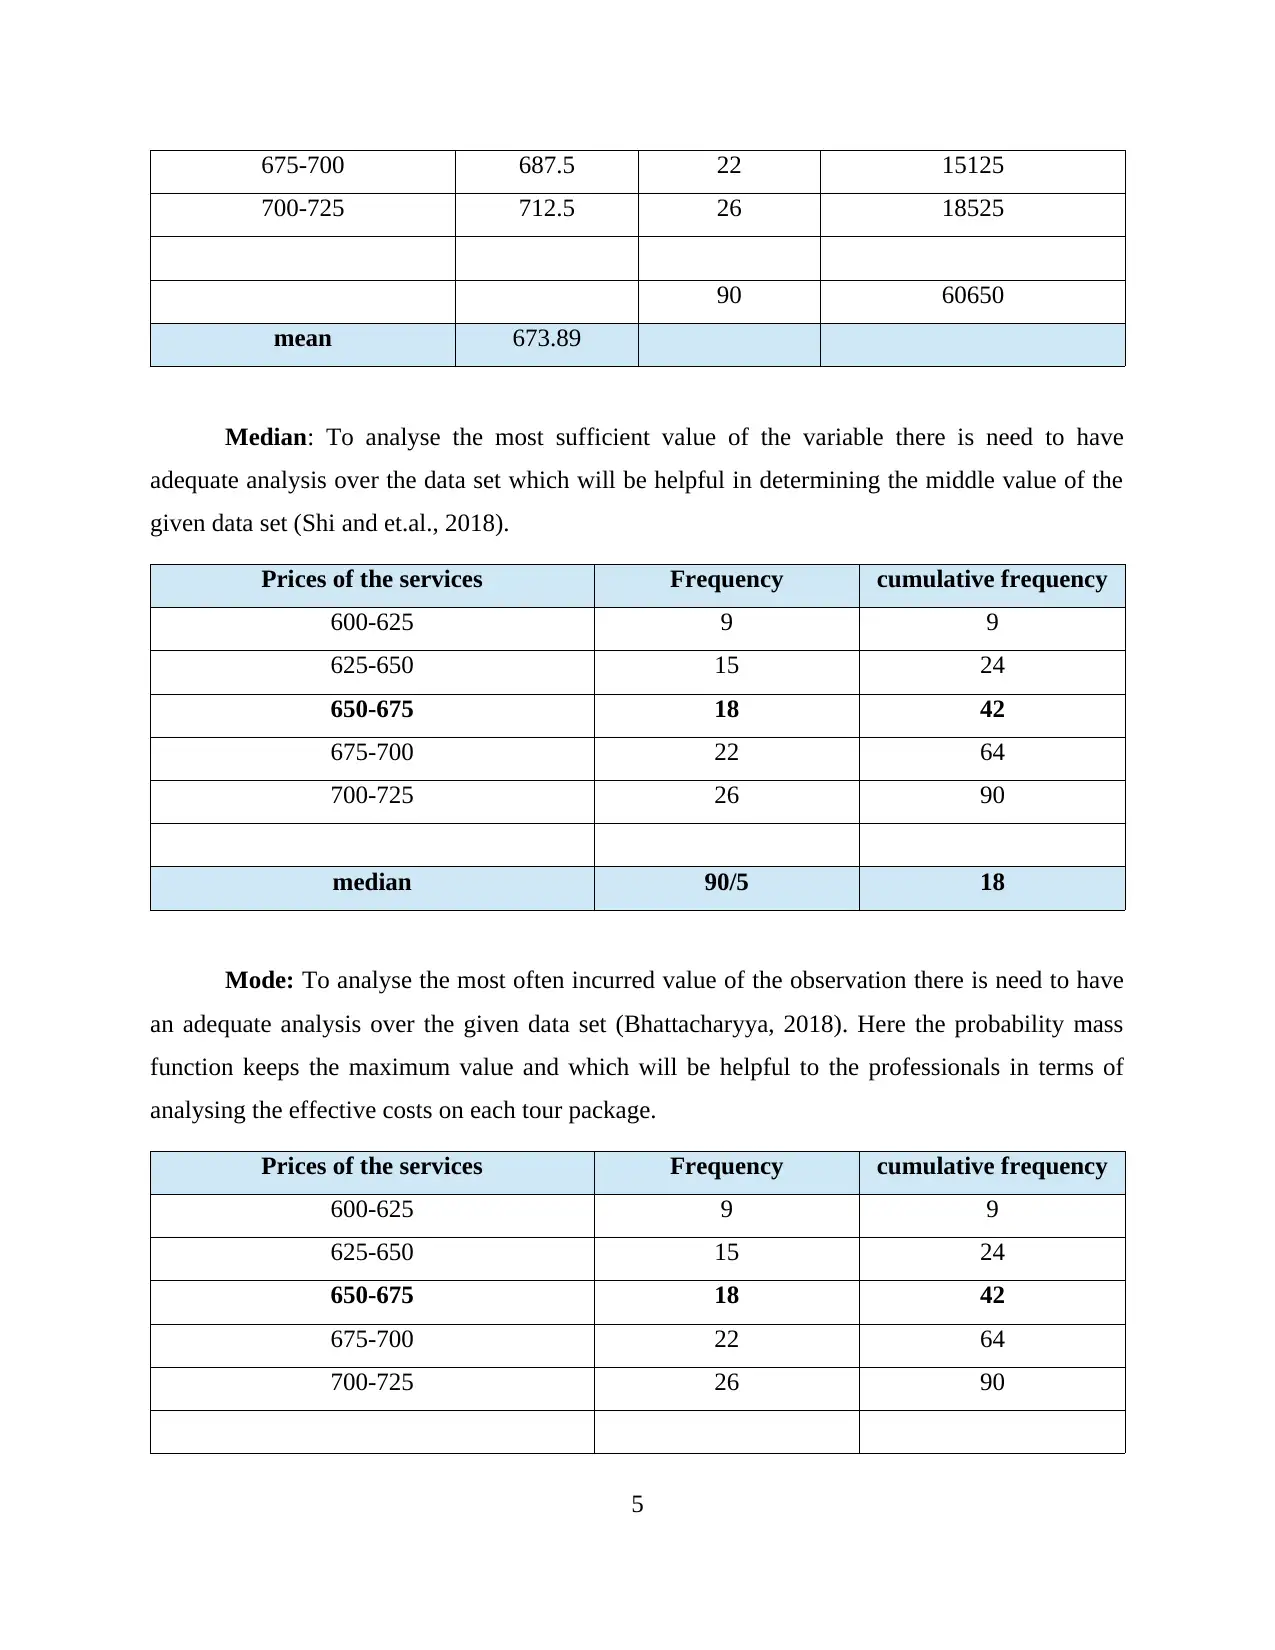
Mean: Mean is the average value of the given data set which represents the significance
of the data set (Pagano and Gauvreau, 2018). However, here in the below listed table there has
been analysis of the various price range which has been set on the scaler basis such as 600 to
725. The frequency has been set in accordance with the number of consumers and their response
over the prices in each categories.
Prices of the services mid point Frequency Frequency * mid point
600-625 612.5 9 5512.5
625-650 637.5 15 9562.5
650-675 662.5 18 11925
4
Food quality
Accommodation facilities
Brand value
9. Which marketing factor lures to buy tour packages of Thomas Cook Plc?
Advertisement in newspapers
Promotion in Television
Social media
Any other factor
10. Kindly provide your valuable suggestions so that improvement in facilities can be provided
for enhancing customer satisfaction
TASK 2
2.1 Summarising raw data
To have the appropriate pricing decision there has been measurements of the presented
questionnaires. Here the professionals has analysed the various pricing categories which will be
on the basis of analysing the 90 consumer's view on it. Thus, it will be helpful to the
professionals or Thomas Cook in determining the suitable prices for the operations. However,
the analysis for the prices over the tour packages as the various analysis as follows:
Mean: Mean is the average value of the given data set which represents the significance
of the data set (Pagano and Gauvreau, 2018). However, here in the below listed table there has
been analysis of the various price range which has been set on the scaler basis such as 600 to
725. The frequency has been set in accordance with the number of consumers and their response
over the prices in each categories.
Prices of the services mid point Frequency Frequency * mid point
600-625 612.5 9 5512.5
625-650 637.5 15 9562.5
650-675 662.5 18 11925
4
⊘ This is a preview!⊘
Do you want full access?
Subscribe today to unlock all pages.
Trusted by 1+ million students worldwide
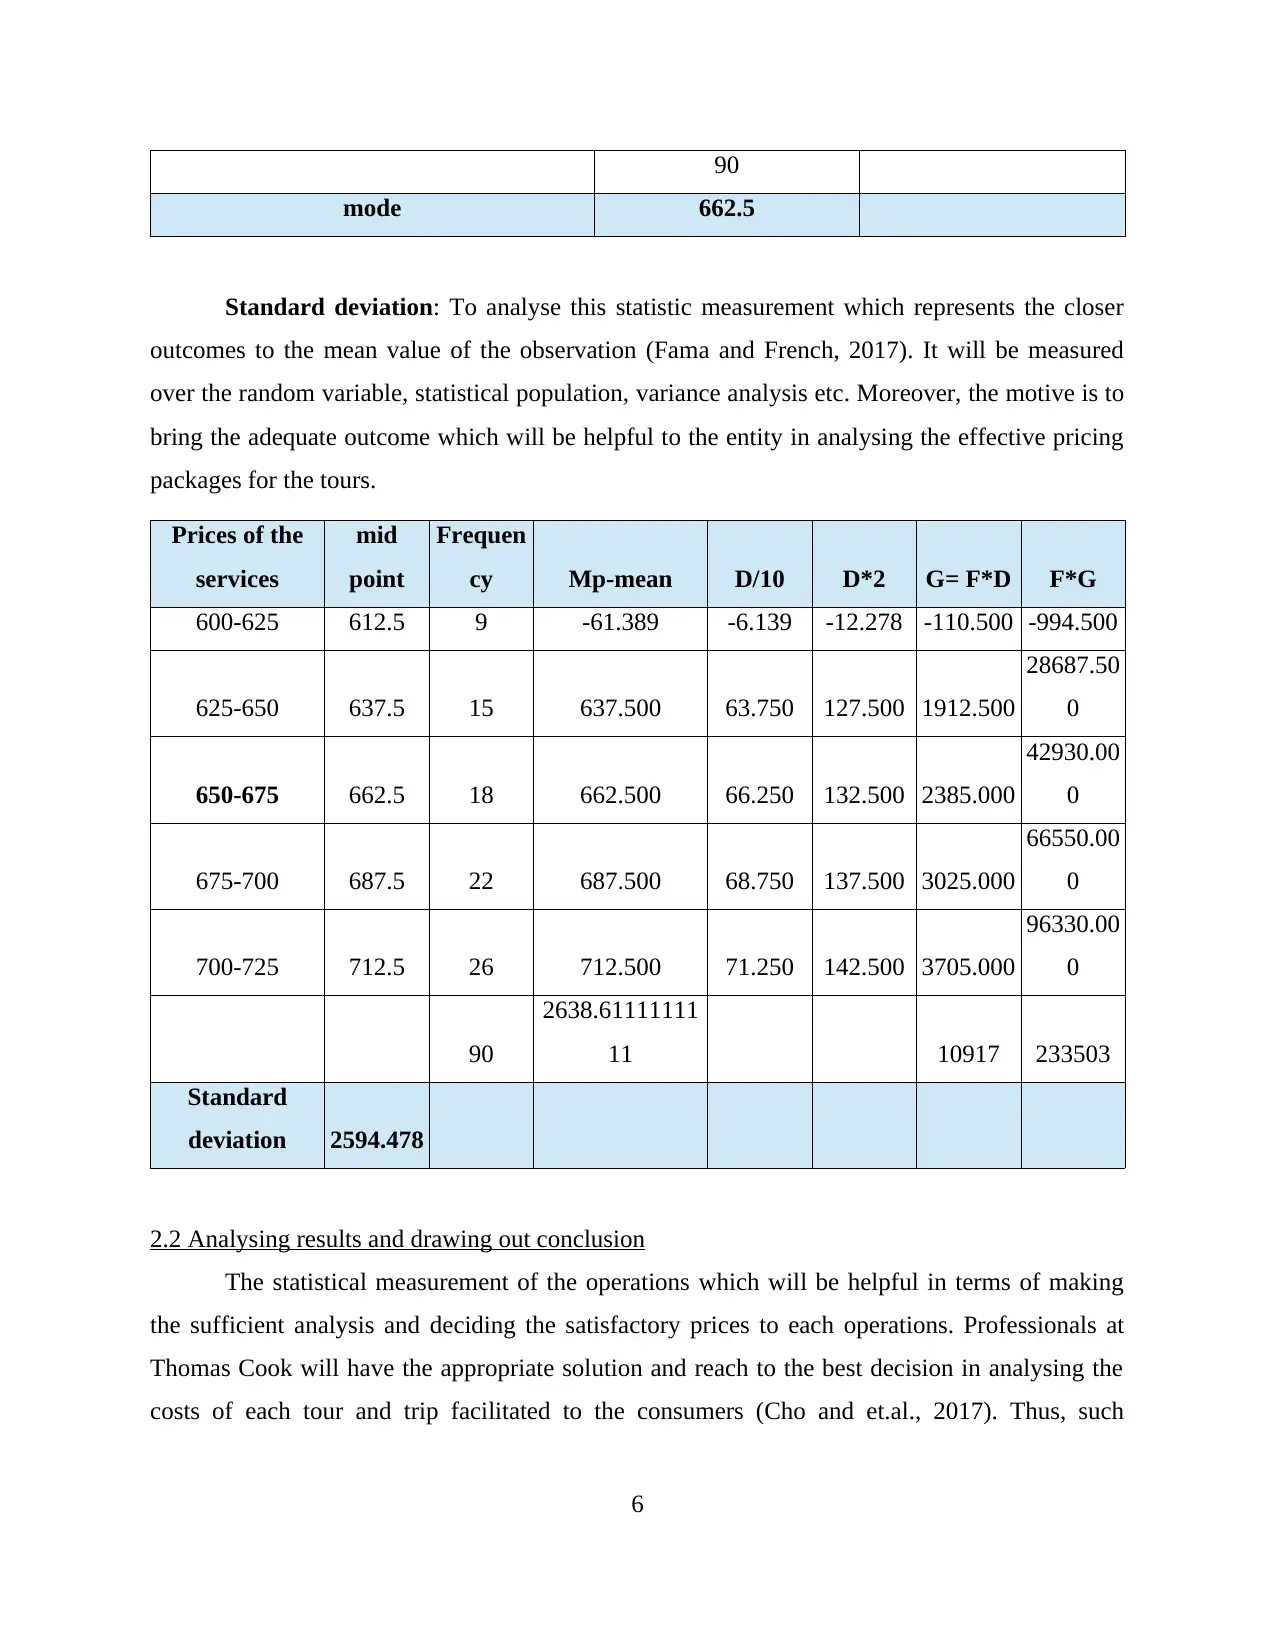
675-700 687.5 22 15125
700-725 712.5 26 18525
90 60650
mean 673.89
Median: To analyse the most sufficient value of the variable there is need to have
adequate analysis over the data set which will be helpful in determining the middle value of the
given data set (Shi and et.al., 2018).
Prices of the services Frequency cumulative frequency
600-625 9 9
625-650 15 24
650-675 18 42
675-700 22 64
700-725 26 90
median 90/5 18
Mode: To analyse the most often incurred value of the observation there is need to have
an adequate analysis over the given data set (Bhattacharyya, 2018). Here the probability mass
function keeps the maximum value and which will be helpful to the professionals in terms of
analysing the effective costs on each tour package.
Prices of the services Frequency cumulative frequency
600-625 9 9
625-650 15 24
650-675 18 42
675-700 22 64
700-725 26 90
5
Paraphrase This Document
Need a fresh take? Get an instant paraphrase of this document with our AI Paraphraser
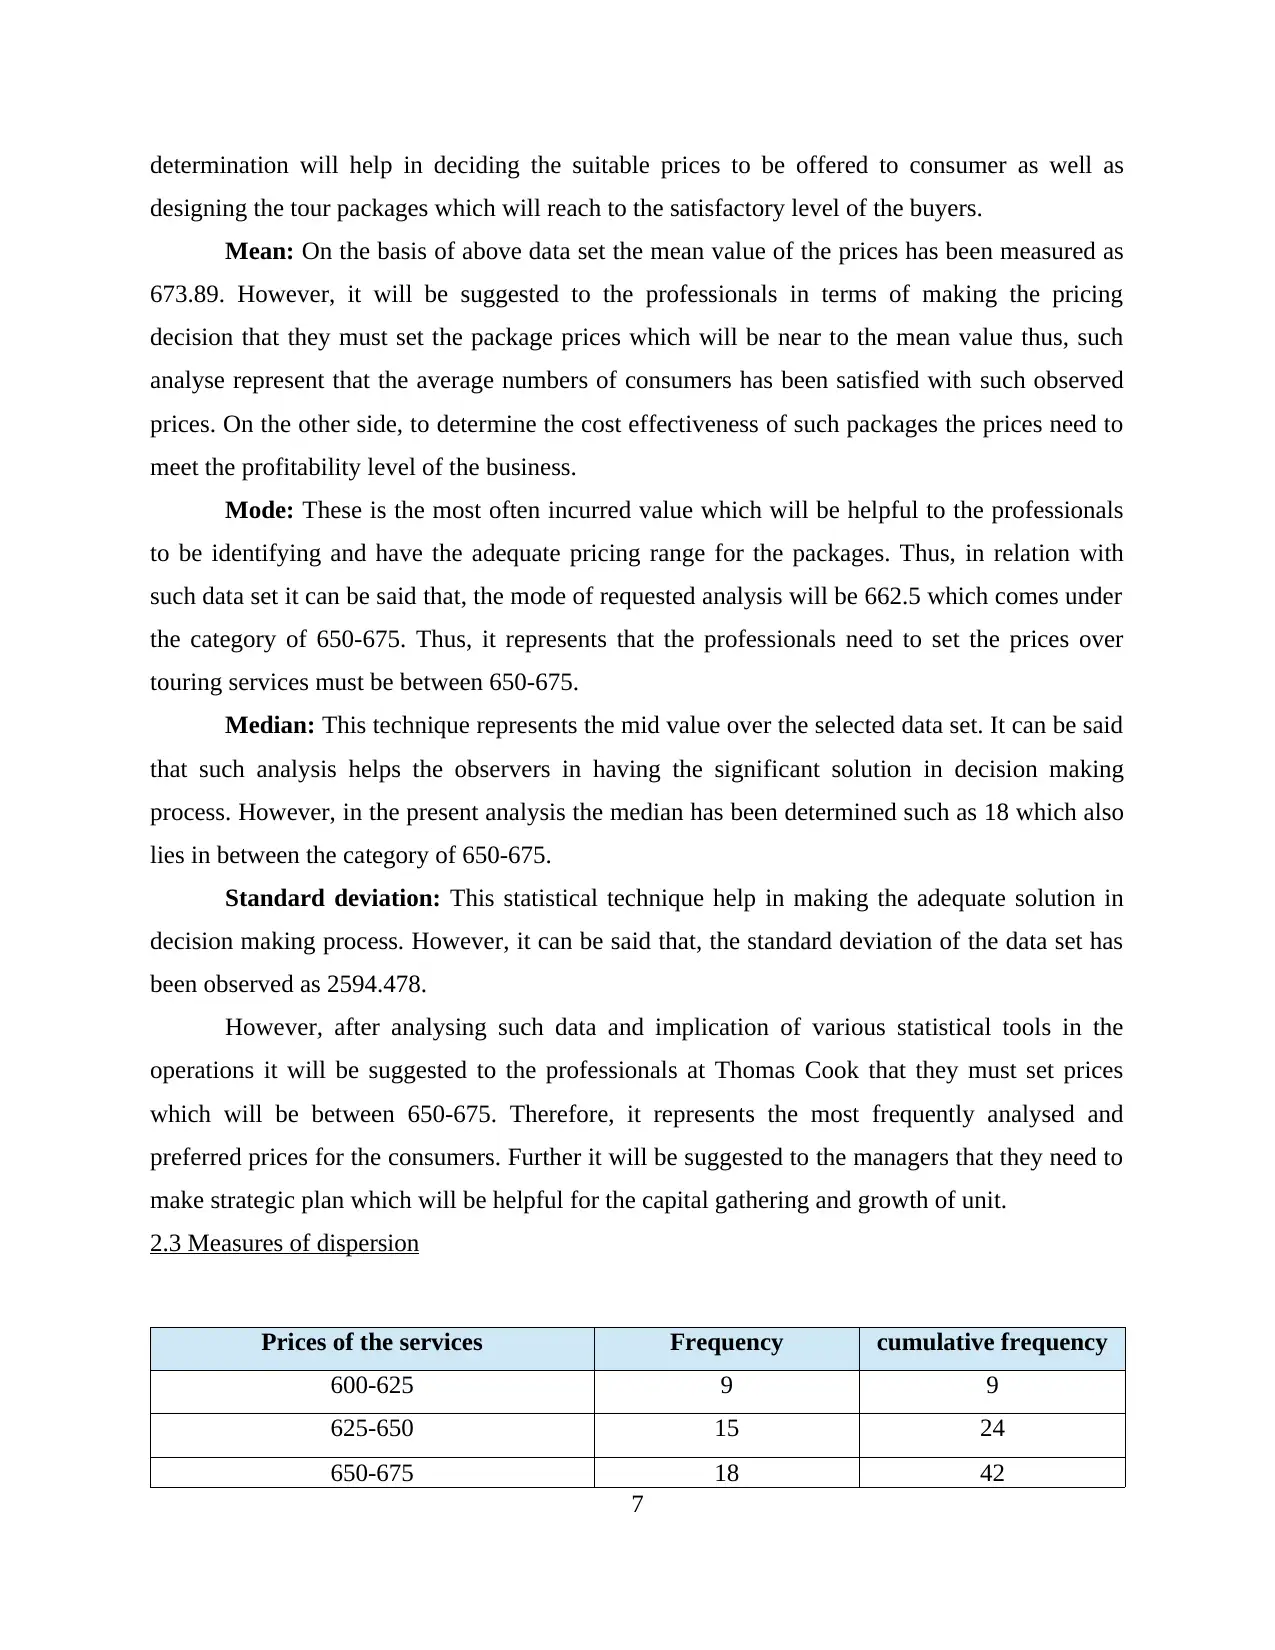
90
mode 662.5
Standard deviation: To analyse this statistic measurement which represents the closer
outcomes to the mean value of the observation (Fama and French, 2017). It will be measured
over the random variable, statistical population, variance analysis etc. Moreover, the motive is to
bring the adequate outcome which will be helpful to the entity in analysing the effective pricing
packages for the tours.
Prices of the
services
mid
point
Frequen
cy Mp-mean D/10 D*2 G= F*D F*G
600-625 612.5 9 -61.389 -6.139 -12.278 -110.500 -994.500
625-650 637.5 15 637.500 63.750 127.500 1912.500
28687.50
0
650-675 662.5 18 662.500 66.250 132.500 2385.000
42930.00
0
675-700 687.5 22 687.500 68.750 137.500 3025.000
66550.00
0
700-725 712.5 26 712.500 71.250 142.500 3705.000
96330.00
0
90
2638.61111111
11 10917 233503
Standard
deviation 2594.478
2.2 Analysing results and drawing out conclusion
The statistical measurement of the operations which will be helpful in terms of making
the sufficient analysis and deciding the satisfactory prices to each operations. Professionals at
Thomas Cook will have the appropriate solution and reach to the best decision in analysing the
costs of each tour and trip facilitated to the consumers (Cho and et.al., 2017). Thus, such
6
determination will help in deciding the suitable prices to be offered to consumer as well as
designing the tour packages which will reach to the satisfactory level of the buyers.
Mean: On the basis of above data set the mean value of the prices has been measured as
673.89. However, it will be suggested to the professionals in terms of making the pricing
decision that they must set the package prices which will be near to the mean value thus, such
analyse represent that the average numbers of consumers has been satisfied with such observed
prices. On the other side, to determine the cost effectiveness of such packages the prices need to
meet the profitability level of the business.
Mode: These is the most often incurred value which will be helpful to the professionals
to be identifying and have the adequate pricing range for the packages. Thus, in relation with
such data set it can be said that, the mode of requested analysis will be 662.5 which comes under
the category of 650-675. Thus, it represents that the professionals need to set the prices over
touring services must be between 650-675.
Median: This technique represents the mid value over the selected data set. It can be said
that such analysis helps the observers in having the significant solution in decision making
process. However, in the present analysis the median has been determined such as 18 which also
lies in between the category of 650-675.
Standard deviation: This statistical technique help in making the adequate solution in
decision making process. However, it can be said that, the standard deviation of the data set has
been observed as 2594.478.
However, after analysing such data and implication of various statistical tools in the
operations it will be suggested to the professionals at Thomas Cook that they must set prices
which will be between 650-675. Therefore, it represents the most frequently analysed and
preferred prices for the consumers. Further it will be suggested to the managers that they need to
make strategic plan which will be helpful for the capital gathering and growth of unit.
2.3 Measures of dispersion
Prices of the services Frequency cumulative frequency
600-625 9 9
625-650 15 24
650-675 18 42
7
⊘ This is a preview!⊘
Do you want full access?
Subscribe today to unlock all pages.
Trusted by 1+ million students worldwide
675-700 22 64
700-725 26 90
90
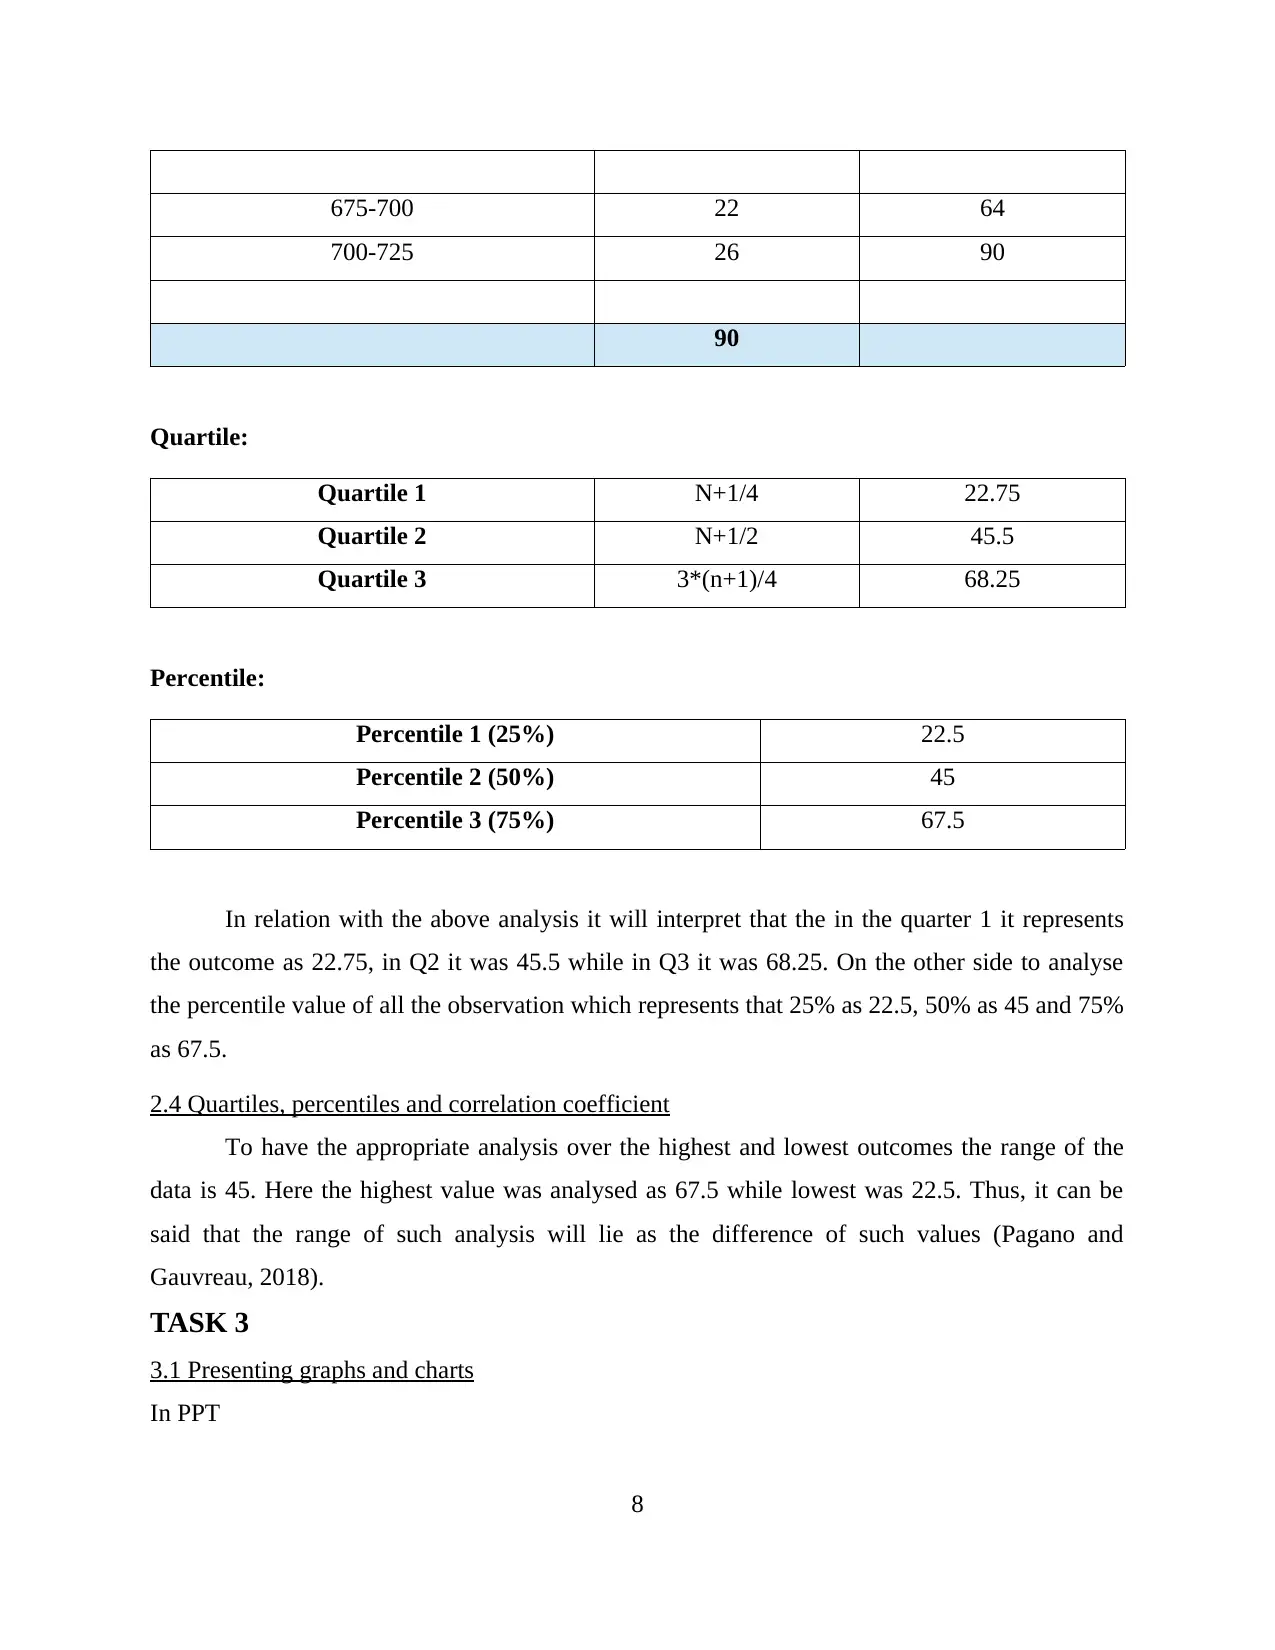
Quartile:
Quartile 1 N+1/4 22.75
Quartile 2 N+1/2 45.5
Quartile 3 3*(n+1)/4 68.25
Percentile:
Percentile 1 (25%) 22.5
Percentile 2 (50%) 45
Percentile 3 (75%) 67.5
In relation with the above analysis it will interpret that the in the quarter 1 it represents
the outcome as 22.75, in Q2 it was 45.5 while in Q3 it was 68.25. On the other side to analyse
the percentile value of all the observation which represents that 25% as 22.5, 50% as 45 and 75%
as 67.5.
2.4 Quartiles, percentiles and correlation coefficient
To have the appropriate analysis over the highest and lowest outcomes the range of the
data is 45. Here the highest value was analysed as 67.5 while lowest was 22.5. Thus, it can be
said that the range of such analysis will lie as the difference of such values (Pagano and
Gauvreau, 2018).
TASK 3
3.1 Presenting graphs and charts
In PPT
8
700-725 26 90
90
Quartile:
Quartile 1 N+1/4 22.75
Quartile 2 N+1/2 45.5
Quartile 3 3*(n+1)/4 68.25
Percentile:
Percentile 1 (25%) 22.5
Percentile 2 (50%) 45
Percentile 3 (75%) 67.5
In relation with the above analysis it will interpret that the in the quarter 1 it represents
the outcome as 22.75, in Q2 it was 45.5 while in Q3 it was 68.25. On the other side to analyse
the percentile value of all the observation which represents that 25% as 22.5, 50% as 45 and 75%
as 67.5.
2.4 Quartiles, percentiles and correlation coefficient
To have the appropriate analysis over the highest and lowest outcomes the range of the
data is 45. Here the highest value was analysed as 67.5 while lowest was 22.5. Thus, it can be
said that the range of such analysis will lie as the difference of such values (Pagano and
Gauvreau, 2018).
TASK 3
3.1 Presenting graphs and charts
In PPT
8
Paraphrase This Document
Need a fresh take? Get an instant paraphrase of this document with our AI Paraphraser
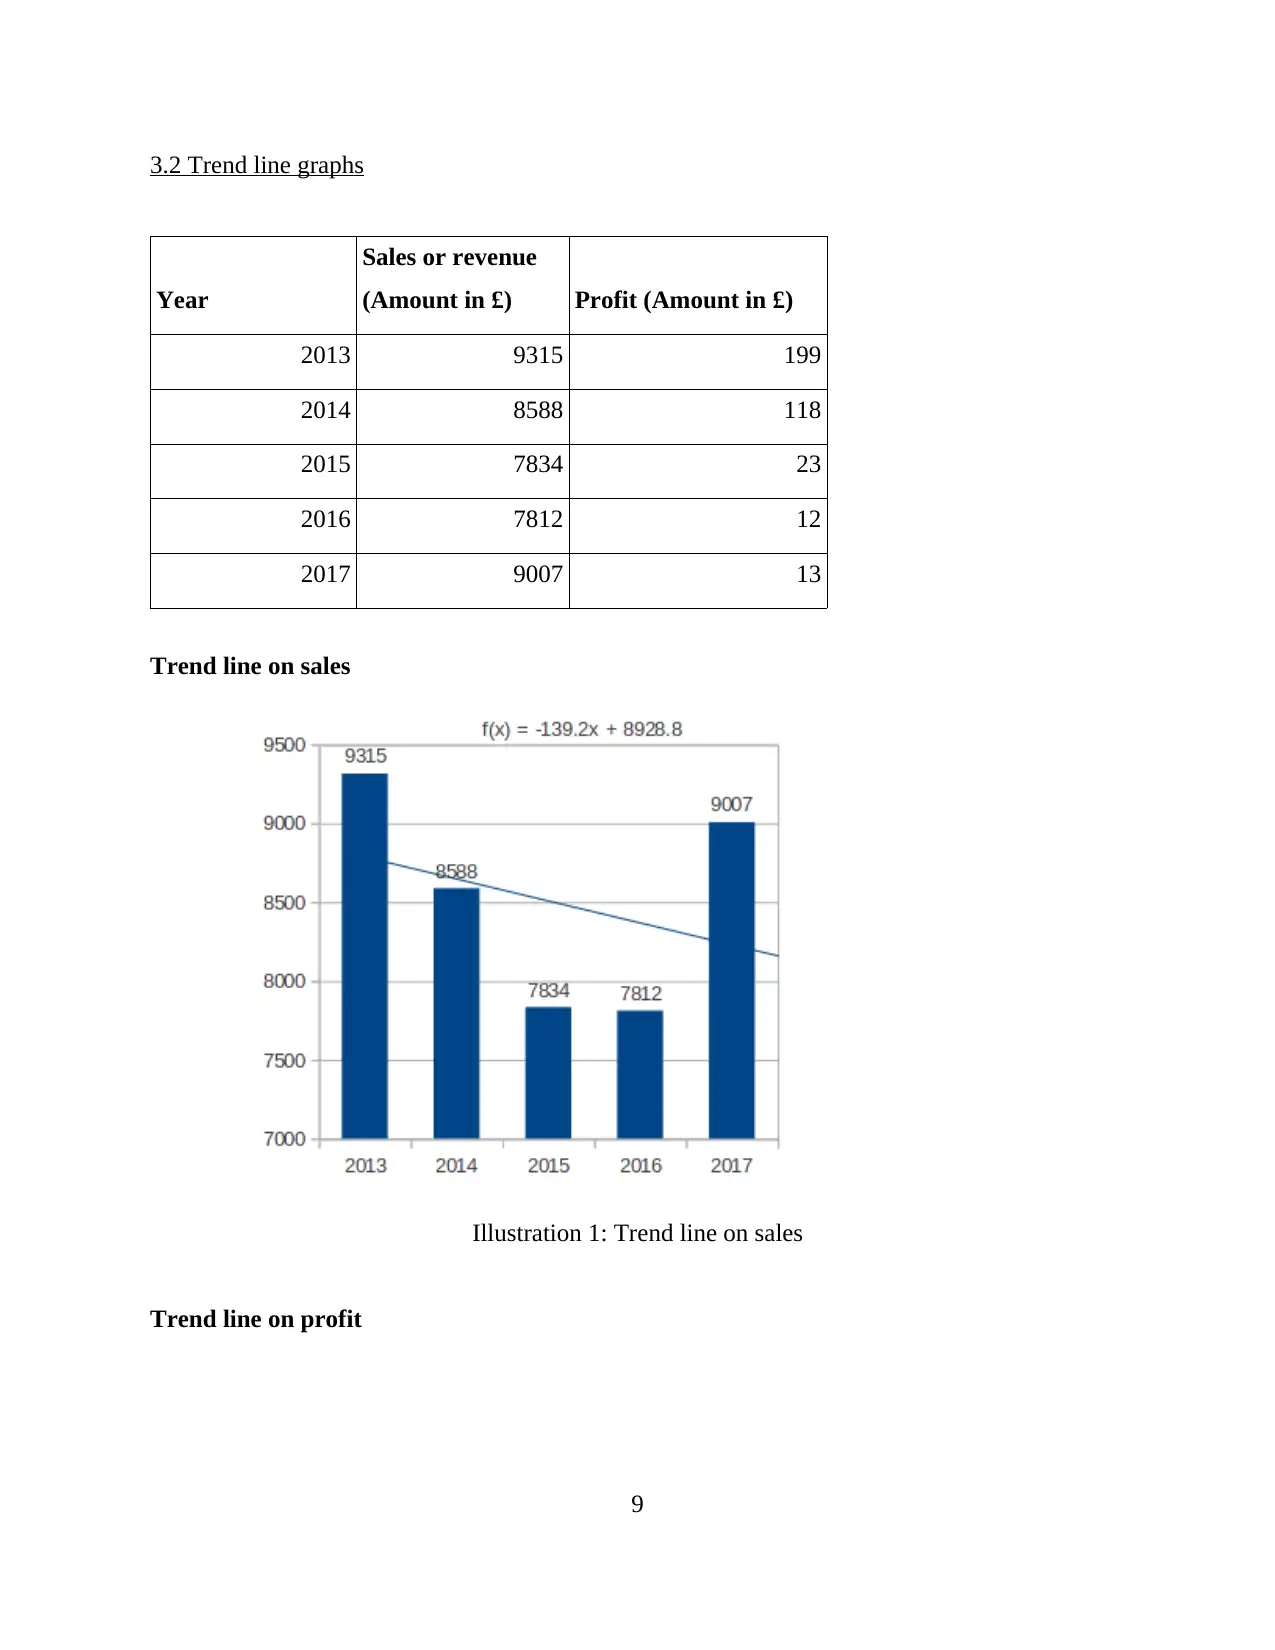
3.2 Trend line graphs
Year
Sales or revenue
(Amount in £) Profit (Amount in £)
2013 9315 199
2014 8588 118
2015 7834 23
2016 7812 12
2017 9007 13
Trend line on sales
Trend line on profit
9
Illustration 1: Trend line on sales
Year
Sales or revenue
(Amount in £) Profit (Amount in £)
2013 9315 199
2014 8588 118
2015 7834 23
2016 7812 12
2017 9007 13
Trend line on sales
Trend line on profit
9
Illustration 1: Trend line on sales
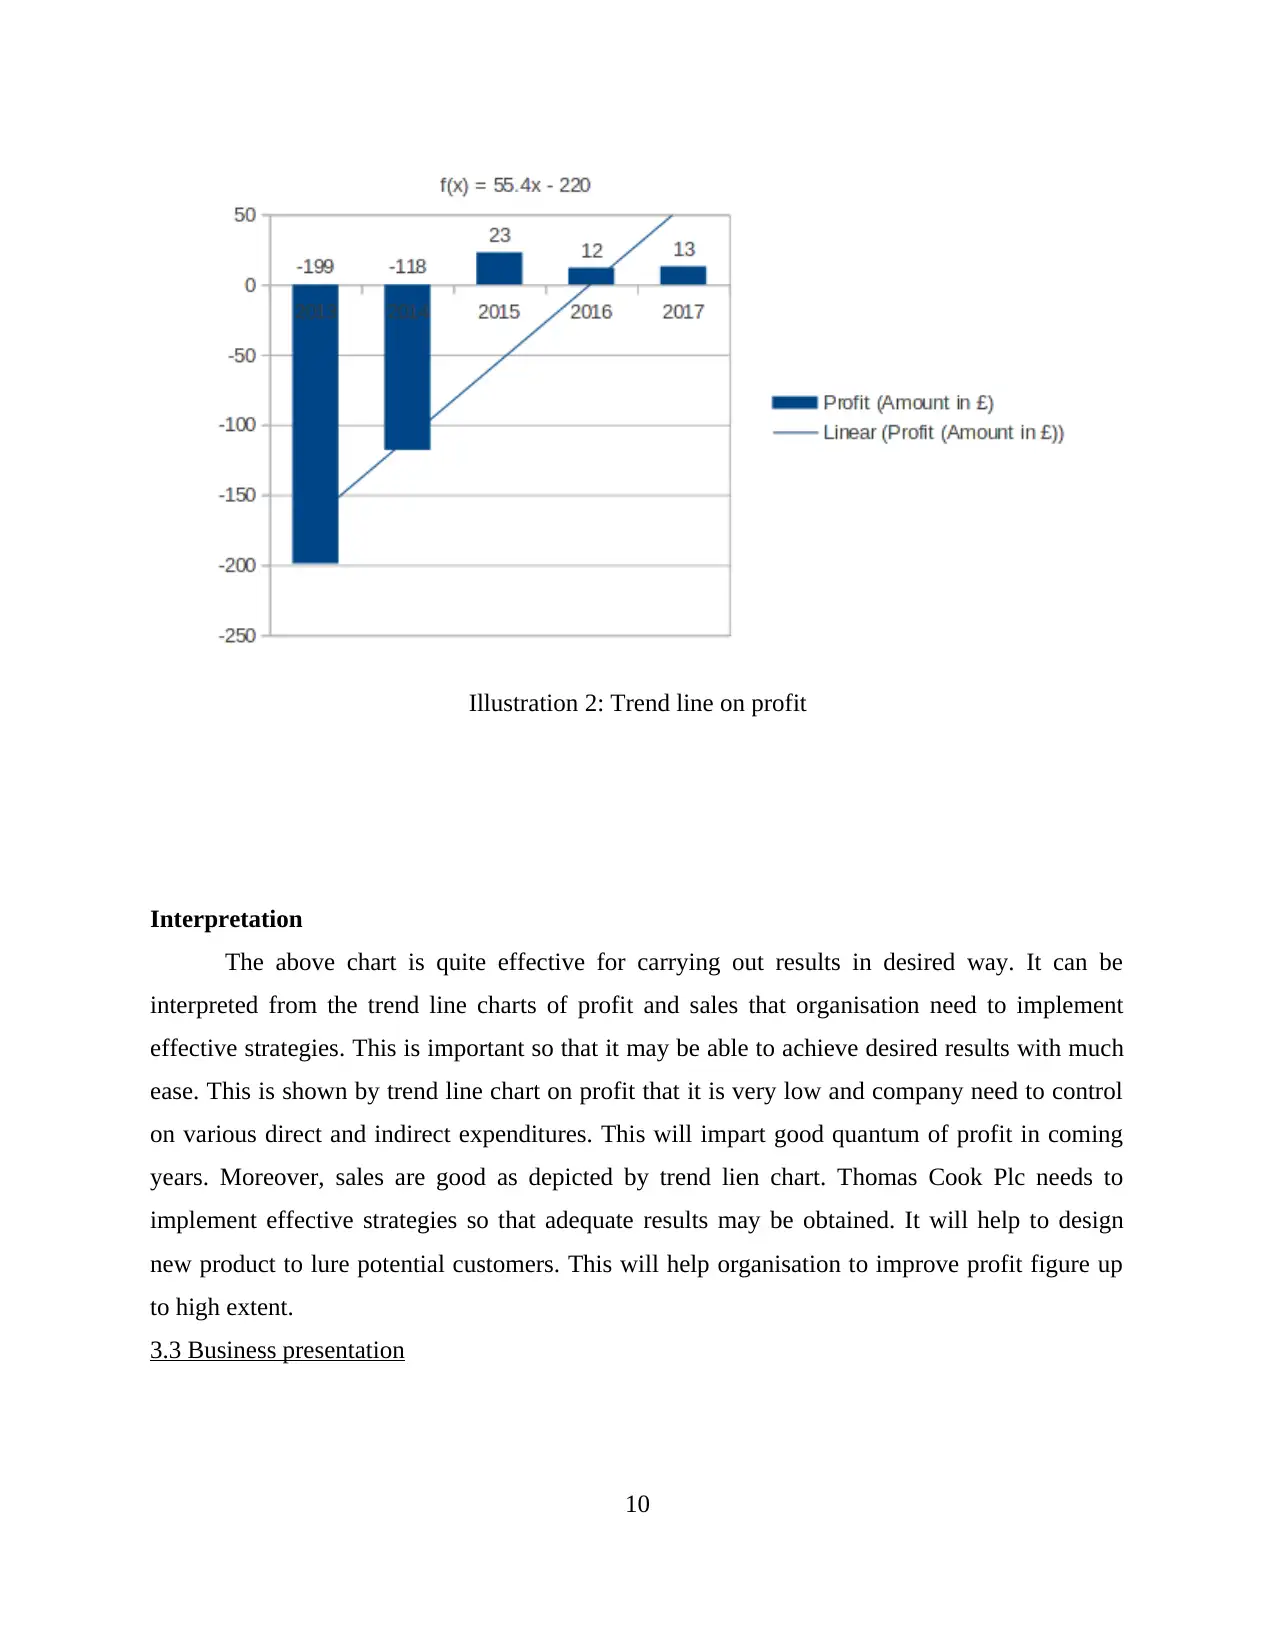
Interpretation
The above chart is quite effective for carrying out results in desired way. It can be
interpreted from the trend line charts of profit and sales that organisation need to implement
effective strategies. This is important so that it may be able to achieve desired results with much
ease. This is shown by trend line chart on profit that it is very low and company need to control
on various direct and indirect expenditures. This will impart good quantum of profit in coming
years. Moreover, sales are good as depicted by trend lien chart. Thomas Cook Plc needs to
implement effective strategies so that adequate results may be obtained. It will help to design
new product to lure potential customers. This will help organisation to improve profit figure up
to high extent.
3.3 Business presentation
10
Illustration 2: Trend line on profit
⊘ This is a preview!⊘
Do you want full access?
Subscribe today to unlock all pages.
Trusted by 1+ million students worldwide
1 out of 17
Related Documents


Your All-in-One AI-Powered Toolkit for Academic Success.
+13062052269
info@desklib.com
Available 24*7 on WhatsApp / Email
![[object Object]](/_next/static/media/star-bottom.7253800d.svg)
Unlock your academic potential
Copyright © 2020–2026 A2Z Services. All Rights Reserved. Developed and managed by ZUCOL.