Business Decision Making Report - Data Analysis and Project Evaluation
VerifiedAdded on 2020/02/05
|19
|3201
|117
Report
AI Summary
This report presents a comprehensive analysis of business decision-making using statistical tools. It begins with an introduction to statistics and its application in business, followed by the application of tools like mean, median, and mode to analyze available data. The report includes a detailed plan for collecting primary and secondary data, along with a survey methodology and questionnaire design. Statistical calculations, including measures of dispersion, quartiles, percentiles, and correlation coefficients, are performed and analyzed. Data is visualized through graphs, and trend analysis is conducted. The report concludes with project evaluation techniques to select the best alternative for the firm, providing valuable insights for business decision-making. The report also includes network diagrams and critical path identification.

BUSINESS DECISION MAKING
Paraphrase This Document
Need a fresh take? Get an instant paraphrase of this document with our AI Paraphraser
⊘ This is a preview!⊘
Do you want full access?
Subscribe today to unlock all pages.
Trusted by 1+ million students worldwide
INTRODUCTION
Statistics is the one of the main discipline that is used to make decisions in respect to
business problems. In the current report on available data tools like mean, median and mode are
applied. The results of these tools are interpreted in systematic way. In middle part of the report,
charting of data is done and comments are made on same. Along with this, network diagram is
also prepared and critical path is identified. At end of the report, project evaluation techniques
are applied on the project and best alternative is selected for the firm.
TASK 1
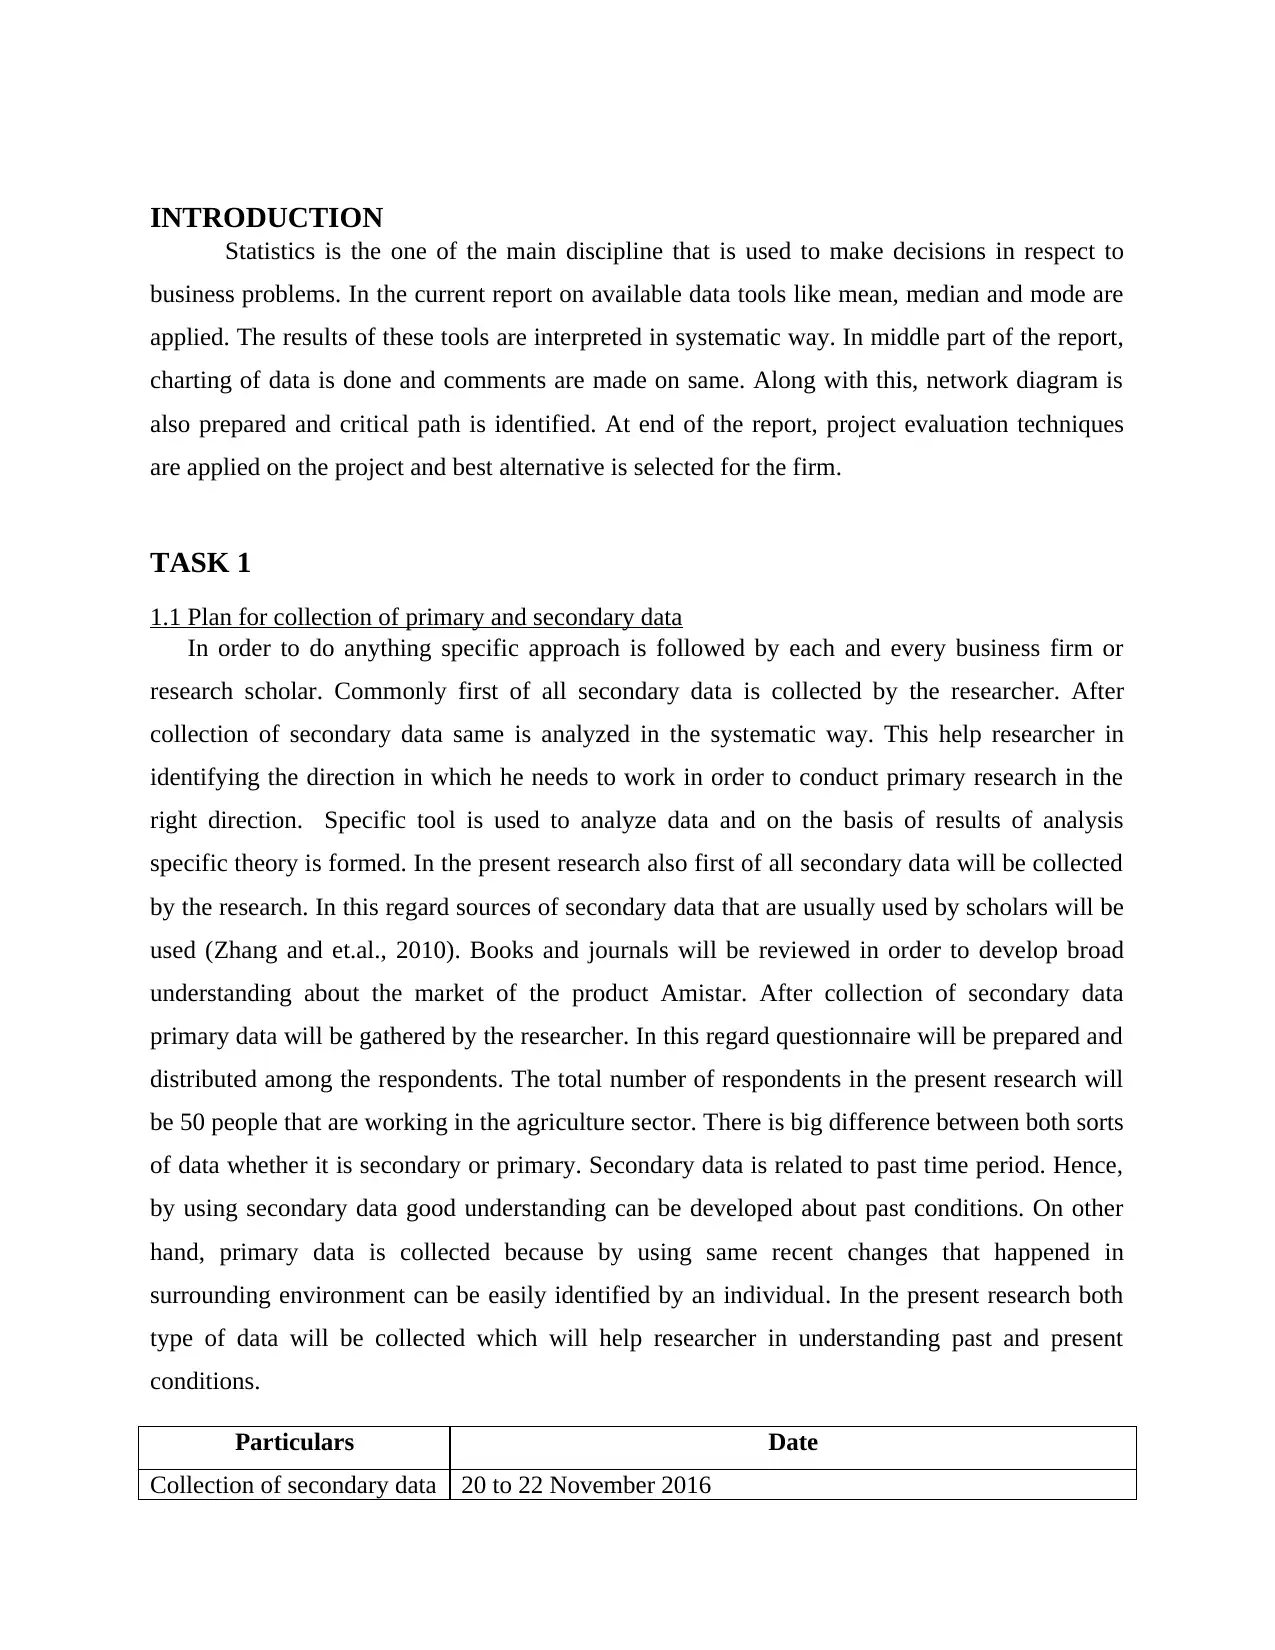
1.1 Plan for collection of primary and secondary data
In order to do anything specific approach is followed by each and every business firm or
research scholar. Commonly first of all secondary data is collected by the researcher. After
collection of secondary data same is analyzed in the systematic way. This help researcher in
identifying the direction in which he needs to work in order to conduct primary research in the
right direction. Specific tool is used to analyze data and on the basis of results of analysis
specific theory is formed. In the present research also first of all secondary data will be collected
by the research. In this regard sources of secondary data that are usually used by scholars will be
used (Zhang and et.al., 2010). Books and journals will be reviewed in order to develop broad
understanding about the market of the product Amistar. After collection of secondary data
primary data will be gathered by the researcher. In this regard questionnaire will be prepared and
distributed among the respondents. The total number of respondents in the present research will
be 50 people that are working in the agriculture sector. There is big difference between both sorts
of data whether it is secondary or primary. Secondary data is related to past time period. Hence,
by using secondary data good understanding can be developed about past conditions. On other
hand, primary data is collected because by using same recent changes that happened in
surrounding environment can be easily identified by an individual. In the present research both
type of data will be collected which will help researcher in understanding past and present
conditions.
Particulars Date
Collection of secondary data 20 to 22 November 2016
Statistics is the one of the main discipline that is used to make decisions in respect to
business problems. In the current report on available data tools like mean, median and mode are
applied. The results of these tools are interpreted in systematic way. In middle part of the report,
charting of data is done and comments are made on same. Along with this, network diagram is
also prepared and critical path is identified. At end of the report, project evaluation techniques
are applied on the project and best alternative is selected for the firm.
TASK 1
1.1 Plan for collection of primary and secondary data
In order to do anything specific approach is followed by each and every business firm or
research scholar. Commonly first of all secondary data is collected by the researcher. After
collection of secondary data same is analyzed in the systematic way. This help researcher in
identifying the direction in which he needs to work in order to conduct primary research in the
right direction. Specific tool is used to analyze data and on the basis of results of analysis
specific theory is formed. In the present research also first of all secondary data will be collected
by the research. In this regard sources of secondary data that are usually used by scholars will be
used (Zhang and et.al., 2010). Books and journals will be reviewed in order to develop broad
understanding about the market of the product Amistar. After collection of secondary data
primary data will be gathered by the researcher. In this regard questionnaire will be prepared and
distributed among the respondents. The total number of respondents in the present research will
be 50 people that are working in the agriculture sector. There is big difference between both sorts
of data whether it is secondary or primary. Secondary data is related to past time period. Hence,
by using secondary data good understanding can be developed about past conditions. On other
hand, primary data is collected because by using same recent changes that happened in
surrounding environment can be easily identified by an individual. In the present research both
type of data will be collected which will help researcher in understanding past and present
conditions.
Particulars Date
Collection of secondary data 20 to 22 November 2016
Paraphrase This Document
Need a fresh take? Get an instant paraphrase of this document with our AI Paraphraser
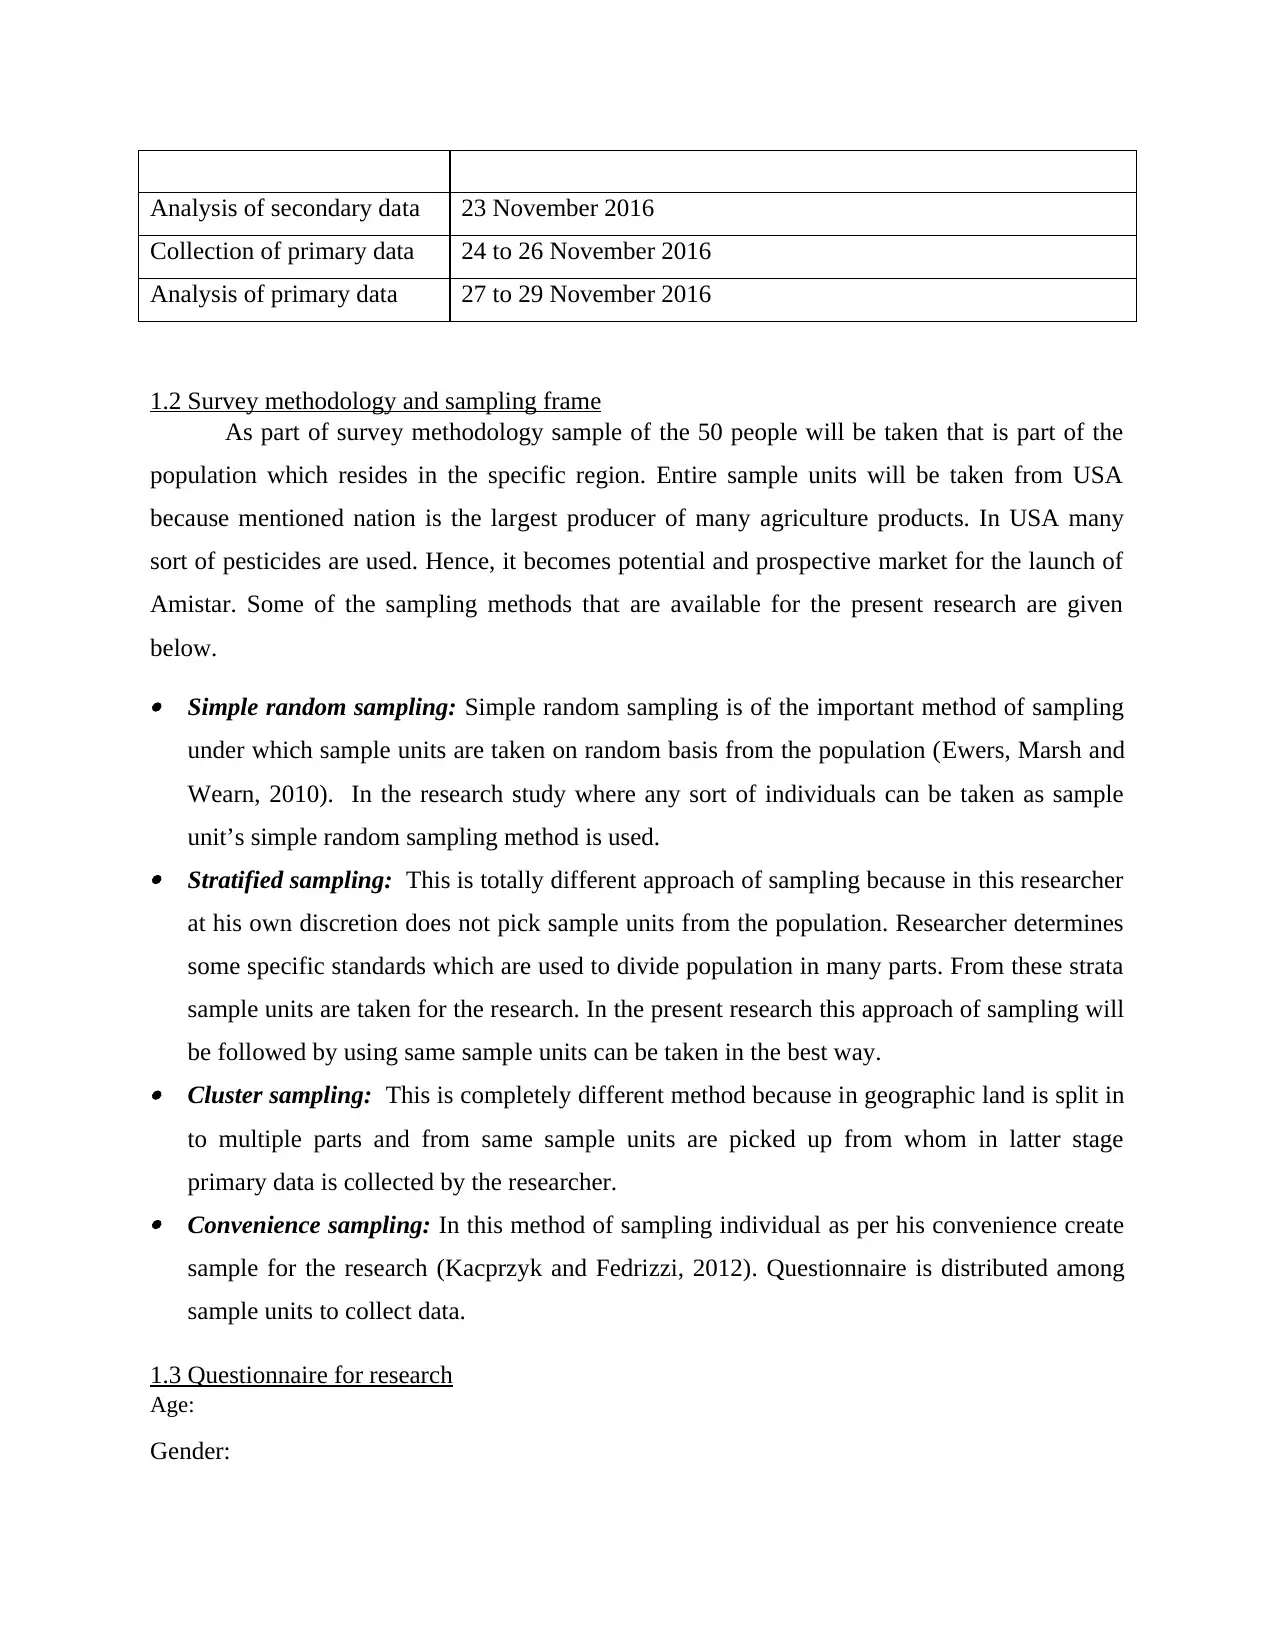
Analysis of secondary data 23 November 2016
Collection of primary data 24 to 26 November 2016
Analysis of primary data 27 to 29 November 2016
1.2 Survey methodology and sampling frame
As part of survey methodology sample of the 50 people will be taken that is part of the
population which resides in the specific region. Entire sample units will be taken from USA
because mentioned nation is the largest producer of many agriculture products. In USA many
sort of pesticides are used. Hence, it becomes potential and prospective market for the launch of
Amistar. Some of the sampling methods that are available for the present research are given
below.
Simple random sampling: Simple random sampling is of the important method of sampling
under which sample units are taken on random basis from the population (Ewers, Marsh and
Wearn, 2010). In the research study where any sort of individuals can be taken as sample
unit’s simple random sampling method is used. Stratified sampling: This is totally different approach of sampling because in this researcher
at his own discretion does not pick sample units from the population. Researcher determines
some specific standards which are used to divide population in many parts. From these strata
sample units are taken for the research. In the present research this approach of sampling will
be followed by using same sample units can be taken in the best way. Cluster sampling: This is completely different method because in geographic land is split in
to multiple parts and from same sample units are picked up from whom in latter stage
primary data is collected by the researcher. Convenience sampling: In this method of sampling individual as per his convenience create
sample for the research (Kacprzyk and Fedrizzi, 2012). Questionnaire is distributed among
sample units to collect data.
1.3 Questionnaire for research
Age:
Gender:
1. Are you familiar with Syngenta products?
Yes
No
2. Do you think that Syngenta products are effective for destroying pest?
Yes
No
3. To which of factors that are given below you give priority while making buying decision?
Low price
Excellent quality
Availability of product at discount rate
4. Syngenta product Amistar will be acceptable in USA. Do you think so?
Yes
No
5. Elevation or reduction in price of Amistar may affect demand from your side for same.
Strongly agree
Agree
Somewhat agree
Disagree
Highly disagree
6 Amistar will be better than similar products offered by rival firms.
Strongly agree
Agree
Somewhat agree
Disagree
Highly disagree
TASK 2
2.1 Computation of mean median and mode
Table 1 Calculation of mean
Frequency
Mid value
(x) fx
Yes
No
2. Do you think that Syngenta products are effective for destroying pest?
Yes
No
3. To which of factors that are given below you give priority while making buying decision?
Low price
Excellent quality
Availability of product at discount rate
4. Syngenta product Amistar will be acceptable in USA. Do you think so?
Yes
No
5. Elevation or reduction in price of Amistar may affect demand from your side for same.
Strongly agree
Agree
Somewhat agree
Disagree
Highly disagree
6 Amistar will be better than similar products offered by rival firms.
Strongly agree
Agree
Somewhat agree
Disagree
Highly disagree
TASK 2
2.1 Computation of mean median and mode
Table 1 Calculation of mean
Frequency
Mid value
(x) fx
⊘ This is a preview!⊘
Do you want full access?
Subscribe today to unlock all pages.
Trusted by 1+ million students worldwide
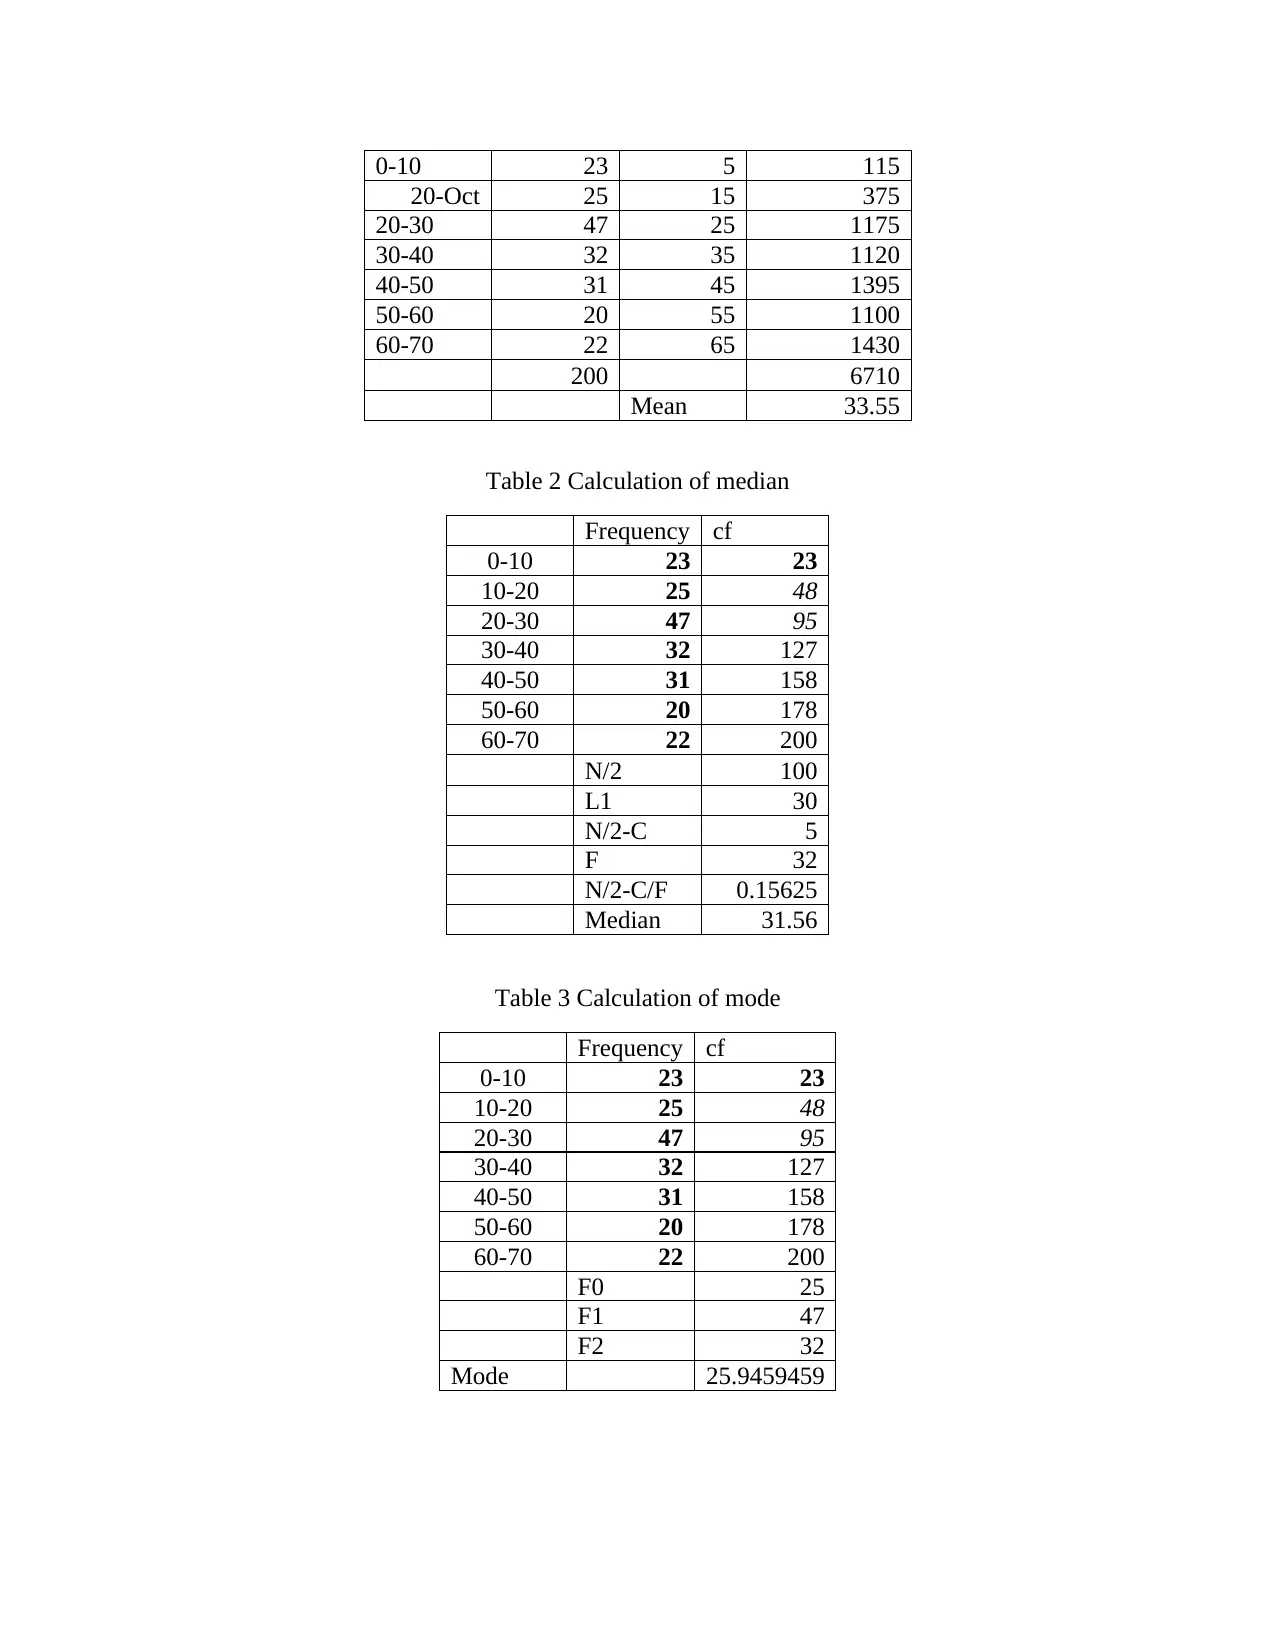
0-10 23 5 115
20-Oct 25 15 375
20-30 47 25 1175
30-40 32 35 1120
40-50 31 45 1395
50-60 20 55 1100
60-70 22 65 1430
200 6710
Mean 33.55
Table 2 Calculation of median
Frequency cf
0-10 23 23
10-20 25 48
20-30 47 95
30-40 32 127
40-50 31 158
50-60 20 178
60-70 22 200
N/2 100
L1 30
N/2-C 5
F 32
N/2-C/F 0.15625
Median 31.56
Table 3 Calculation of mode
Frequency cf
0-10 23 23
10-20 25 48
20-30 47 95
30-40 32 127
40-50 31 158
50-60 20 178
60-70 22 200
F0 25
F1 47
F2 32
Mode 25.9459459
Paraphrase This Document
Need a fresh take? Get an instant paraphrase of this document with our AI Paraphraser
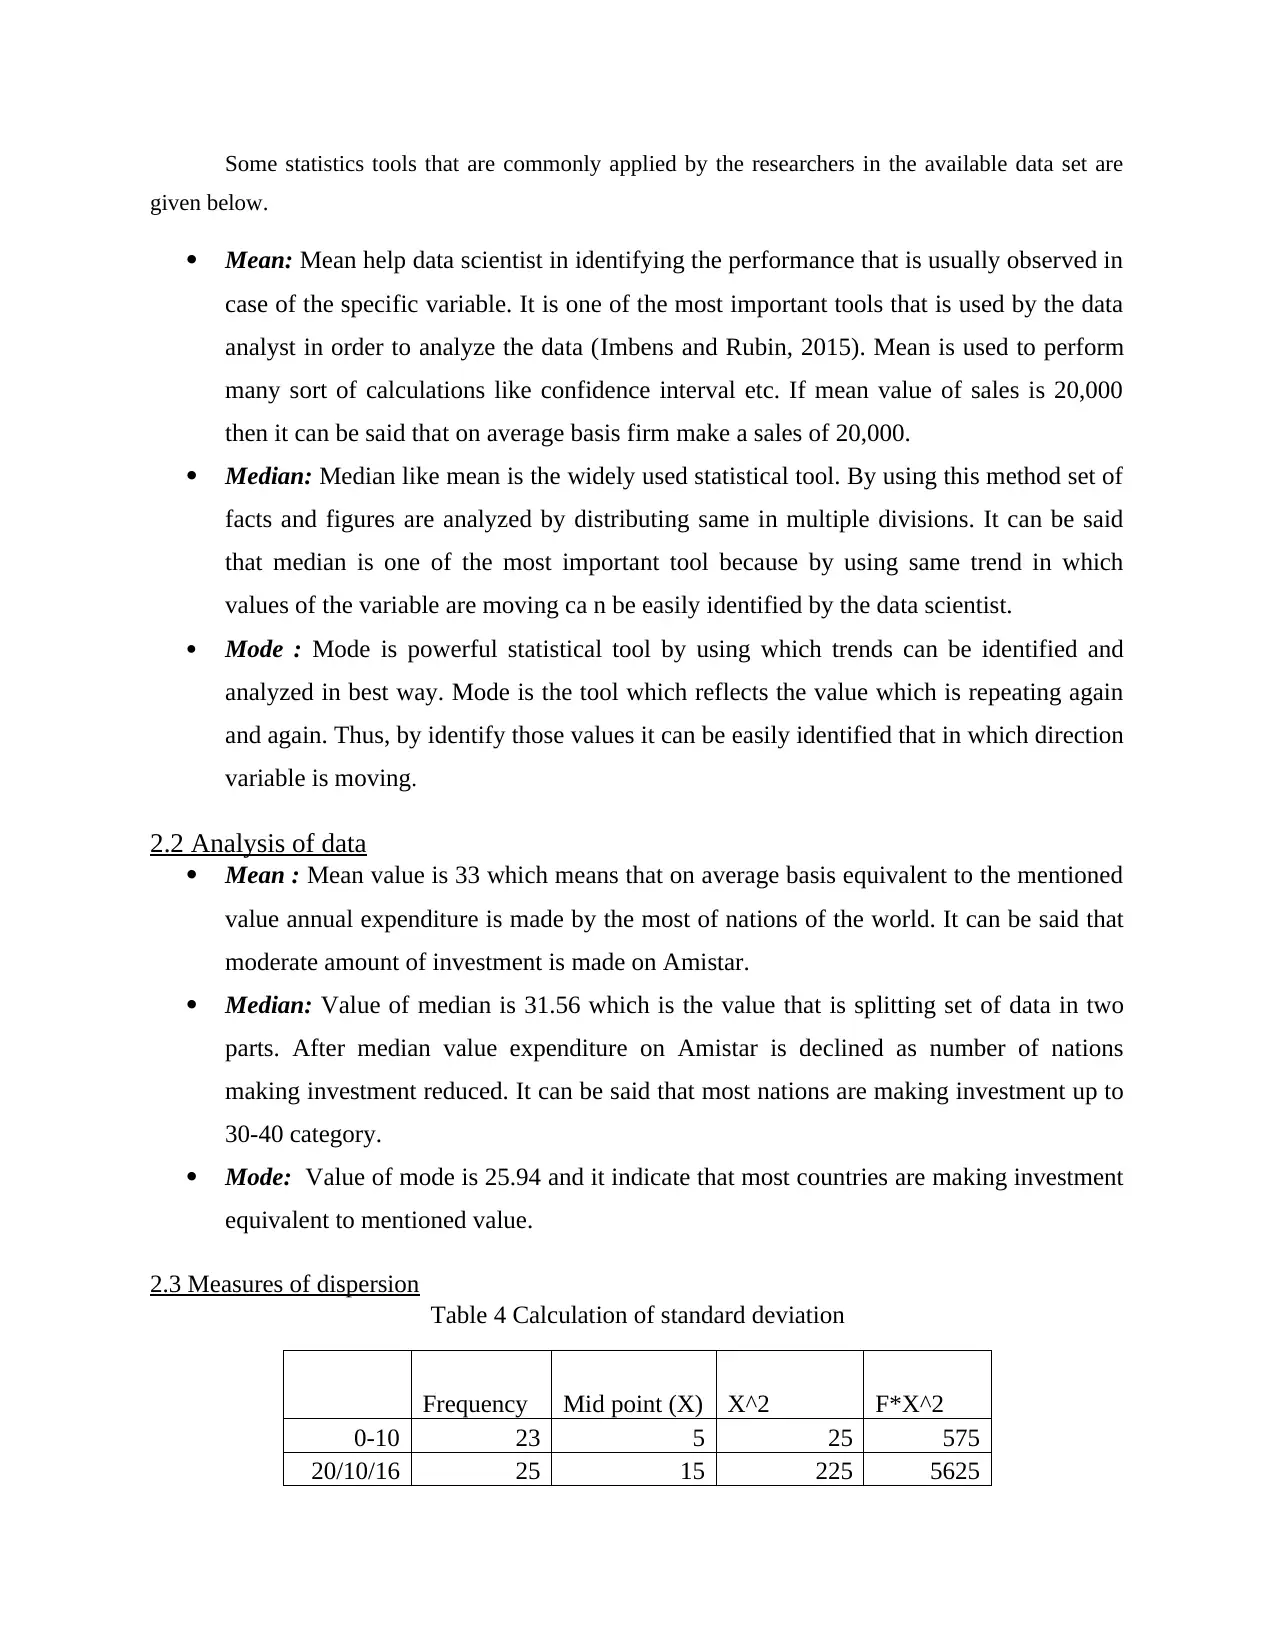
Some statistics tools that are commonly applied by the researchers in the available data set are
given below.
Mean: Mean help data scientist in identifying the performance that is usually observed in
case of the specific variable. It is one of the most important tools that is used by the data
analyst in order to analyze the data (Imbens and Rubin, 2015). Mean is used to perform
many sort of calculations like confidence interval etc. If mean value of sales is 20,000
then it can be said that on average basis firm make a sales of 20,000.
Median: Median like mean is the widely used statistical tool. By using this method set of
facts and figures are analyzed by distributing same in multiple divisions. It can be said
that median is one of the most important tool because by using same trend in which
values of the variable are moving ca n be easily identified by the data scientist.
Mode : Mode is powerful statistical tool by using which trends can be identified and
analyzed in best way. Mode is the tool which reflects the value which is repeating again
and again. Thus, by identify those values it can be easily identified that in which direction
variable is moving.
2.2 Analysis of data
Mean : Mean value is 33 which means that on average basis equivalent to the mentioned
value annual expenditure is made by the most of nations of the world. It can be said that
moderate amount of investment is made on Amistar.
Median: Value of median is 31.56 which is the value that is splitting set of data in two
parts. After median value expenditure on Amistar is declined as number of nations
making investment reduced. It can be said that most nations are making investment up to
30-40 category.
Mode: Value of mode is 25.94 and it indicate that most countries are making investment
equivalent to mentioned value.
2.3 Measures of dispersion
Table 4 Calculation of standard deviation
Frequency Mid point (X) X^2 F*X^2
0-10 23 5 25 575
20/10/16 25 15 225 5625
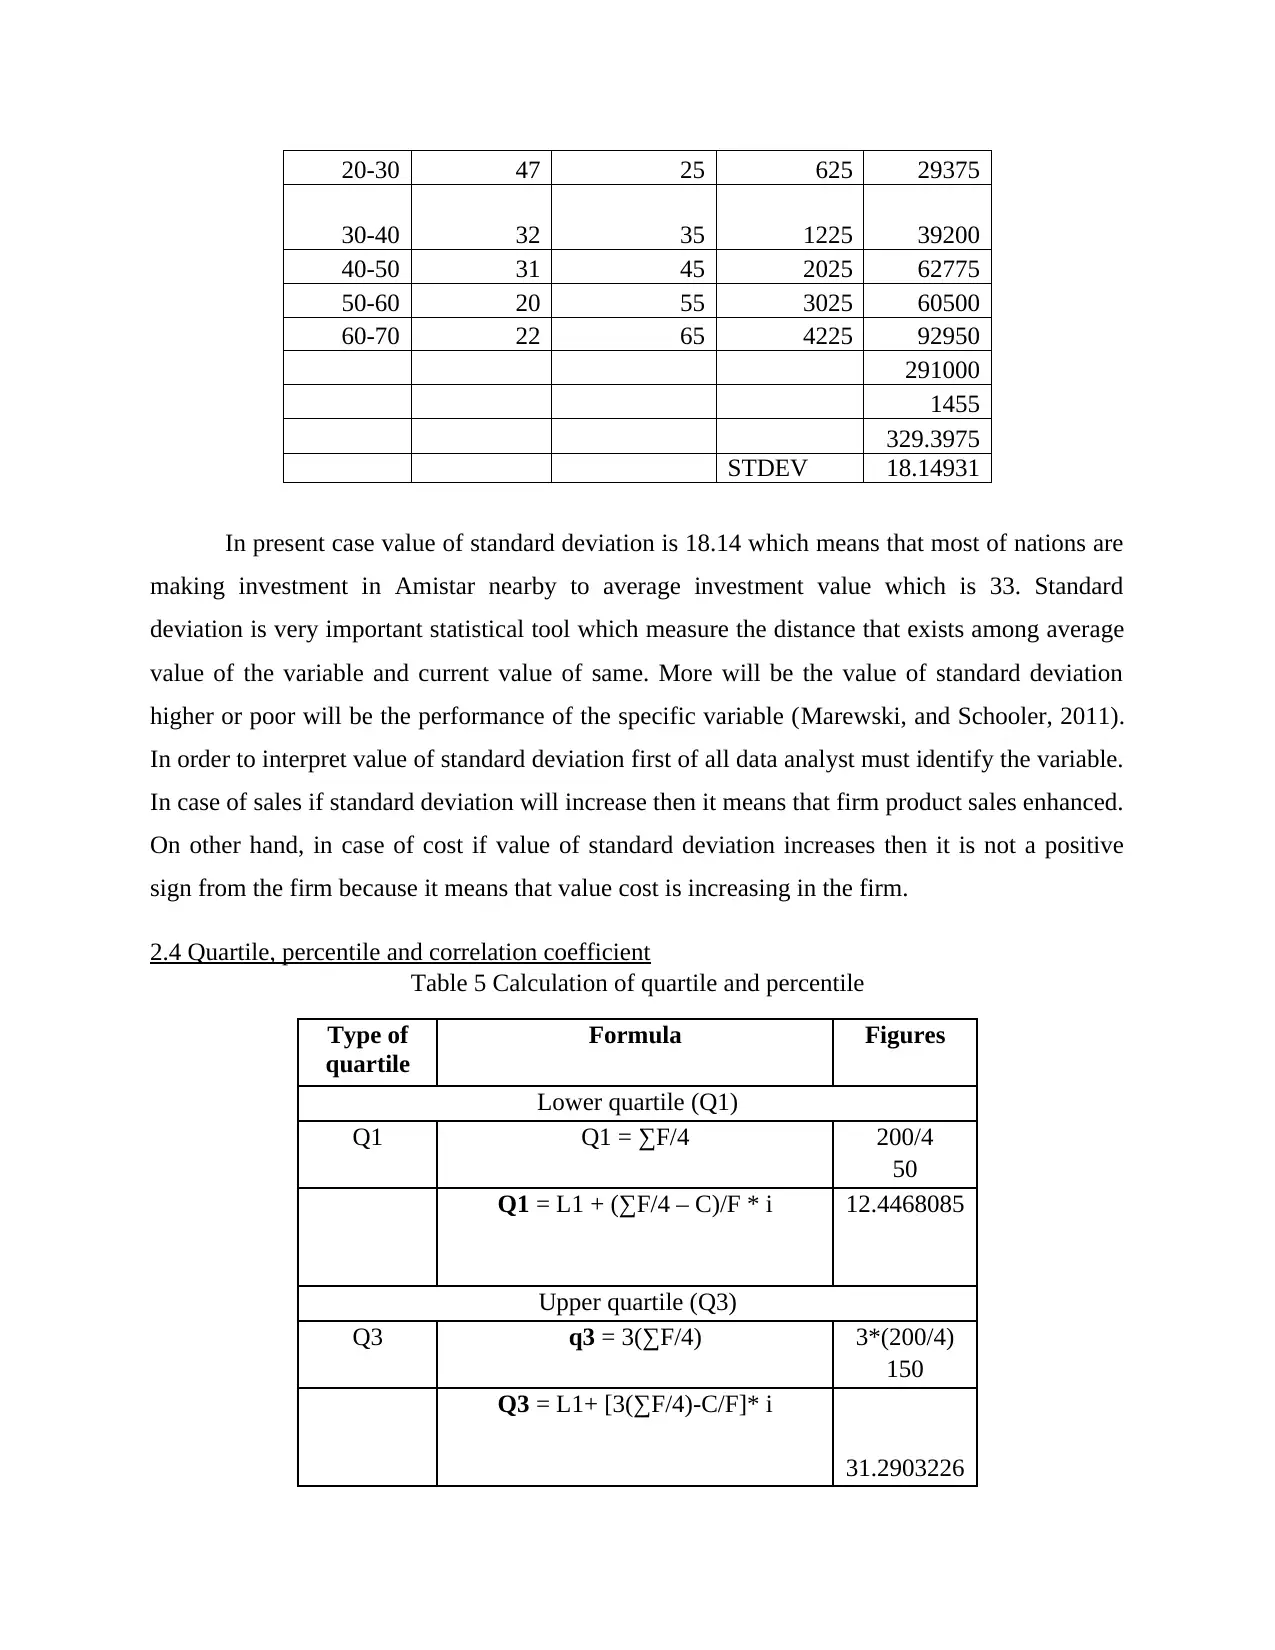
20-30 47 25 625 29375
30-40 32 35 1225 39200
40-50 31 45 2025 62775
50-60 20 55 3025 60500
60-70 22 65 4225 92950
291000
1455
329.3975
STDEV 18.14931
In present case value of standard deviation is 18.14 which means that most of nations are
making investment in Amistar nearby to average investment value which is 33. Standard
deviation is very important statistical tool which measure the distance that exists among average
value of the variable and current value of same. More will be the value of standard deviation
higher or poor will be the performance of the specific variable (Marewski, and Schooler, 2011).
In order to interpret value of standard deviation first of all data analyst must identify the variable.
In case of sales if standard deviation will increase then it means that firm product sales enhanced.
On other hand, in case of cost if value of standard deviation increases then it is not a positive
sign from the firm because it means that value cost is increasing in the firm.
2.4 Quartile, percentile and correlation coefficient
Table 5 Calculation of quartile and percentile
Type of
quartile
Formula Figures
Lower quartile (Q1)
Q1 Q1 = ∑F/4 200/4
50
Q1 = L1 + (∑F/4 – C)/F * i 12.4468085
Upper quartile (Q3)
Q3 q3 = 3(∑F/4) 3*(200/4)
150
Q3 = L1+ [3(∑F/4)-C/F]* i
31.2903226
⊘ This is a preview!⊘
Do you want full access?
Subscribe today to unlock all pages.
Trusted by 1+ million students worldwide
Inter-
quartile
range
(Q3 - Q1) 18.8435141
Percentile
s
Quartiles
25th
percentile
Lower quartile (Q1) 12.4468085
75th
percentile
Upper quartile (Q1) 31.2903226
Tool s which is quartile, percentile and correlation coefficient are explained below.
Quartile: Value of first and third quartile is 12.44 and 31.39 which reflect that there is moderate
difference in investment made by most nations in Amistar. Quartile is the one of the widely used
method of data science. This method is updated version of median because this tool divides data set in
to four parts. Whereas, median only split huge set of figures in only two parts. Percentile and quartile
are almost similar techniques only approach of doing a calculation varies in case of both tools of data
science.
Correlation coefficient: Correlation is another method that indicates the interrelationship among two
variables that exists. Higher the value of the correlation better or worst will be the performance of the
variable. Correlation value always remain in range of -1,0 and +1. Negative correlation reflects that
there is inverse relationship between variables. This means that if one variable will increase then
other variable value will be declined. 0 reflects that there is no relationship between two variables. On
other hand, if correlation value is positive then it means that with increase in one variable other will
also increase.
TASK 3
Paraphrase This Document
Need a fresh take? Get an instant paraphrase of this document with our AI Paraphraser
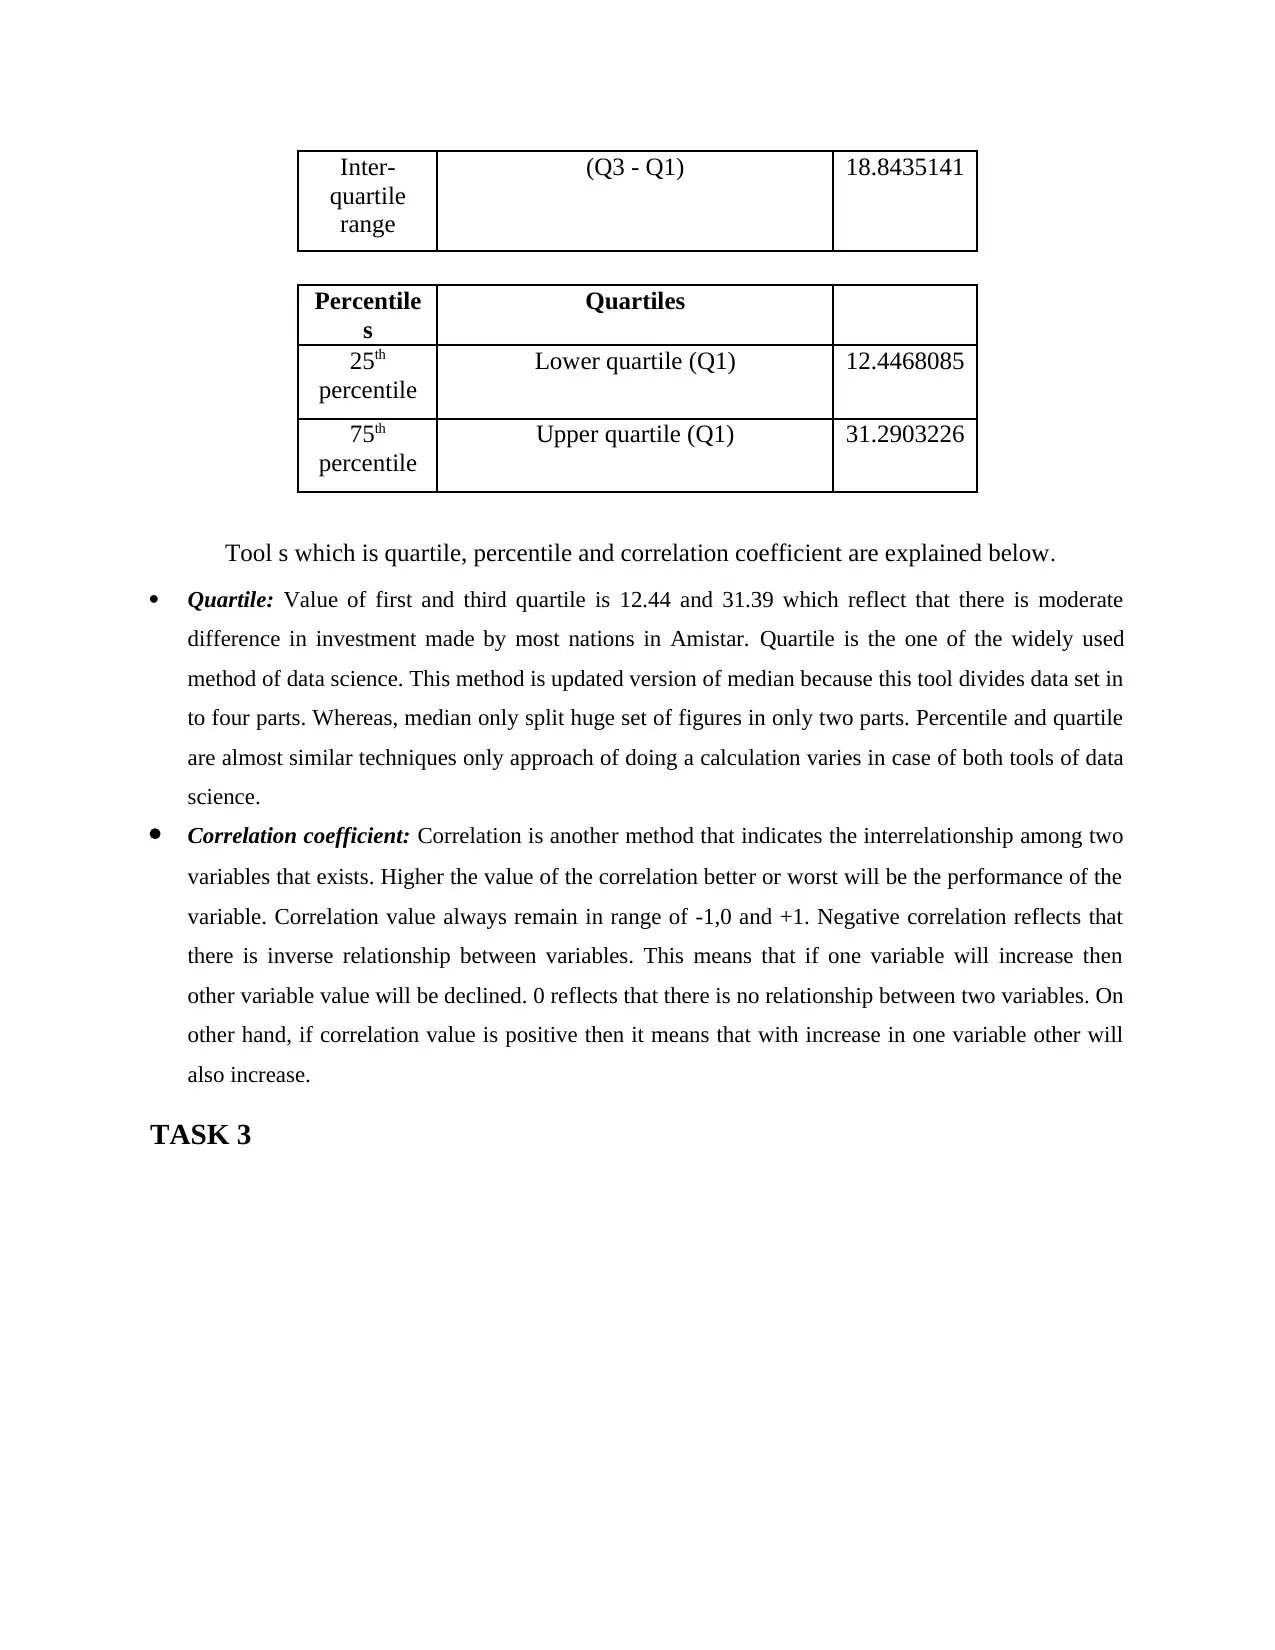
3.1 Produce graphs and draw conclusions
1 2 3 4 5 6 7 8 9 10
0
100
200
300
400
500
600
700
Sales (£’m)
Sales (£’m)
Figure 1 Charting on firm sales
1
2
3
4
5
6
7
8
9
10
0 50 100 150 200 250 300 350
Cost (£’m)
Cost (£’m)
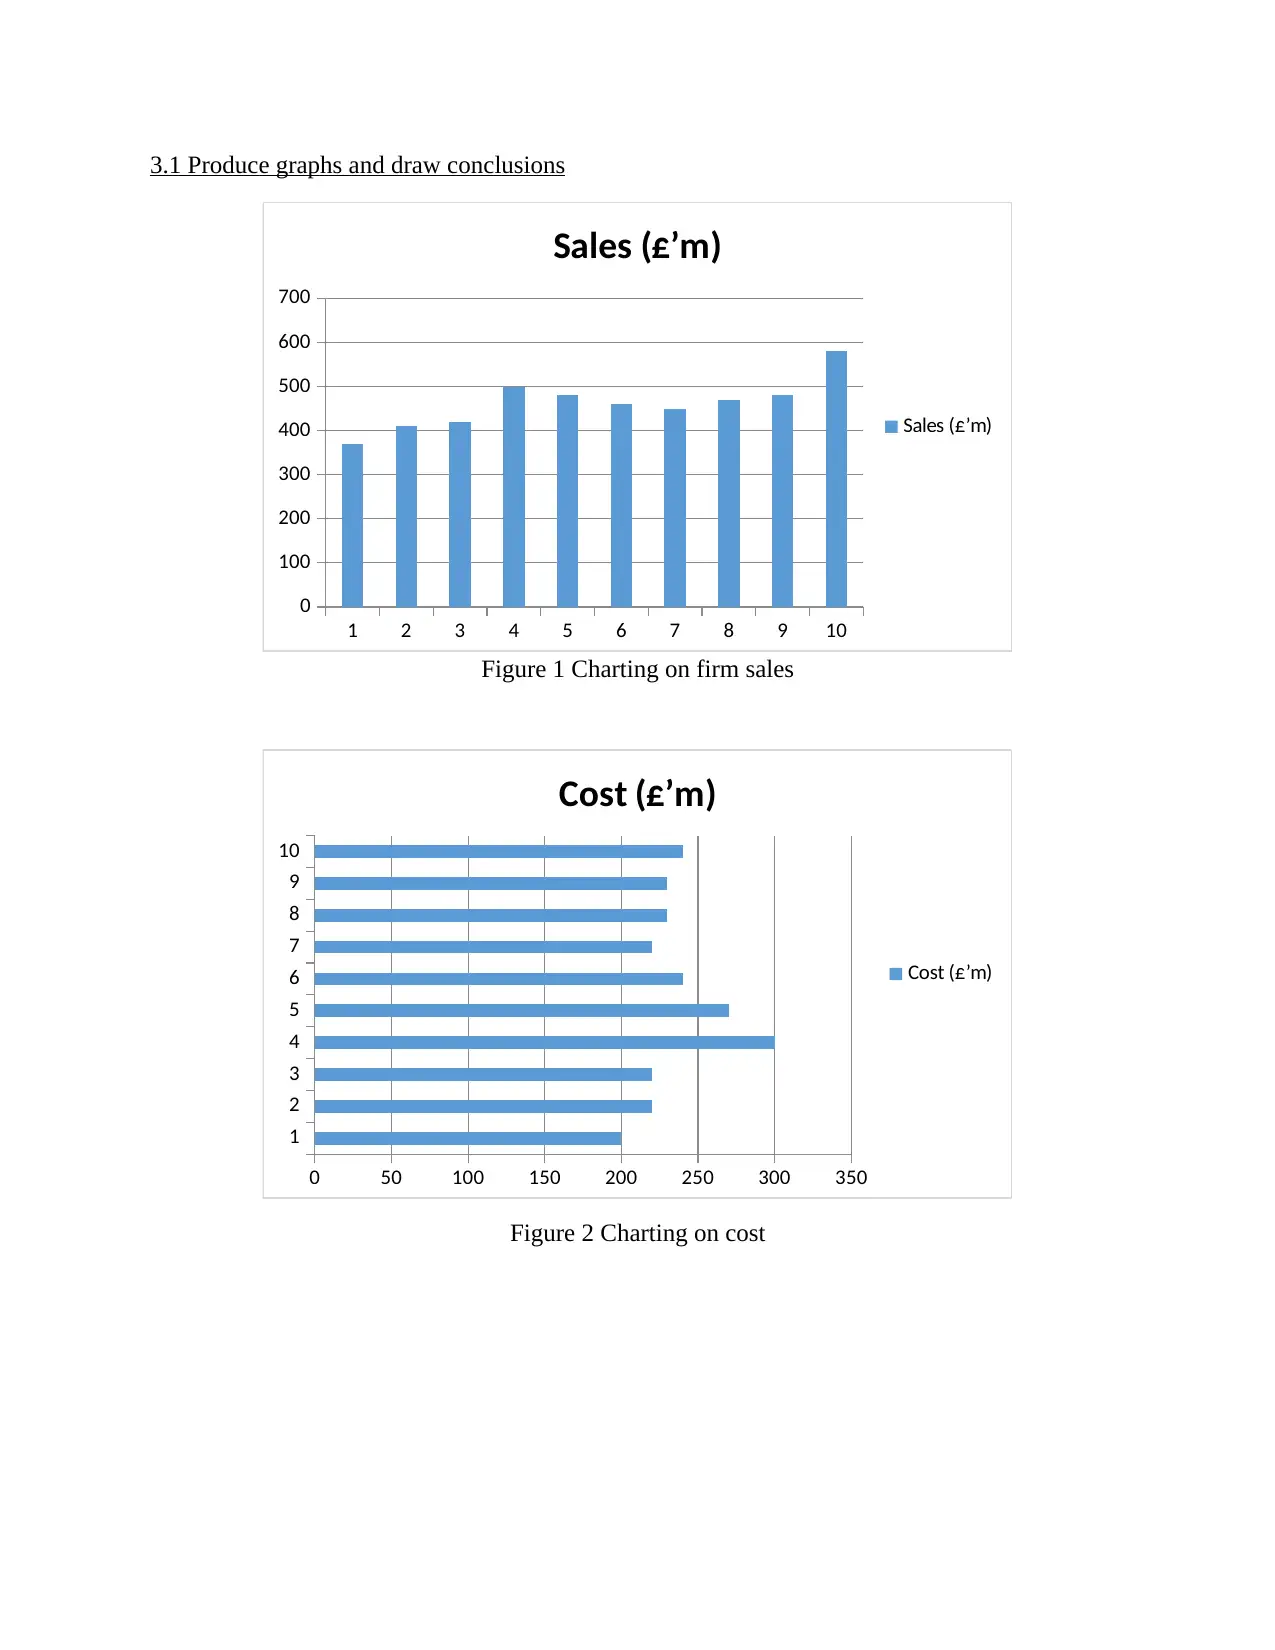
Figure 2 Charting on cost
1 2 3 4 5 6 7 8 9 10
0
100
200
300
400
500
600
700
Sales (£’m)
Sales (£’m)
Figure 1 Charting on firm sales
1
2
3
4
5
6
7
8
9
10
0 50 100 150 200 250 300 350
Cost (£’m)
Cost (£’m)
Figure 2 Charting on cost
1 2 3 4 5 6 7 8 9 10
0
50
100
150
200
250
300
350
400
Profit (£’m)
Profit (£’m)
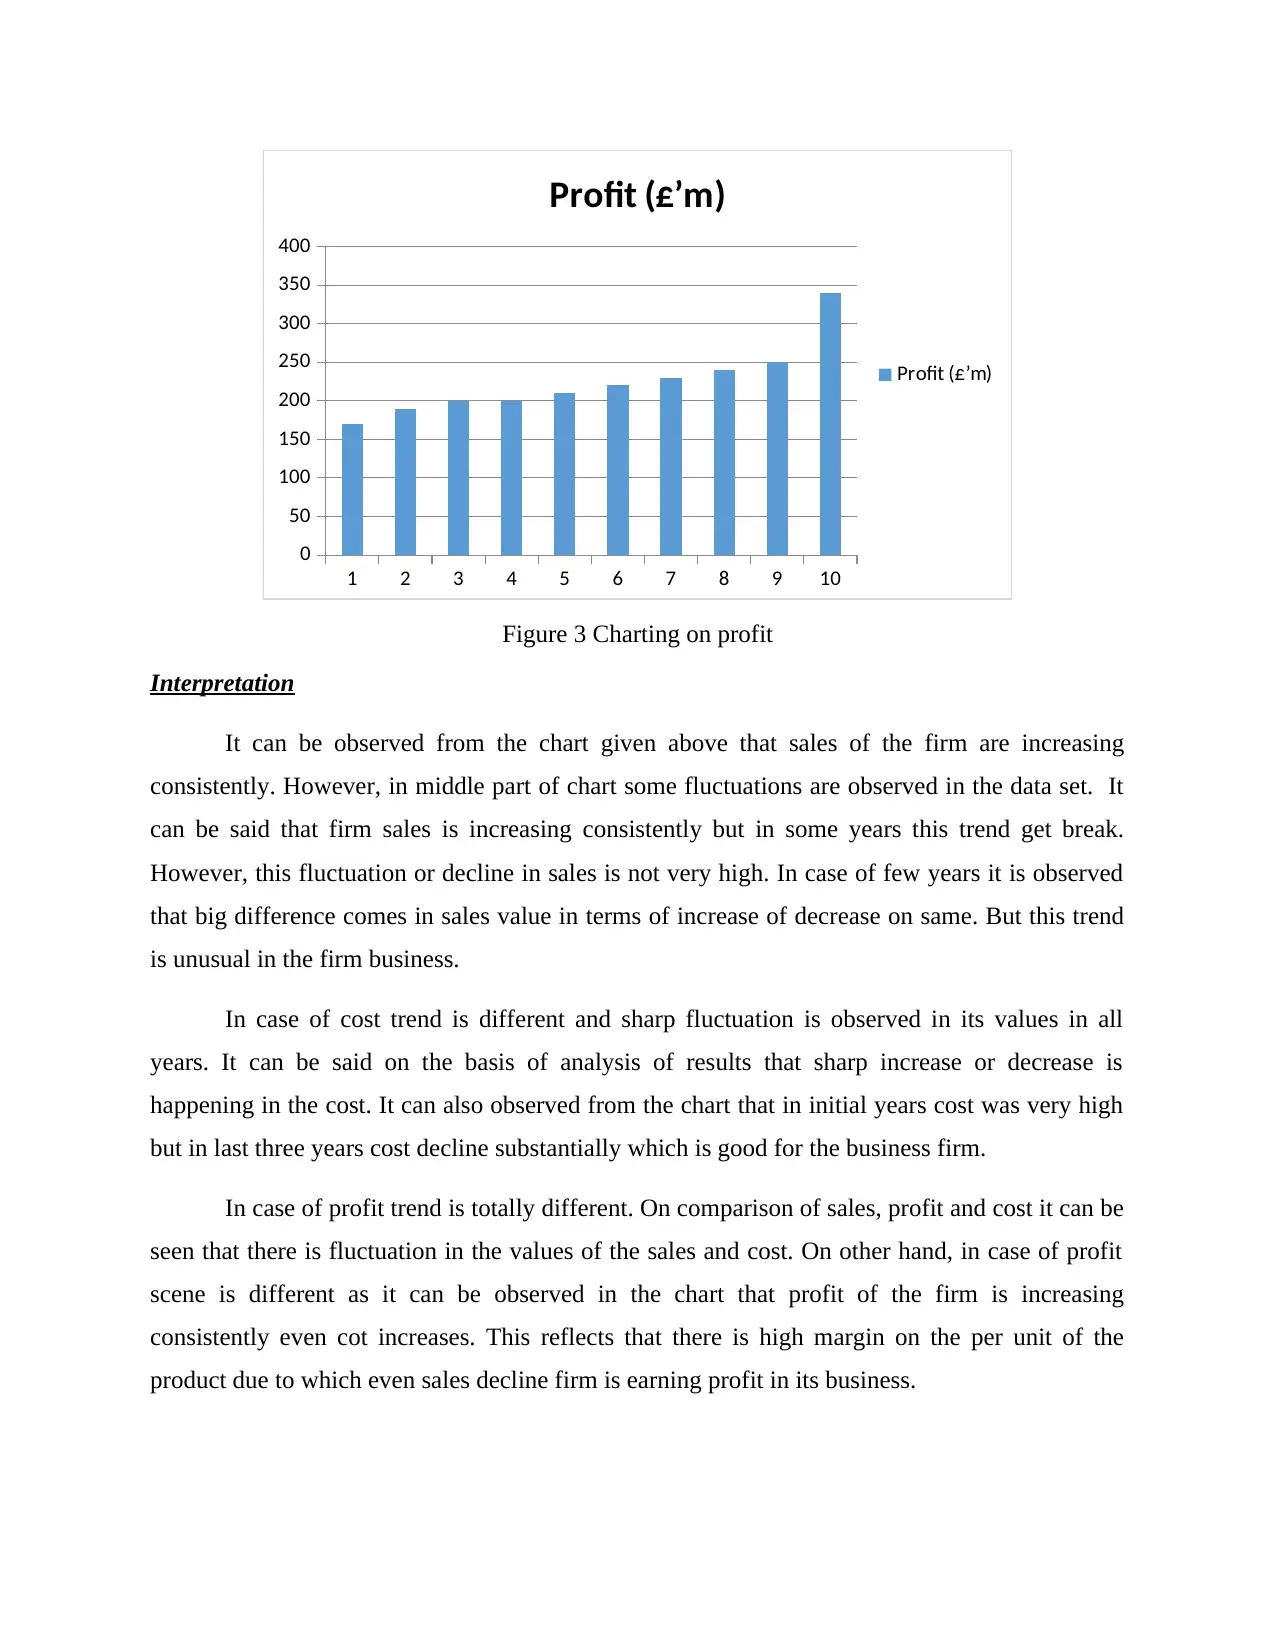
Figure 3 Charting on profit
Interpretation
It can be observed from the chart given above that sales of the firm are increasing
consistently. However, in middle part of chart some fluctuations are observed in the data set. It
can be said that firm sales is increasing consistently but in some years this trend get break.
However, this fluctuation or decline in sales is not very high. In case of few years it is observed
that big difference comes in sales value in terms of increase of decrease on same. But this trend
is unusual in the firm business.
In case of cost trend is different and sharp fluctuation is observed in its values in all
years. It can be said on the basis of analysis of results that sharp increase or decrease is
happening in the cost. It can also observed from the chart that in initial years cost was very high
but in last three years cost decline substantially which is good for the business firm.
In case of profit trend is totally different. On comparison of sales, profit and cost it can be
seen that there is fluctuation in the values of the sales and cost. On other hand, in case of profit
scene is different as it can be observed in the chart that profit of the firm is increasing
consistently even cot increases. This reflects that there is high margin on the per unit of the
product due to which even sales decline firm is earning profit in its business.
0
50
100
150
200
250
300
350
400
Profit (£’m)
Profit (£’m)
Figure 3 Charting on profit
Interpretation
It can be observed from the chart given above that sales of the firm are increasing
consistently. However, in middle part of chart some fluctuations are observed in the data set. It
can be said that firm sales is increasing consistently but in some years this trend get break.
However, this fluctuation or decline in sales is not very high. In case of few years it is observed
that big difference comes in sales value in terms of increase of decrease on same. But this trend
is unusual in the firm business.
In case of cost trend is different and sharp fluctuation is observed in its values in all
years. It can be said on the basis of analysis of results that sharp increase or decrease is
happening in the cost. It can also observed from the chart that in initial years cost was very high
but in last three years cost decline substantially which is good for the business firm.
In case of profit trend is totally different. On comparison of sales, profit and cost it can be
seen that there is fluctuation in the values of the sales and cost. On other hand, in case of profit
scene is different as it can be observed in the chart that profit of the firm is increasing
consistently even cot increases. This reflects that there is high margin on the per unit of the
product due to which even sales decline firm is earning profit in its business.
⊘ This is a preview!⊘
Do you want full access?
Subscribe today to unlock all pages.
Trusted by 1+ million students worldwide
1 out of 19
Related Documents


Your All-in-One AI-Powered Toolkit for Academic Success.
+13062052269
info@desklib.com
Available 24*7 on WhatsApp / Email
![[object Object]](/_next/static/media/star-bottom.7253800d.svg)
Unlock your academic potential
Copyright © 2020–2026 A2Z Services. All Rights Reserved. Developed and managed by ZUCOL.