Regression Analysis and Interpretation: Business Statistics Report

Verified

Added on  2020/12/24

|6
|1359
|252
Report
AI Summary
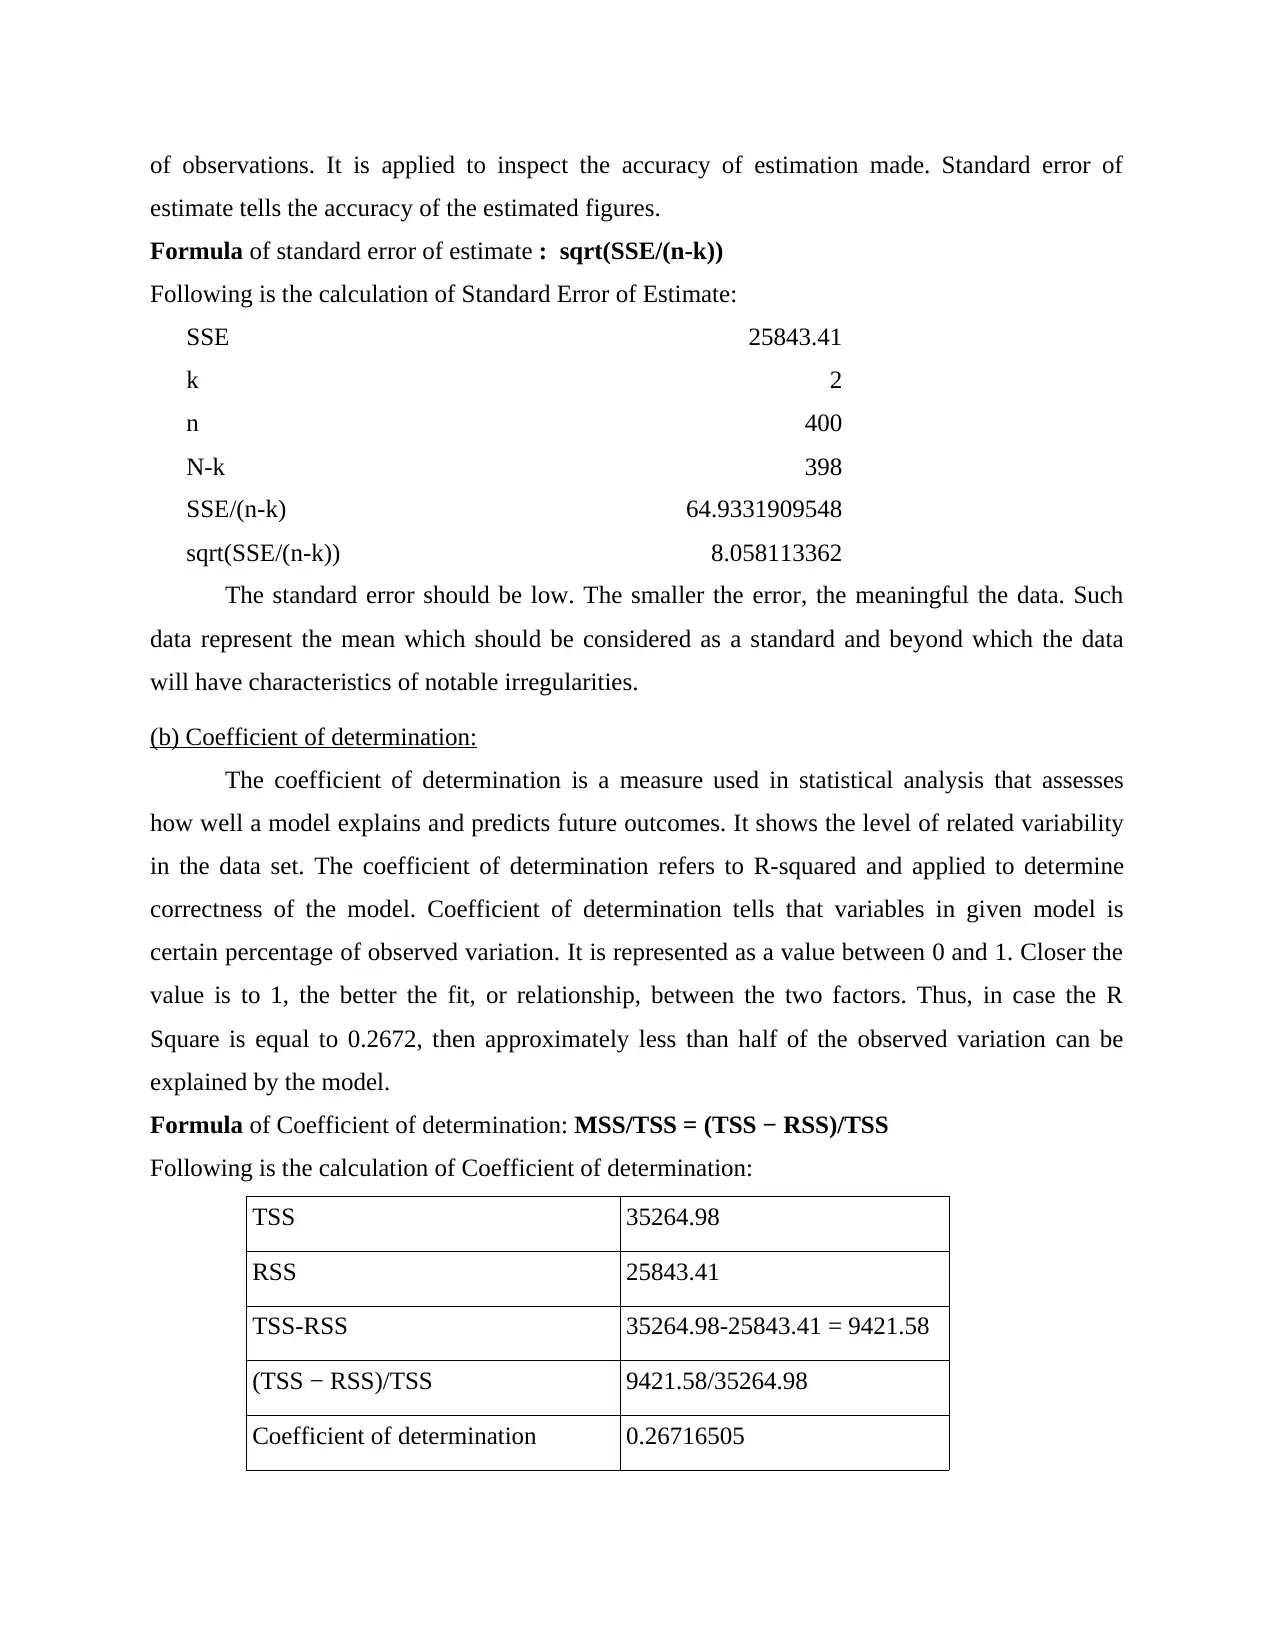
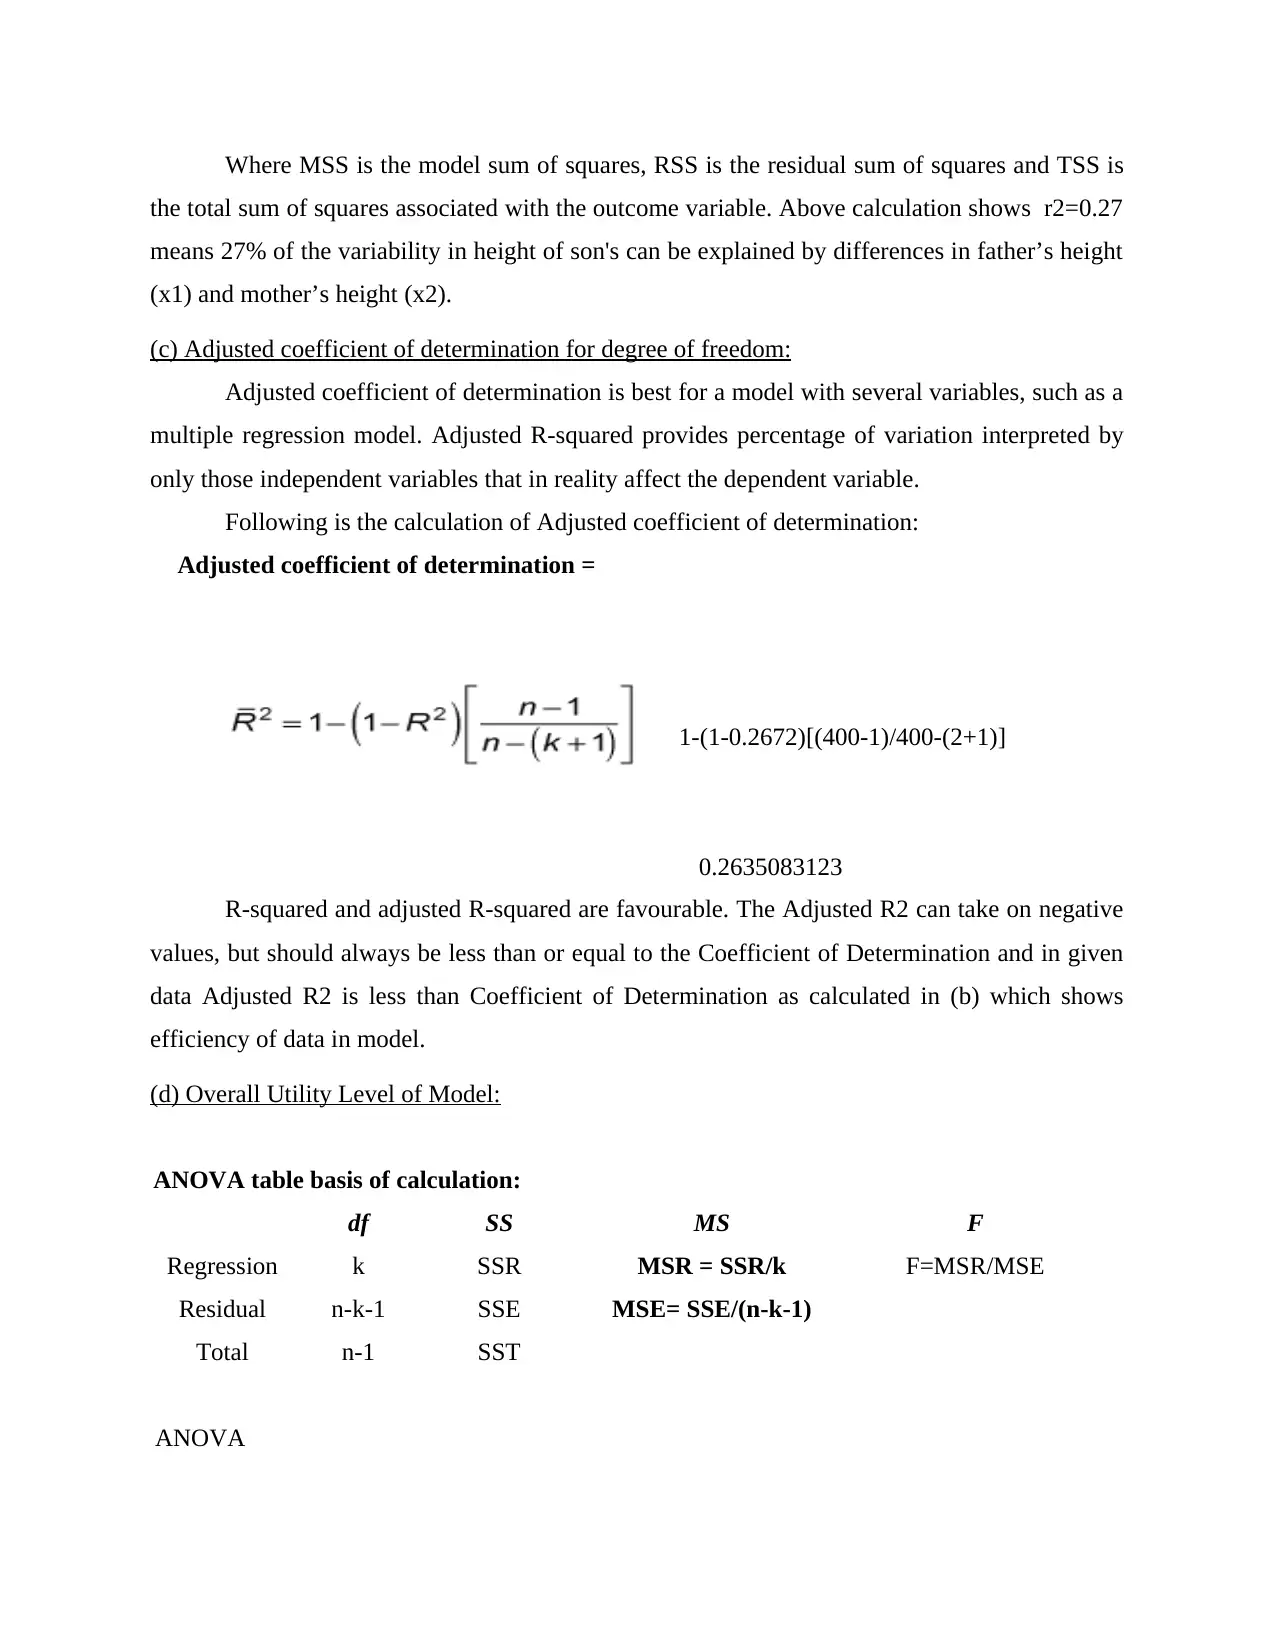
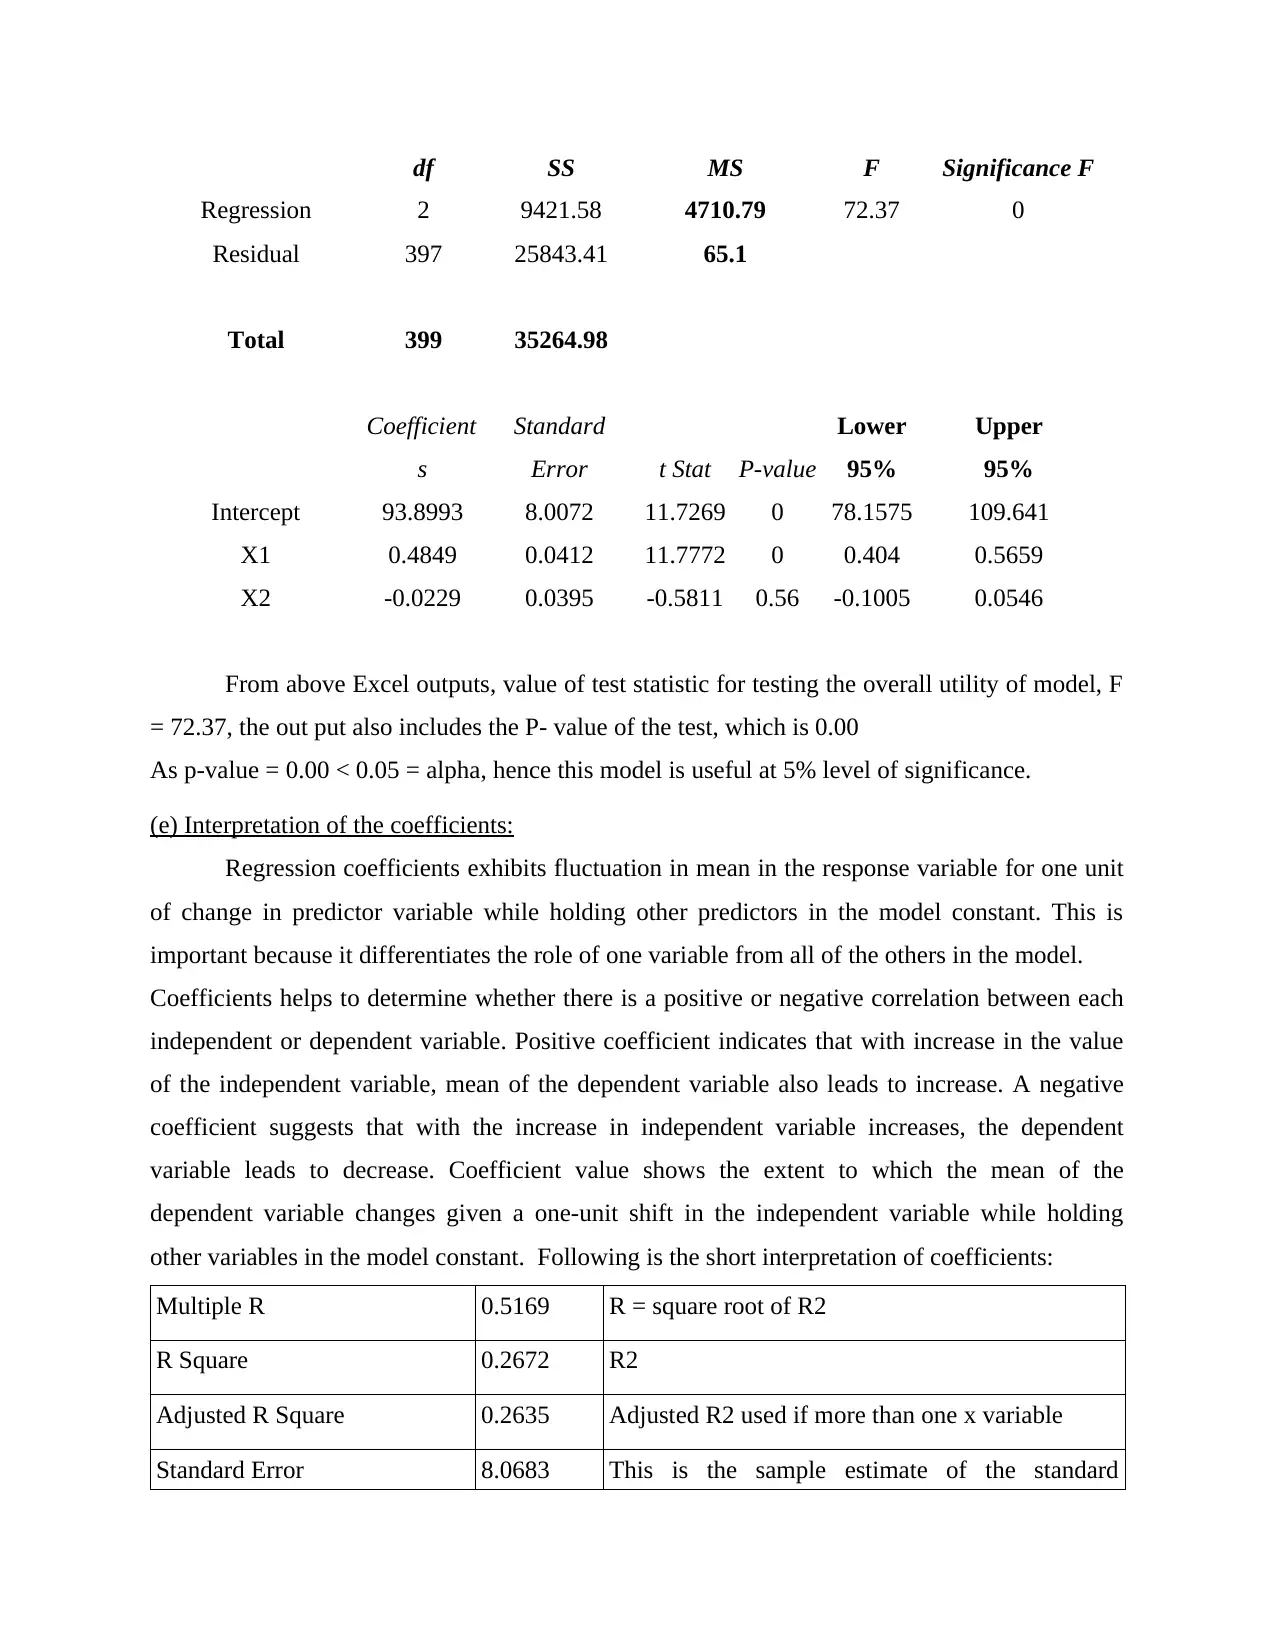
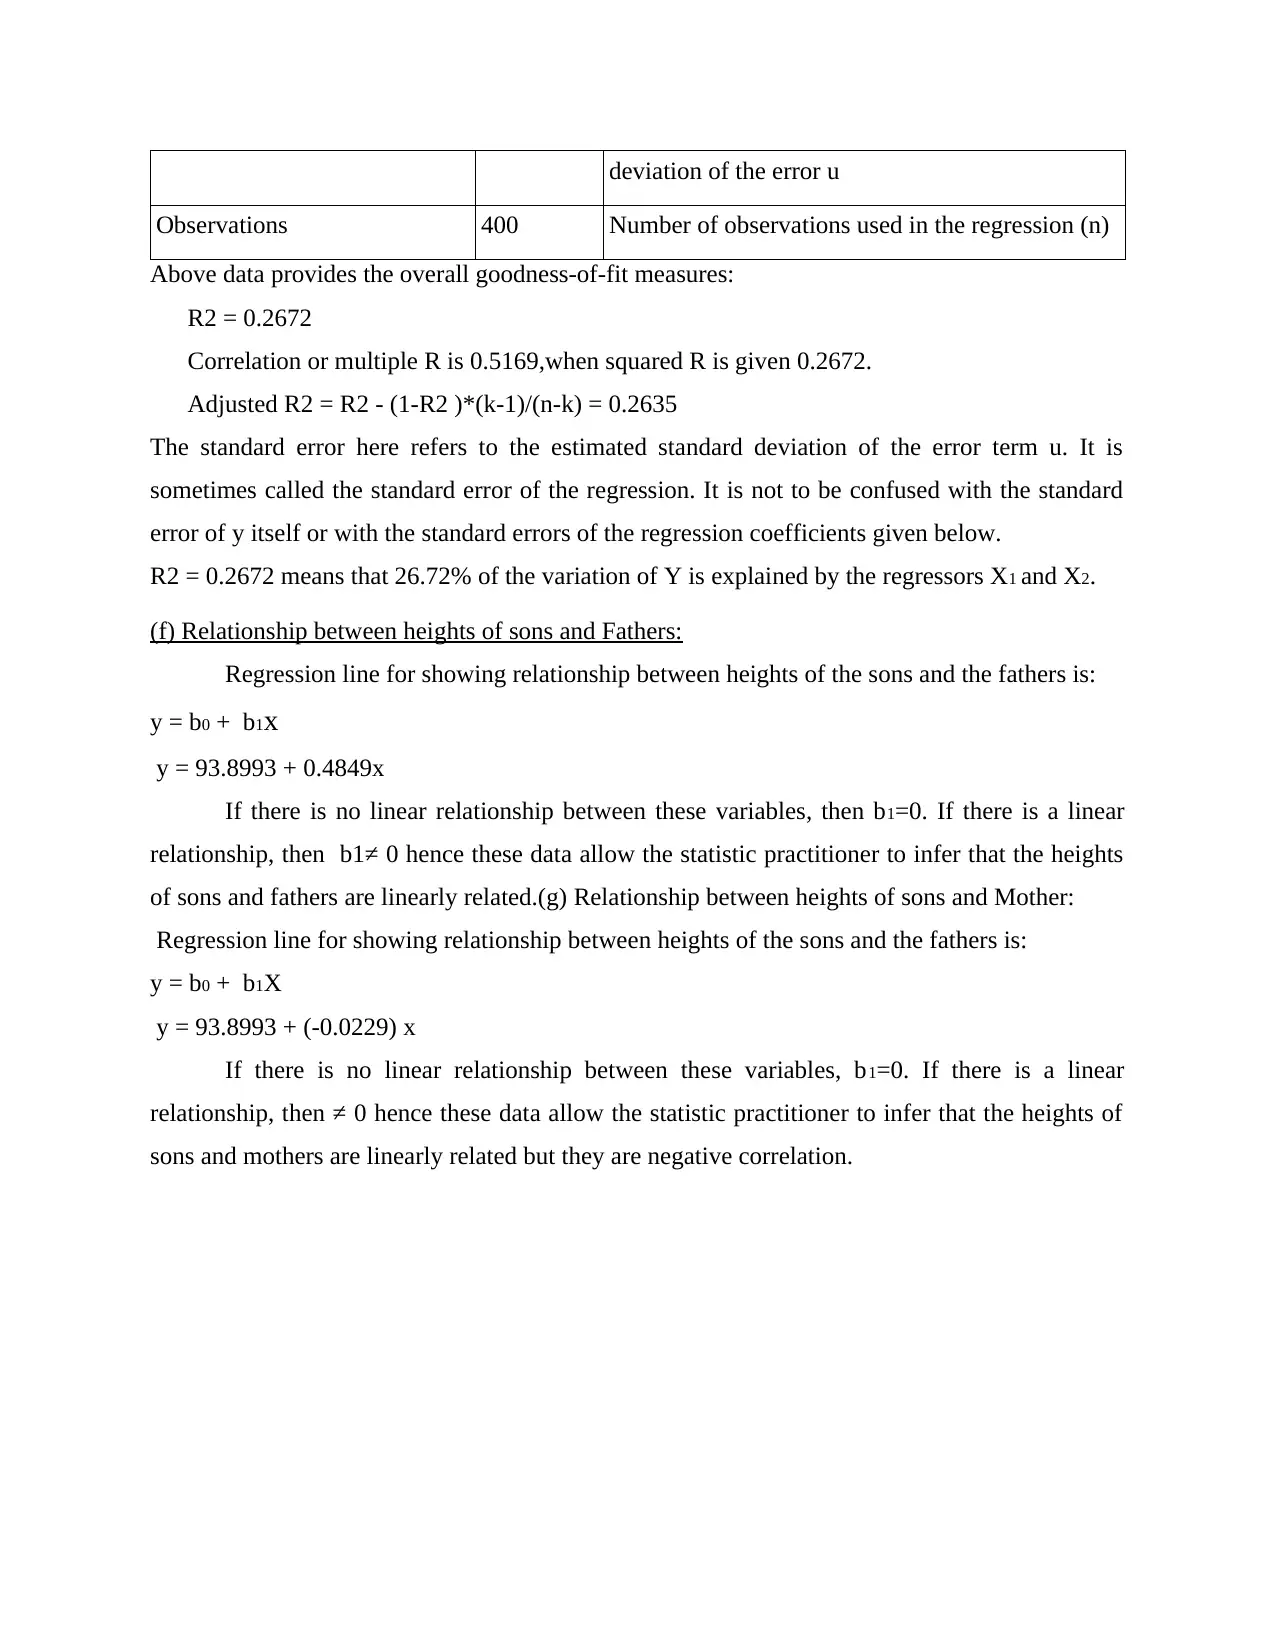
This report provides a comprehensive analysis of business statistics, focusing on regression analysis. It begins with the calculation and interpretation of the standard error of the estimate, emphasizing its role in assessing the accuracy of estimations. The report then delves into the coefficient of determination (R-squared), explaining how it measures the goodness of fit of the model and the percentage of variance explained by the variables. Furthermore, it explores the adjusted coefficient of determination, which is particularly useful for models with multiple variables. The report includes an ANOVA table and discusses the overall utility level of the model, along with the interpretation of the coefficients to understand the relationship between variables. Finally, it examines the relationship between the heights of sons and fathers, and sons and mothers using regression lines, providing insights into the correlation between these variables. The analysis is based on real-world data and provides valuable insights into statistical modeling and interpretation.
Document Page
Business statistic
tabler-icon-diamond-filled.svg

Paraphrase This Document

Need a fresh take? Get an instant paraphrase of this document with our AI Paraphraser
Document Page
Table of Contents
QUESTION 2...................................................................................................................................3
(a) Standard Error of Estimate:...............................................................................................3
(b) Coefficient of determination:............................................................................................3
(c) Adjusted coefficient of determination for degree of freedom:.........................................4
(d) Overall Utility Level of Model:........................................................................................4
(e) Interpretation of the coefficients:......................................................................................5
(f) Relationship between heights of sons and Fathers:...........................................................6
QUESTION 2
(a) Standard Error of Estimate:
The standard error of estimation is an estimated standard deviation of the error term “u”.
It also known as standard error of the regression. Standard Error of Estimate is shows variation
Document Page
of observations. It is applied to inspect the accuracy of estimation made. Standard error of
estimate tells the accuracy of the estimated figures.
Formula of standard error of estimate : sqrt(SSE/(n-k))
Following is the calculation of Standard Error of Estimate:
SSE 25843.41
k 2
n 400
N-k 398
SSE/(n-k) 64.9331909548
sqrt(SSE/(n-k)) 8.058113362
The standard error should be low. The smaller the error, the meaningful the data. Such
data represent the mean which should be considered as a standard and beyond which the data
will have characteristics of notable irregularities.
(b) Coefficient of determination:
The coefficient of determination is a measure used in statistical analysis that assesses
how well a model explains and predicts future outcomes. It shows the level of related variability
in the data set. The coefficient of determination refers to R-squared and applied to determine
correctness of the model. Coefficient of determination tells that variables in given model is
certain percentage of observed variation. It is represented as a value between 0 and 1. Closer the
value is to 1, the better the fit, or relationship, between the two factors. Thus, in case the R
Square is equal to 0.2672, then approximately less than half of the observed variation can be
explained by the model.
Formula of Coefficient of determination: MSS/TSS = (TSS − RSS)/TSS
Following is the calculation of Coefficient of determination:
TSS 35264.98
RSS 25843.41
TSS-RSS 35264.98-25843.41 = 9421.58
(TSS − RSS)/TSS 9421.58/35264.98
Coefficient of determination 0.26716505
Document Page
Where MSS is the model sum of squares, RSS is the residual sum of squares and TSS is
the total sum of squares associated with the outcome variable. Above calculation shows r2=0.27
means 27% of the variability in height of son's can be explained by differences in father’s height
(x1) and mother’s height (x2).
(c) Adjusted coefficient of determination for degree of freedom:
Adjusted coefficient of determination is best for a model with several variables, such as a
multiple regression model. Adjusted R-squared provides percentage of variation interpreted by
only those independent variables that in reality affect the dependent variable.
Following is the calculation of Adjusted coefficient of determination:
Adjusted coefficient of determination =
1-(1-0.2672)[(400-1)/400-(2+1)]
0.2635083123
R-squared and adjusted R-squared are favourable. The Adjusted R2 can take on negative
values, but should always be less than or equal to the Coefficient of Determination and in given
data Adjusted R2 is less than Coefficient of Determination as calculated in (b) which shows
efficiency of data in model.
(d) Overall Utility Level of Model:
ANOVA table basis of calculation:
df SS MS F
Regression k SSR MSR = SSR/k F=MSR/MSE
Residual n-k-1 SSE MSE= SSE/(n-k-1)
Total n-1 SST
ANOVA
tabler-icon-diamond-filled.svg

Paraphrase This Document

Need a fresh take? Get an instant paraphrase of this document with our AI Paraphraser
Document Page
df SS MS F Significance F
Regression 2 9421.58 4710.79 72.37 0
Residual 397 25843.41 65.1
Total 399 35264.98
Coefficient
s
Standard
Error t Stat P-value
Lower
95%
Upper
95%
Intercept 93.8993 8.0072 11.7269 0 78.1575 109.641
X1 0.4849 0.0412 11.7772 0 0.404 0.5659
X2 -0.0229 0.0395 -0.5811 0.56 -0.1005 0.0546
From above Excel outputs, value of test statistic for testing the overall utility of model, F
= 72.37, the out put also includes the P- value of the test, which is 0.00
As p-value = 0.00 < 0.05 = alpha, hence this model is useful at 5% level of significance.
(e) Interpretation of the coefficients:
Regression coefficients exhibits fluctuation in mean in the response variable for one unit
of change in predictor variable while holding other predictors in the model constant. This is
important because it differentiates the role of one variable from all of the others in the model.
Coefficients helps to determine whether there is a positive or negative correlation between each
independent or dependent variable. Positive coefficient indicates that with increase in the value
of the independent variable, mean of the dependent variable also leads to increase. A negative
coefficient suggests that with the increase in independent variable increases, the dependent
variable leads to decrease. Coefficient value shows the extent to which the mean of the
dependent variable changes given a one-unit shift in the independent variable while holding
other variables in the model constant. Following is the short interpretation of coefficients:
Multiple R 0.5169 R = square root of R2
R Square 0.2672 R2
Adjusted R Square 0.2635 Adjusted R2 used if more than one x variable
Standard Error 8.0683 This is the sample estimate of the standard
Document Page
deviation of the error u
Observations 400 Number of observations used in the regression (n)
Above data provides the overall goodness-of-fit measures:
R2 = 0.2672
Correlation or multiple R is 0.5169,when squared R is given 0.2672.
Adjusted R2 = R2 - (1-R2 )*(k-1)/(n-k) = 0.2635
The standard error here refers to the estimated standard deviation of the error term u. It is
sometimes called the standard error of the regression. It is not to be confused with the standard
error of y itself or with the standard errors of the regression coefficients given below.
R2 = 0.2672 means that 26.72% of the variation of Y is explained by the regressors X1 and X2.
(f) Relationship between heights of sons and Fathers:
Regression line for showing relationship between heights of the sons and the fathers is:
y = b0 + b1x
y = 93.8993 + 0.4849x
If there is no linear relationship between these variables, then b1=0. If there is a linear
relationship, then b1≠ 0 hence these data allow the statistic practitioner to infer that the heights
of sons and fathers are linearly related.(g) Relationship between heights of sons and Mother:
Regression line for showing relationship between heights of the sons and the fathers is:
y = b0 + b1X
y = 93.8993 + (-0.0229) x
If there is no linear relationship between these variables, b1=0. If there is a linear
relationship, then ≠ 0 hence these data allow the statistic practitioner to infer that the heights of
sons and mothers are linearly related but they are negative correlation.
chevron_up_icon
1 out of 6
circle_padding
hide_on_mobile
zoom_out_icon
[object Object]