Business Statistics Report: Data Analysis and Findings
VerifiedAdded on 2020/02/24
|5
|688
|114
Report
AI Summary
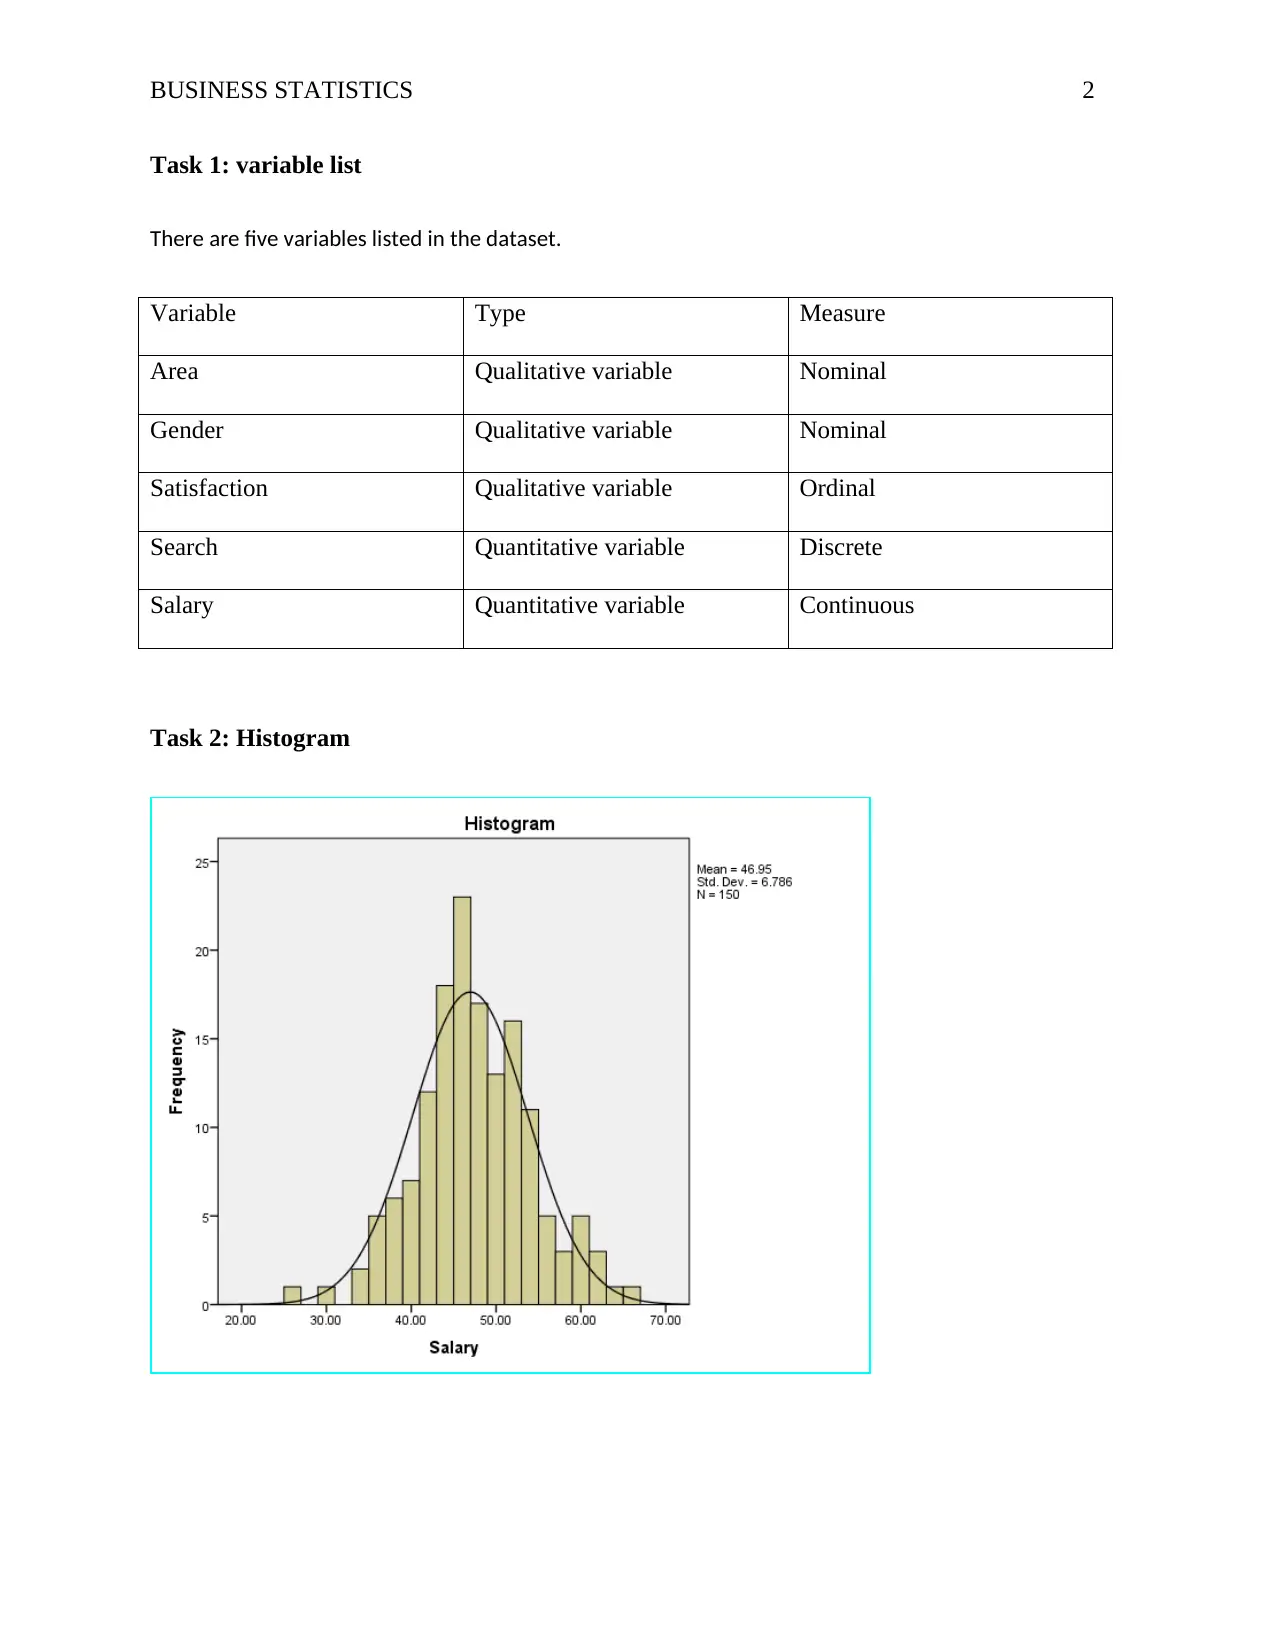
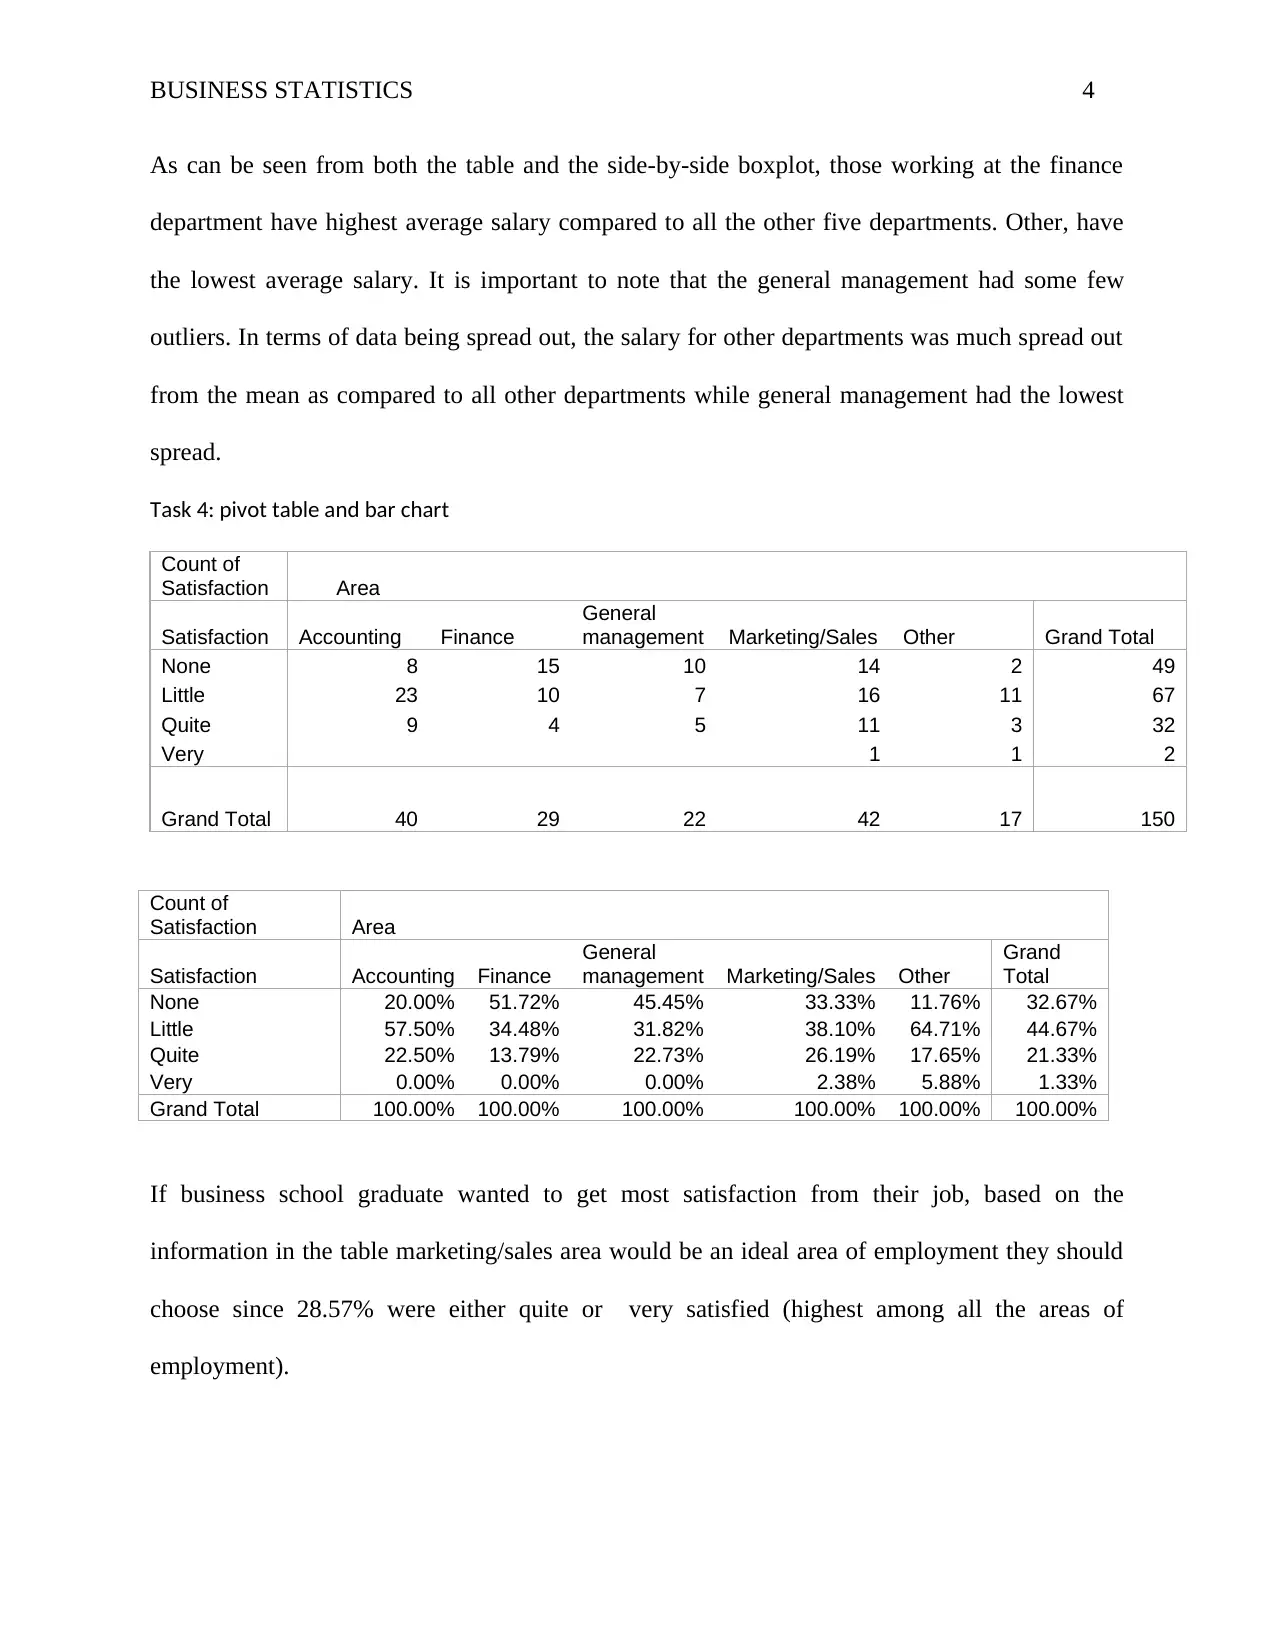
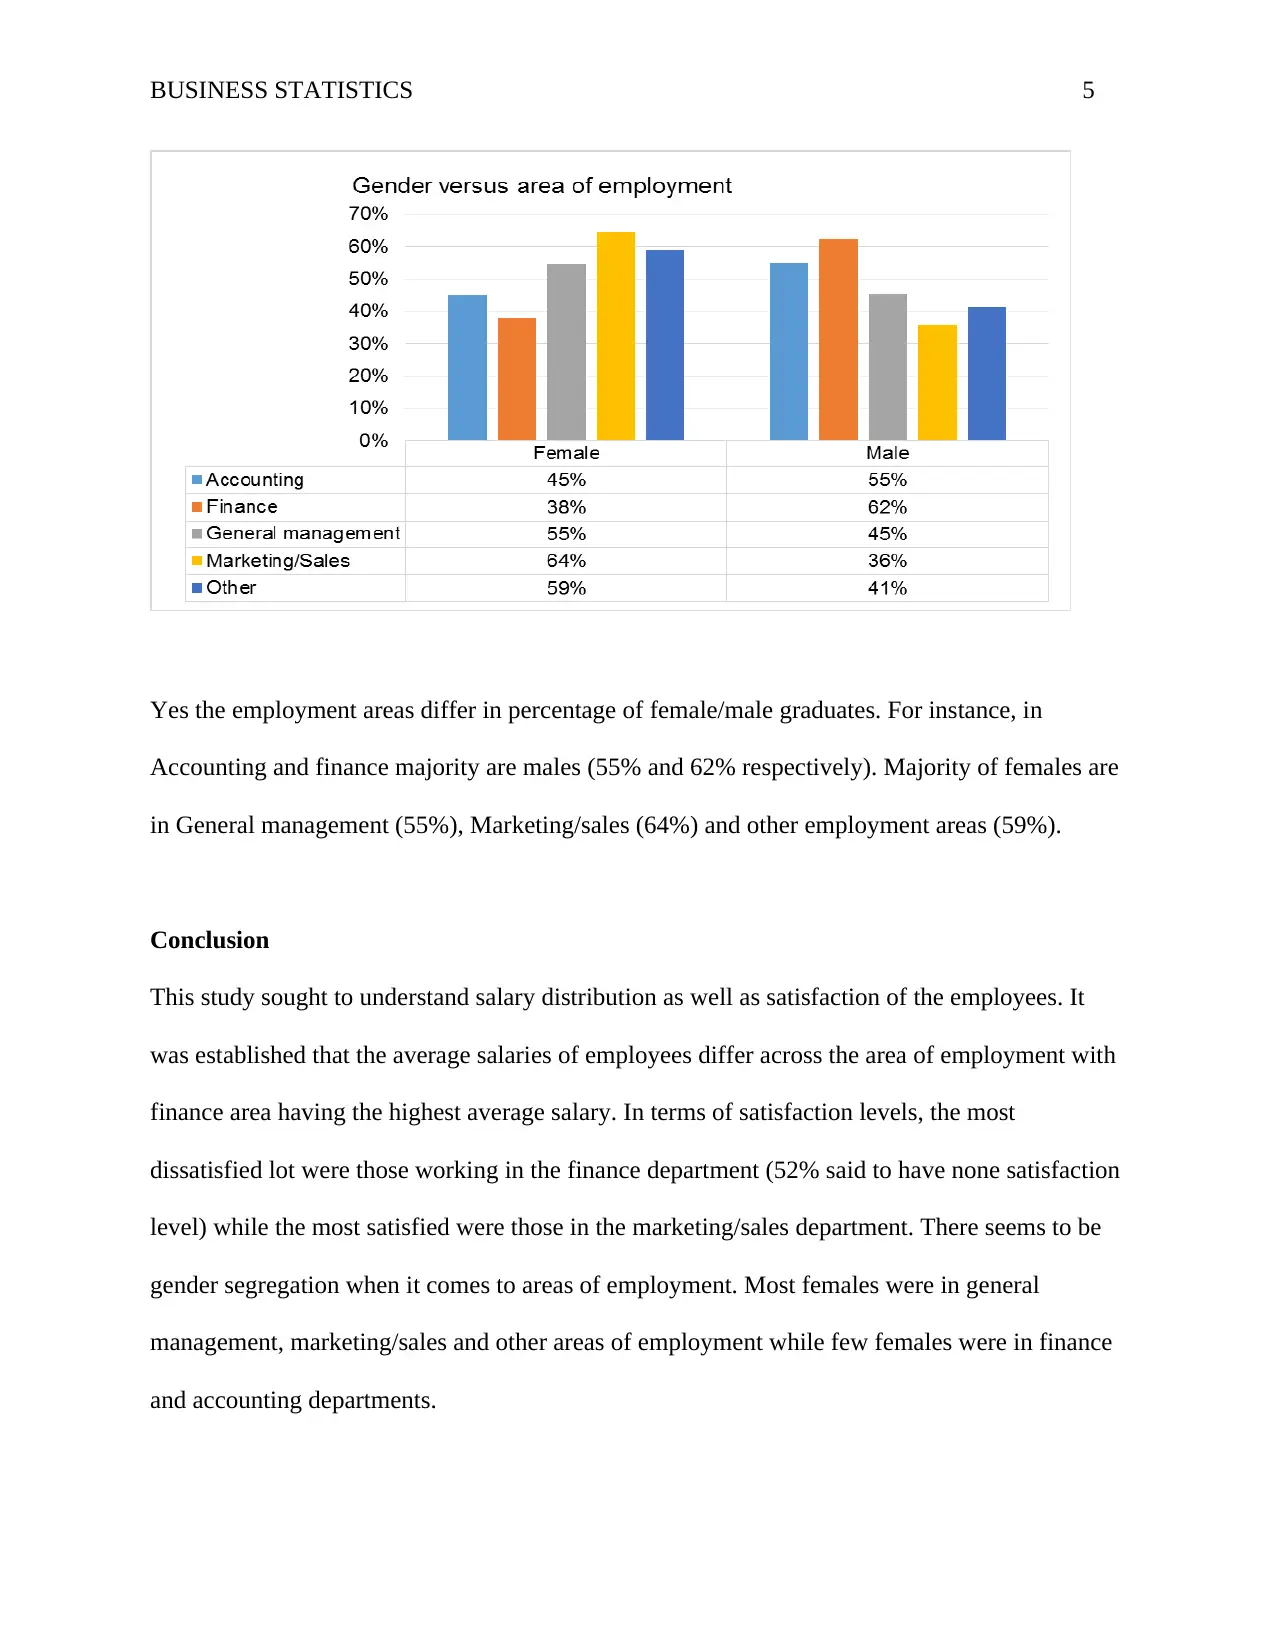
This business statistics report analyzes a dataset containing variables like area of employment, gender, satisfaction level, search frequency, and salary. The report begins with a variable list, followed by a histogram analysis suggesting a symmetric distribution, with the median as the preferred measure of central tendency due to outliers. Descriptive statistics are presented, revealing that the finance department has the highest average salary, while the 'Other' department has the lowest. A pivot table and bar chart are used to analyze satisfaction levels across different employment areas, with marketing/sales showing the highest satisfaction. The report concludes with observations on salary distribution, satisfaction levels, and gender segregation in employment areas, with the finance department having the lowest satisfaction and a gender imbalance.

1 out of 5

Your All-in-One AI-Powered Toolkit for Academic Success.
+13062052269
info@desklib.com
Available 24*7 on WhatsApp / Email
![[object Object]](/_next/static/media/star-bottom.7253800d.svg)
Copyright © 2020–2026 A2Z Services. All Rights Reserved. Developed and managed by ZUCOL.