MA508: Business Statistics Analysis of ABZ Company Sales Report

Verified

Added on  2022/11/29

|8
|1518
|240
Report
AI Summary
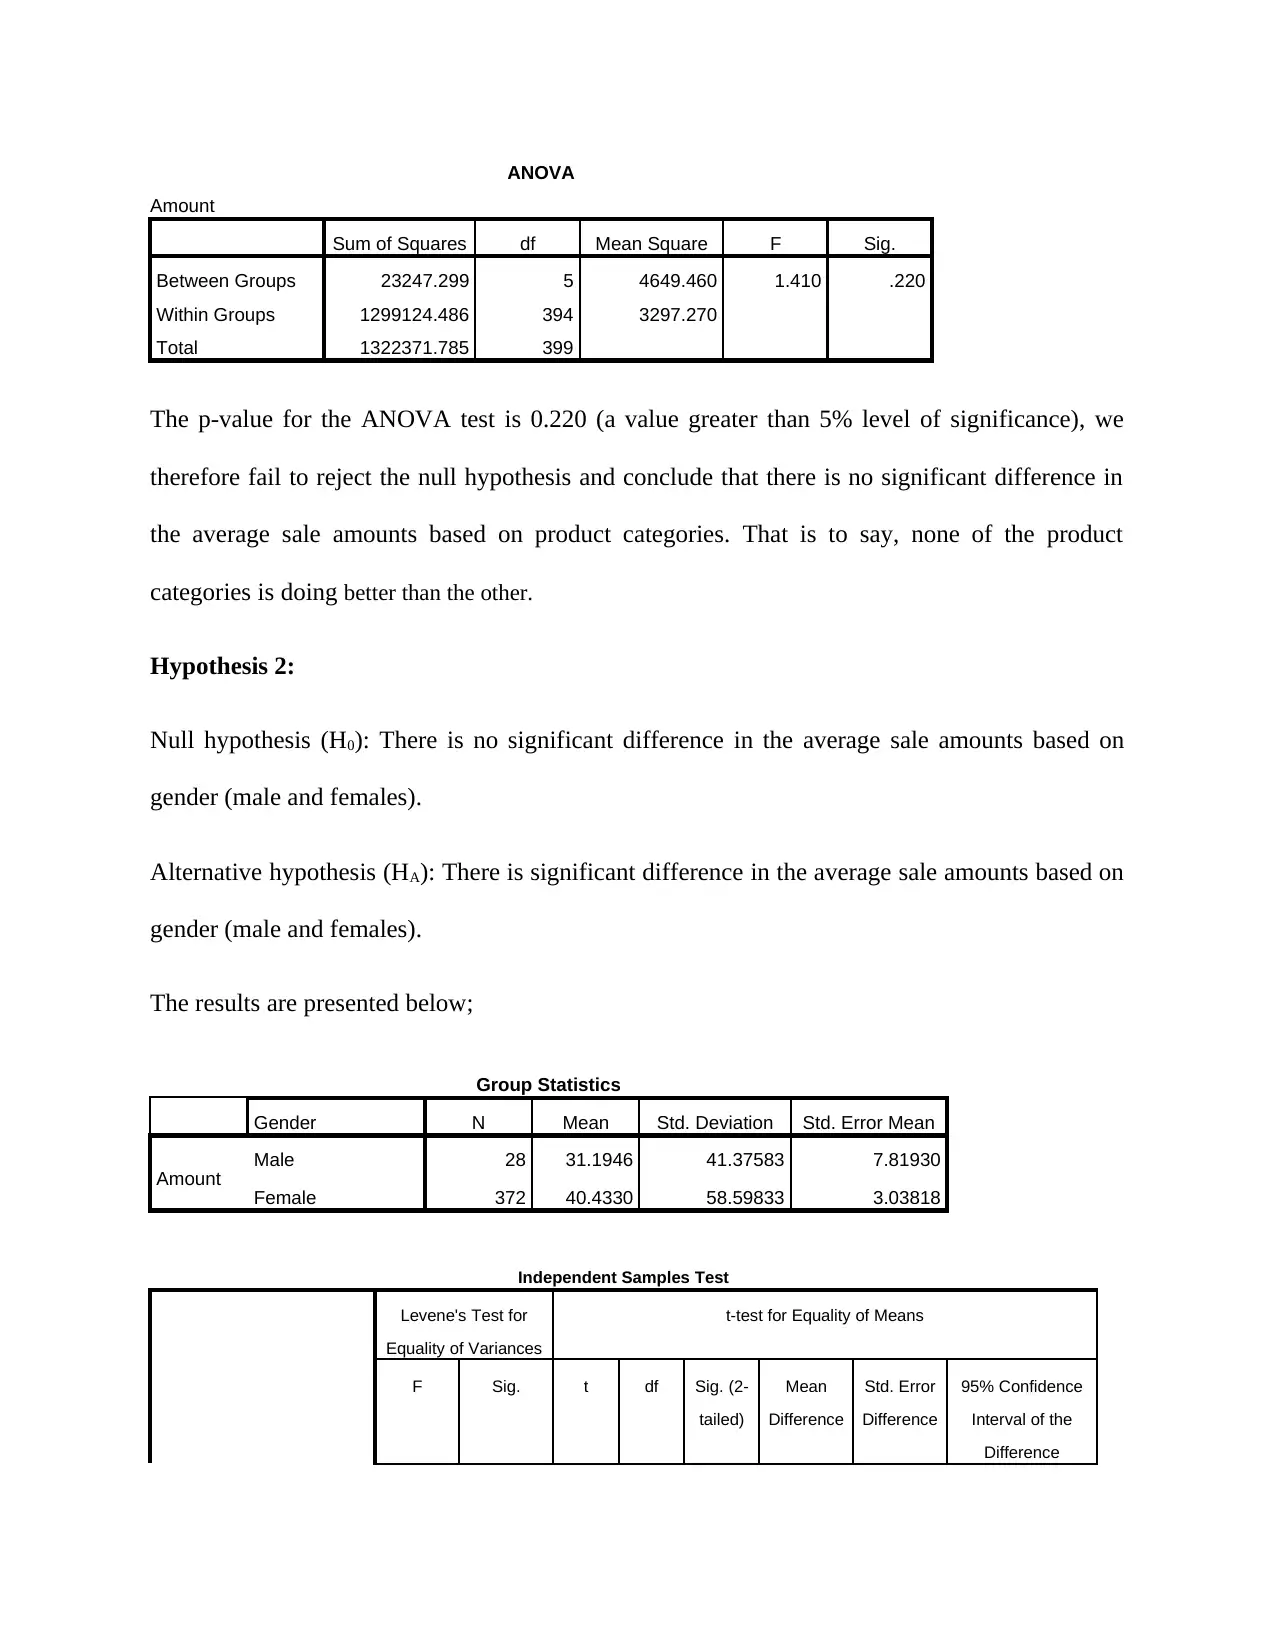
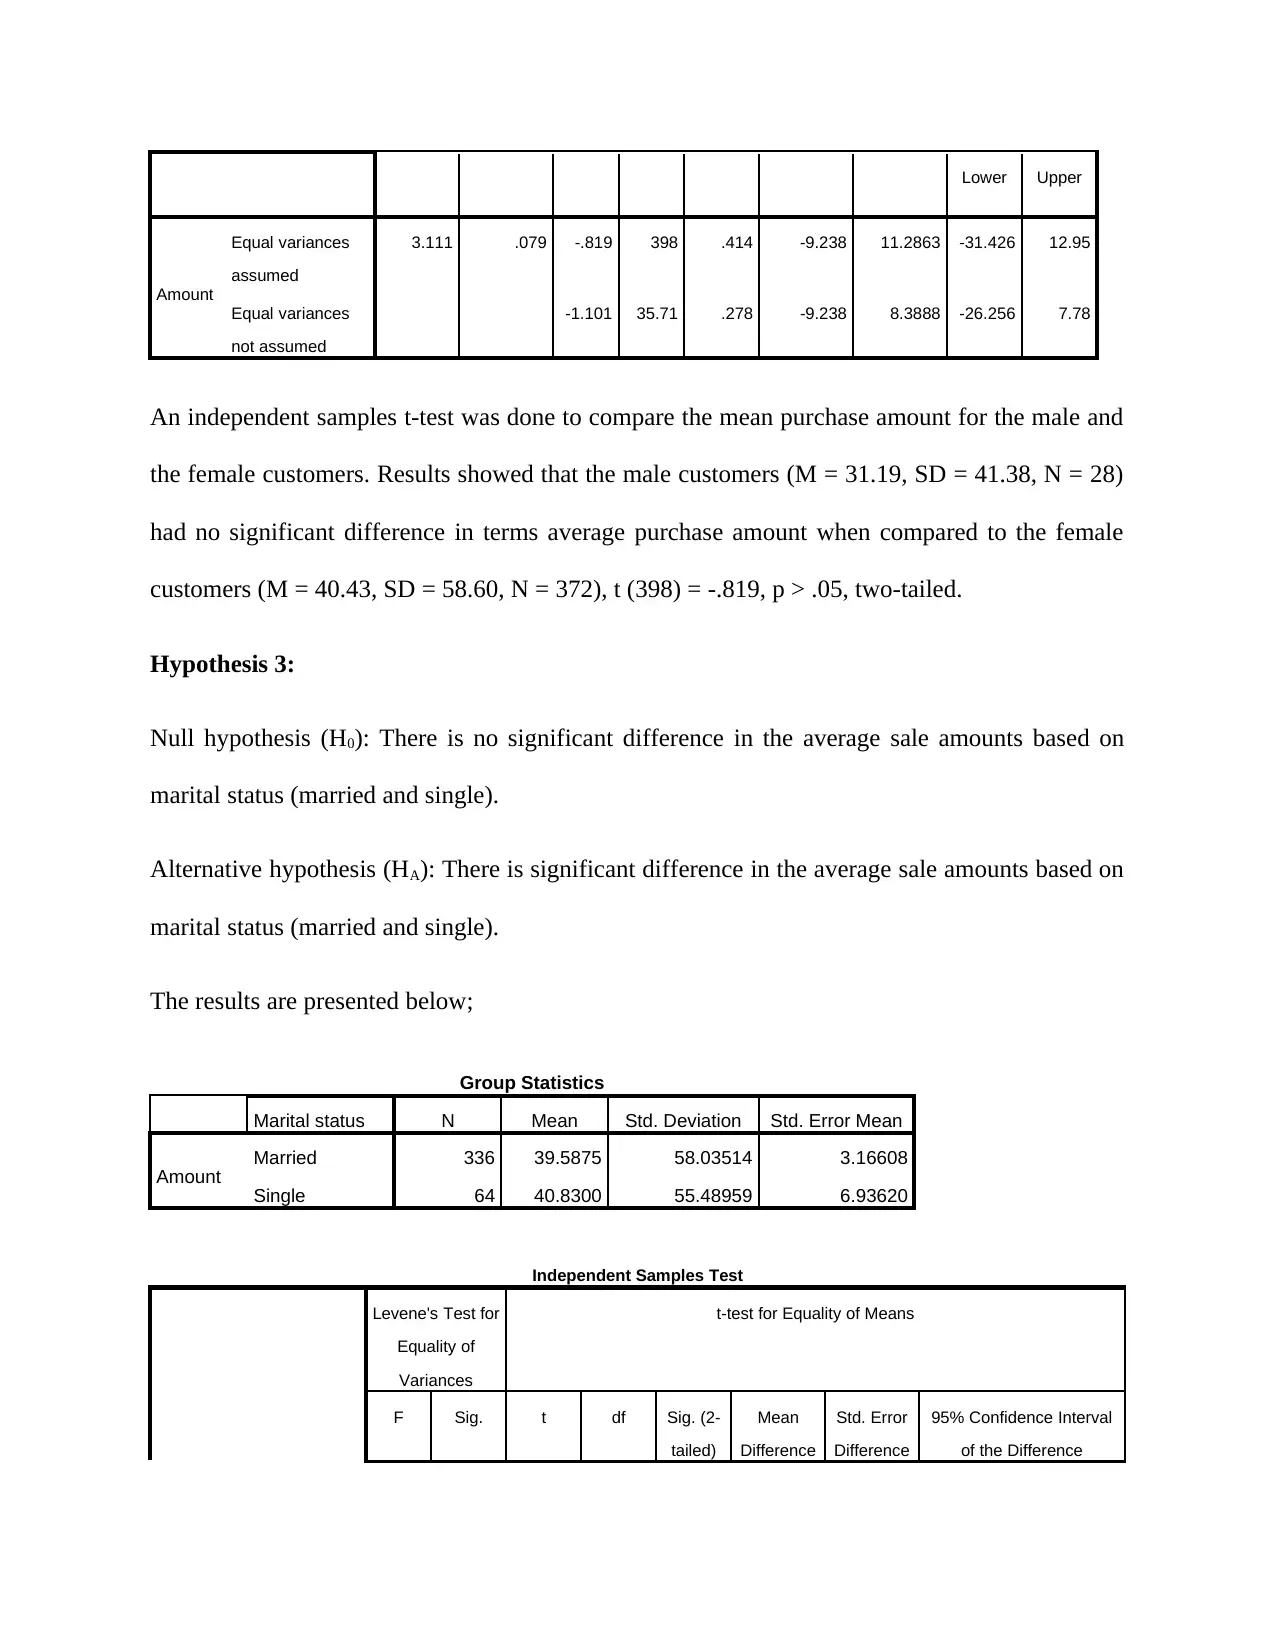
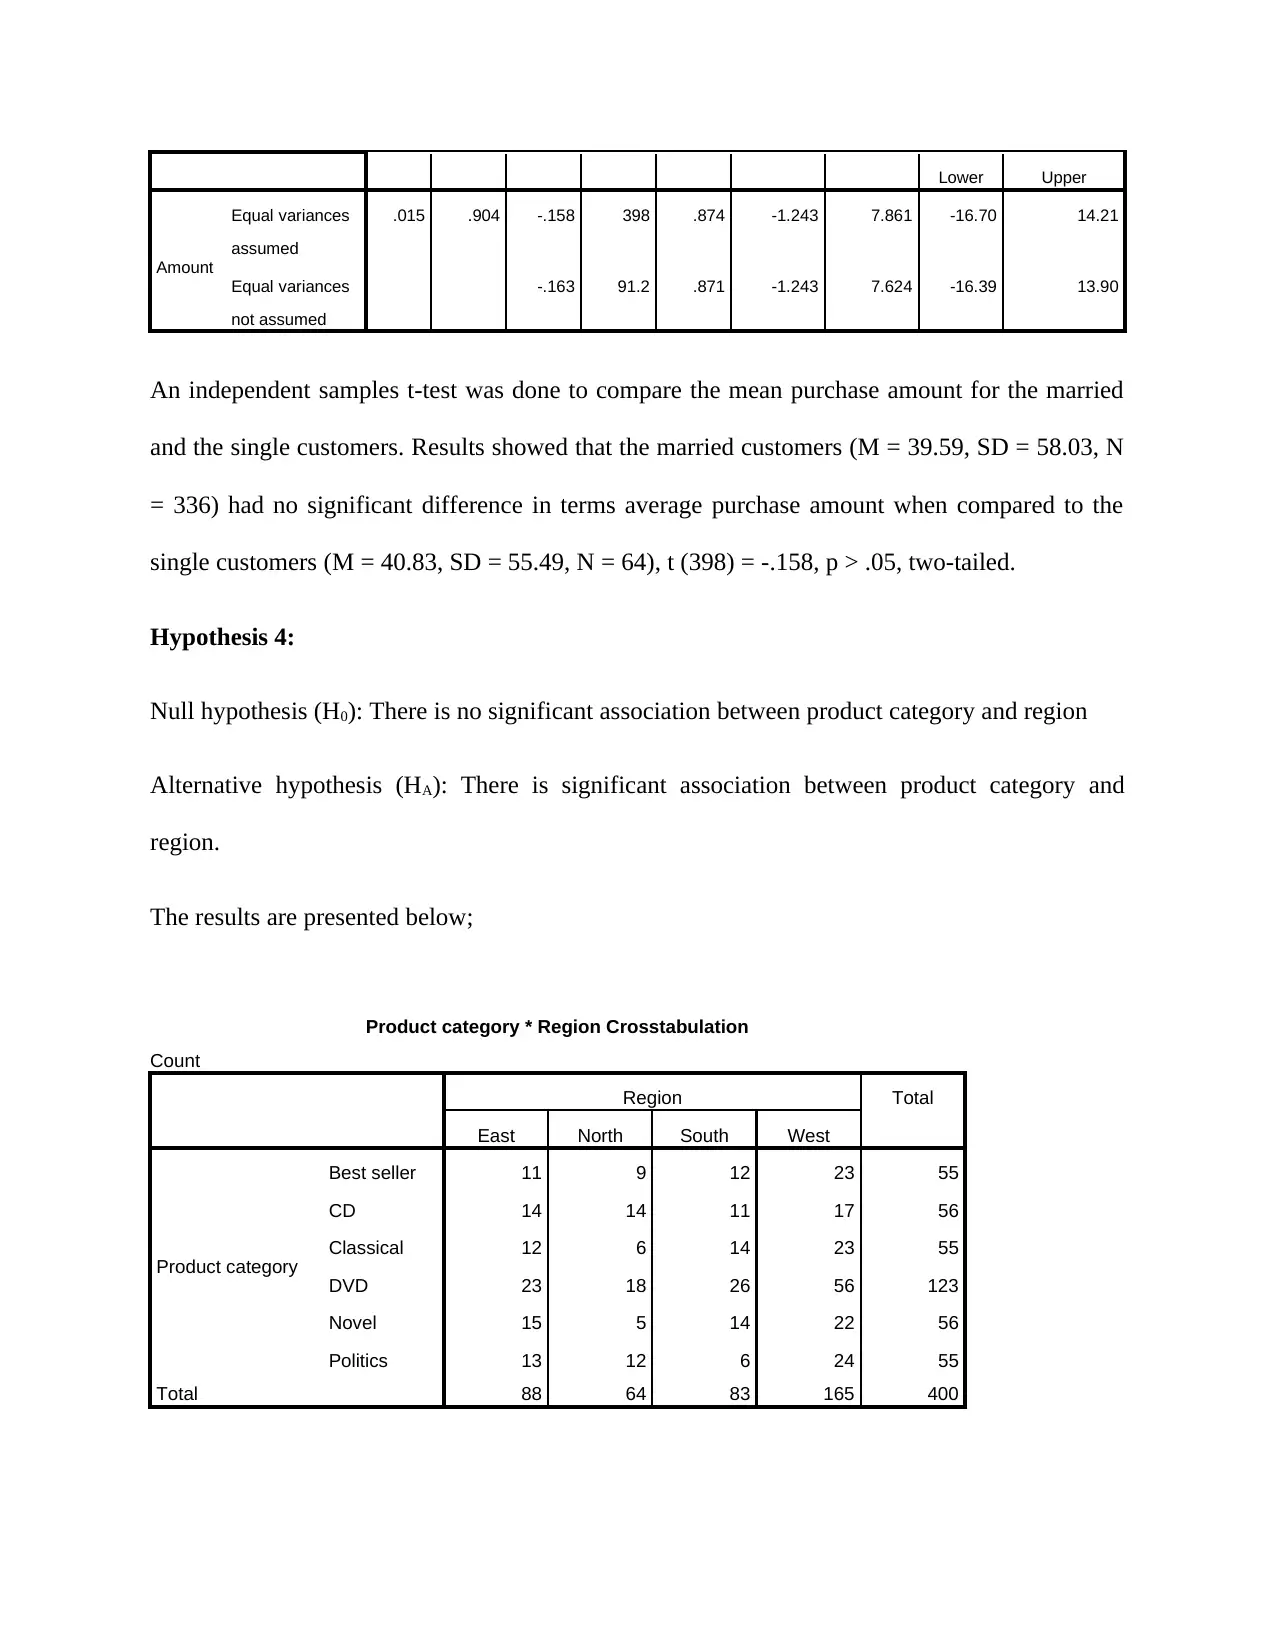
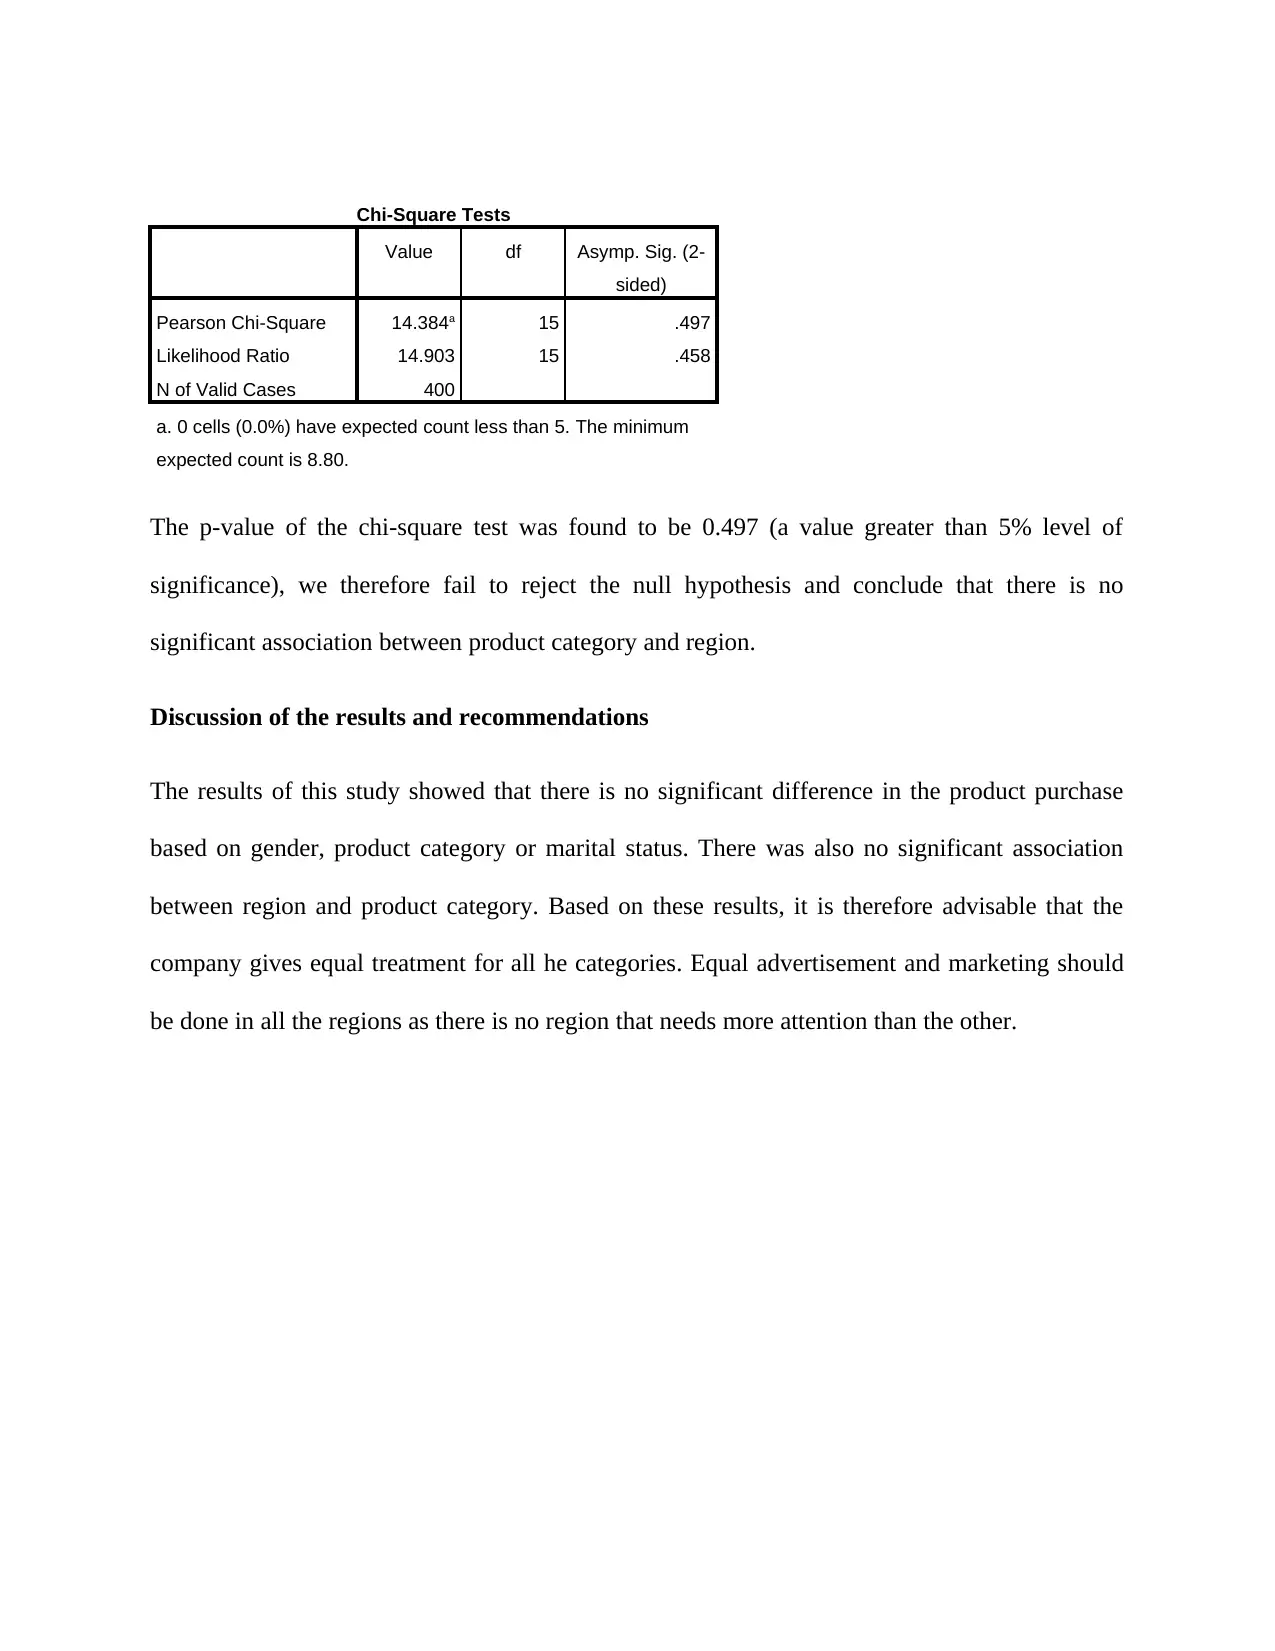
This report presents a statistical analysis of ABZ Company's sales and customer data, aiming to derive business and marketing insights. The study examines the sales performance of various product categories (books, CDs, DVDs, etc.) using a sample of 400 customers. The research addresses key questions regarding sales differences between product categories, gender-based purchase variations, the influence of marital status on purchasing, and the association between product demand and region. The analysis employs descriptive statistics, ANOVA, independent samples t-tests, and chi-square tests to explore these questions. The results indicate no significant differences in sales amounts across product categories, genders, or marital statuses. Additionally, no significant association was found between product category and region. Based on these findings, the report recommends equal marketing and advertising efforts across all product categories and regions, suggesting a uniform approach to customer engagement and distribution strategies.
Document Page
Business Statistics
Student Name:
Instructor Name:
Course Number:
26th April 2019
tabler-icon-diamond-filled.svg

Paraphrase This Document

Need a fresh take? Get an instant paraphrase of this document with our AI Paraphraser
Document Page
Introduction
Every company is existing because they would always want to thrive in terms of their business
performance. To perform, a company needs to understand their customers as well as the manner
in which their products are selling out. The main of this study was to analyze the sales as well as
the business environment of company ABZ. Company ABZ deals with selling of various sets of
books (political books, novels, classical, best seller, CD, DVD among others). The study utilizes
a sample of 400 randomly selected customers to derive business and marketing insights.
Problem definition and business intelligence
This study aimed to answer the following research questions;
1. Are there significant differences in the sale amounts for the different products?
This particular questions aims to find out whether some of the products are doing better
than the others. This information is useful to the company to come up with ways of either
maintaining the good sales of a product or identifying why a given product is not
performing. Analysis of variance will be used to analyse this problem based on the factor
that there are more than two product categories.
2. Are there significant differences in product purchase between the male and the female?
This particular questions aims to find out whether the purchasing power of males and
females is the same or not. Knowing this is important for the company to come up
promotional sales that target various gender groups. An independent samples t-test will
be used to test this. This test is appropriate based on the fact that there are two unrelated
groups which are to be compared.
3. Does marital status influence the purchase amount of the customers?
Document Page
This particular questions aims to find out whether the purchasing power of the single
customers and the married customers is the same or not. Knowing this is important for
the company to come up promotional sales that target various groups of people. For
instance, the company might have promotions for married or single persons. An
independent samples t-test will be used to test this. This test is appropriate based on the
fact that there are two unrelated groups which are to be compared.
4. Is there association between region and product?
This question is important since we seek to know the demand of the various products
varies across the different regions. The researcher aims to find out whether some products
are more selling in some regions. This will help the company know how to do their
distributions and even advertising. A chi-square test of association will be used to test for
the for this research question.
Identifying the data variables as data types and measurement scales
The following is the description of the various variables to be used in this study.
Name of the variable Variable Type Measurement
Gender Independent variable Nominal
Marital Status Independent variable Nominal
Region Independent variable Nominal
Product Independent variable Nominal
Amount Dependent variable Scale
Document Page
Descriptive statistics
Measures of central location
In this section, we present the measures of central location which include mean, median and mode for the
purchase amount. The results are in table below;
Measure of central tendency Value
Mean 39.786
Median 20.500
Mode 15.330
As can be seen, the average purchase amount by is 39.786 with a median of 20.00 and a mode (most
frequent purchase) of 15.330.
Measures of variation
Measure of variation Value
Range 231.590
Standard Deviation 57.569
Sample Variance 3314.215
Methods of data summarizing
In this section we present the results of the results and hypothesis tested.
Hypothesis 1:
Null hypothesis (H0): There is no significant difference in the average sale amounts based on
product categories.
Alternative hypothesis (HA): At least one of the sale amounts of a product category is different.
The results are presented below;
tabler-icon-diamond-filled.svg

Paraphrase This Document

Need a fresh take? Get an instant paraphrase of this document with our AI Paraphraser
Document Page
ANOVA
Amount
Sum of Squares df Mean Square F Sig.
Between Groups 23247.299 5 4649.460 1.410 .220
Within Groups 1299124.486 394 3297.270
Total 1322371.785 399
The p-value for the ANOVA test is 0.220 (a value greater than 5% level of significance), we
therefore fail to reject the null hypothesis and conclude that there is no significant difference in
the average sale amounts based on product categories. That is to say, none of the product
categories is doing better than the other.
Hypothesis 2:
Null hypothesis (H0): There is no significant difference in the average sale amounts based on
gender (male and females).
Alternative hypothesis (HA): There is significant difference in the average sale amounts based on
gender (male and females).
The results are presented below;
Group Statistics
Gender N Mean Std. Deviation Std. Error Mean
Amount Male 28 31.1946 41.37583 7.81930
Female 372 40.4330 58.59833 3.03818
Independent Samples Test
Levene's Test for
Equality of Variances
t-test for Equality of Means
F Sig. t df Sig. (2-
tailed)
Mean
Difference
Std. Error
Difference
95% Confidence
Interval of the
Difference
Document Page
Lower Upper
Amount
Equal variances
assumed
3.111 .079 -.819 398 .414 -9.238 11.2863 -31.426 12.95
Equal variances
not assumed
-1.101 35.71 .278 -9.238 8.3888 -26.256 7.78
An independent samples t-test was done to compare the mean purchase amount for the male and
the female customers. Results showed that the male customers (M = 31.19, SD = 41.38, N = 28)
had no significant difference in terms average purchase amount when compared to the female
customers (M = 40.43, SD = 58.60, N = 372), t (398) = -.819, p > .05, two-tailed.
Hypothesis 3:
Null hypothesis (H0): There is no significant difference in the average sale amounts based on
marital status (married and single).
Alternative hypothesis (HA): There is significant difference in the average sale amounts based on
marital status (married and single).
The results are presented below;
Group Statistics
Marital status N Mean Std. Deviation Std. Error Mean
Amount Married 336 39.5875 58.03514 3.16608
Single 64 40.8300 55.48959 6.93620
Independent Samples Test
Levene's Test for
Equality of
Variances
t-test for Equality of Means
F Sig. t df Sig. (2-
tailed)
Mean
Difference
Std. Error
Difference
95% Confidence Interval
of the Difference
Document Page
Lower Upper
Amount
Equal variances
assumed
.015 .904 -.158 398 .874 -1.243 7.861 -16.70 14.21
Equal variances
not assumed
-.163 91.2 .871 -1.243 7.624 -16.39 13.90
An independent samples t-test was done to compare the mean purchase amount for the married
and the single customers. Results showed that the married customers (M = 39.59, SD = 58.03, N
= 336) had no significant difference in terms average purchase amount when compared to the
single customers (M = 40.83, SD = 55.49, N = 64), t (398) = -.158, p > .05, two-tailed.
Hypothesis 4:
Null hypothesis (H0): There is no significant association between product category and region
Alternative hypothesis (HA): There is significant association between product category and
region.
The results are presented below;
Product category * Region Crosstabulation
Count
Region Total
East North South West
Product category
Best seller 11 9 12 23 55
CD 14 14 11 17 56
Classical 12 6 14 23 55
DVD 23 18 26 56 123
Novel 15 5 14 22 56
Politics 13 12 6 24 55
Total 88 64 83 165 400
tabler-icon-diamond-filled.svg

Paraphrase This Document

Need a fresh take? Get an instant paraphrase of this document with our AI Paraphraser
Document Page
Chi-Square Tests
Value df Asymp. Sig. (2-
sided)
Pearson Chi-Square 14.384a 15 .497
Likelihood Ratio 14.903 15 .458
N of Valid Cases 400
a. 0 cells (0.0%) have expected count less than 5. The minimum
expected count is 8.80.
The p-value of the chi-square test was found to be 0.497 (a value greater than 5% level of
significance), we therefore fail to reject the null hypothesis and conclude that there is no
significant association between product category and region.
Discussion of the results and recommendations
The results of this study showed that there is no significant difference in the product purchase
based on gender, product category or marital status. There was also no significant association
between region and product category. Based on these results, it is therefore advisable that the
company gives equal treatment for all he categories. Equal advertisement and marketing should
be done in all the regions as there is no region that needs more attention than the other.
chevron_up_icon
1 out of 8
circle_padding
hide_on_mobile
zoom_out_icon
[object Object]