Comprehensive Data Analysis: HI6007 Business Statistics Assignment

Verified

Added on  2023/06/03

|8
|1310
|425
Homework Assignment
AI Summary
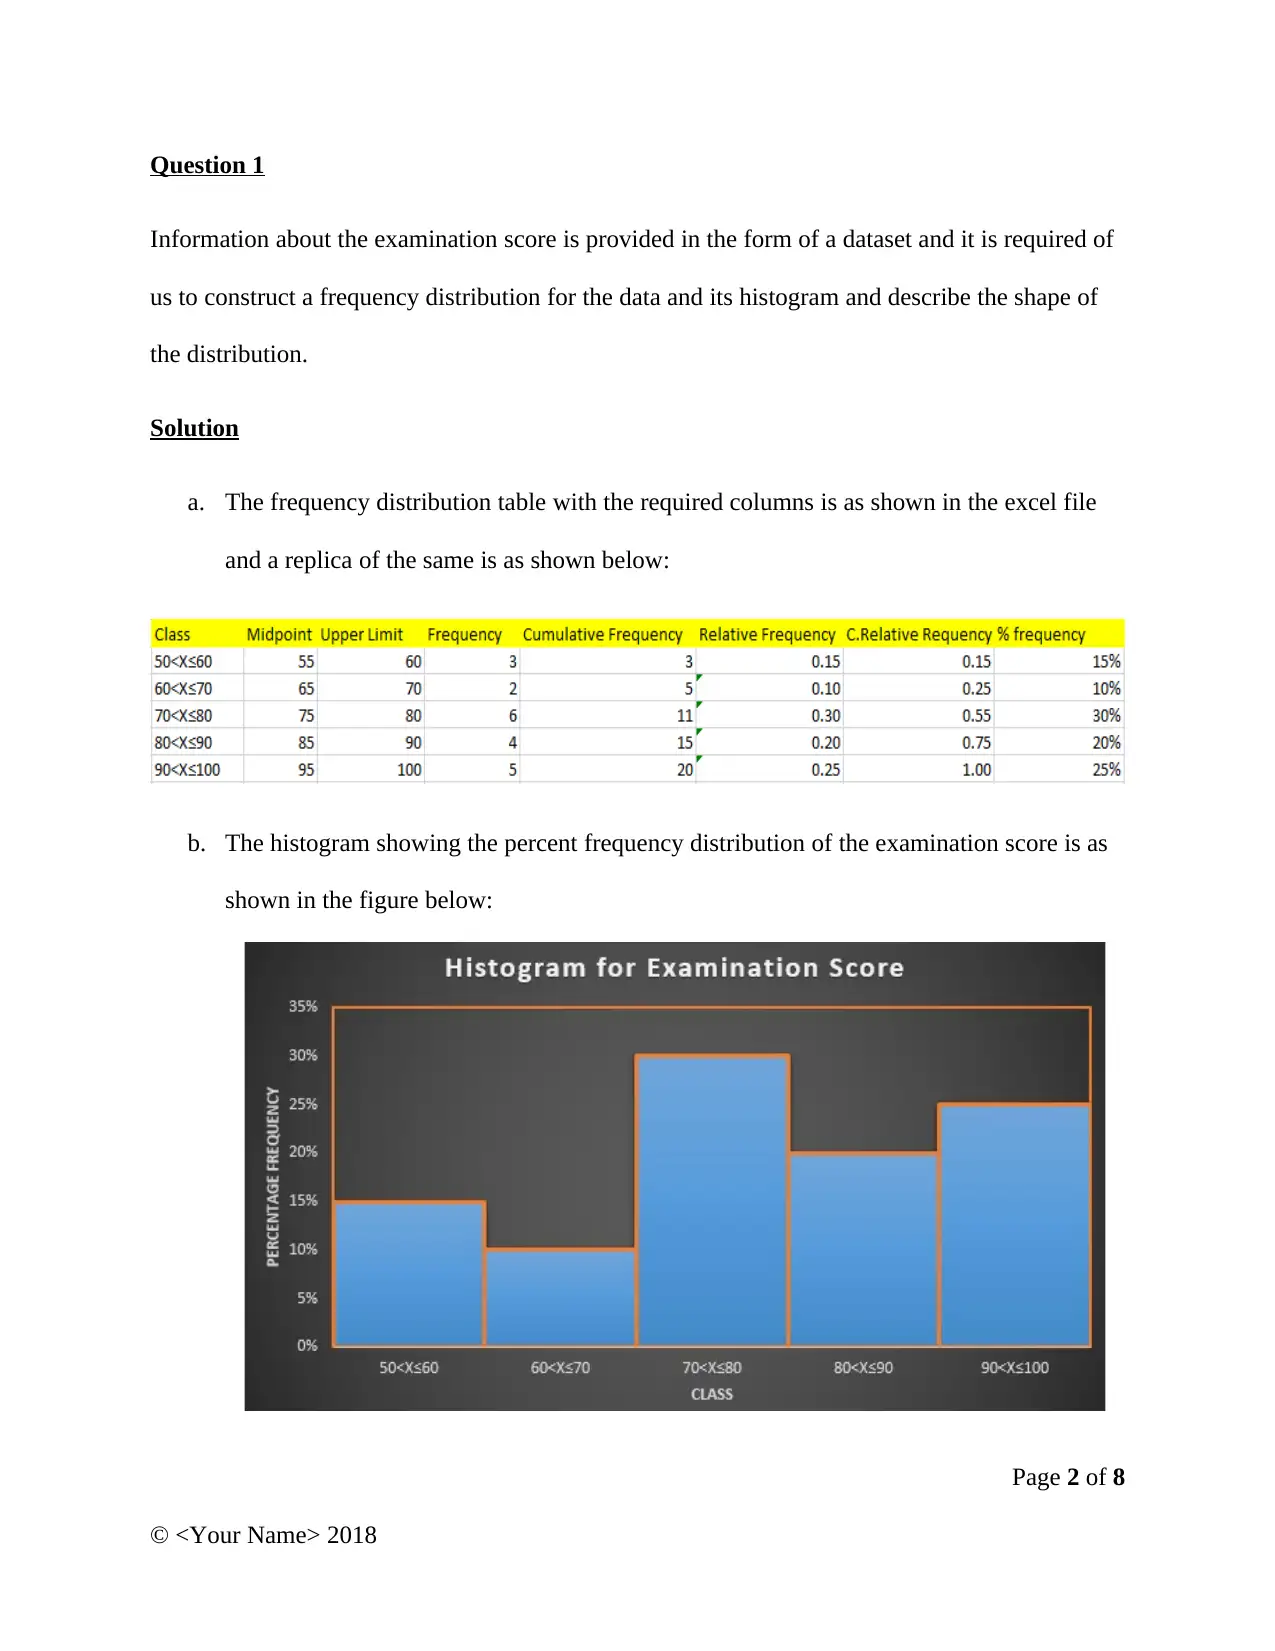
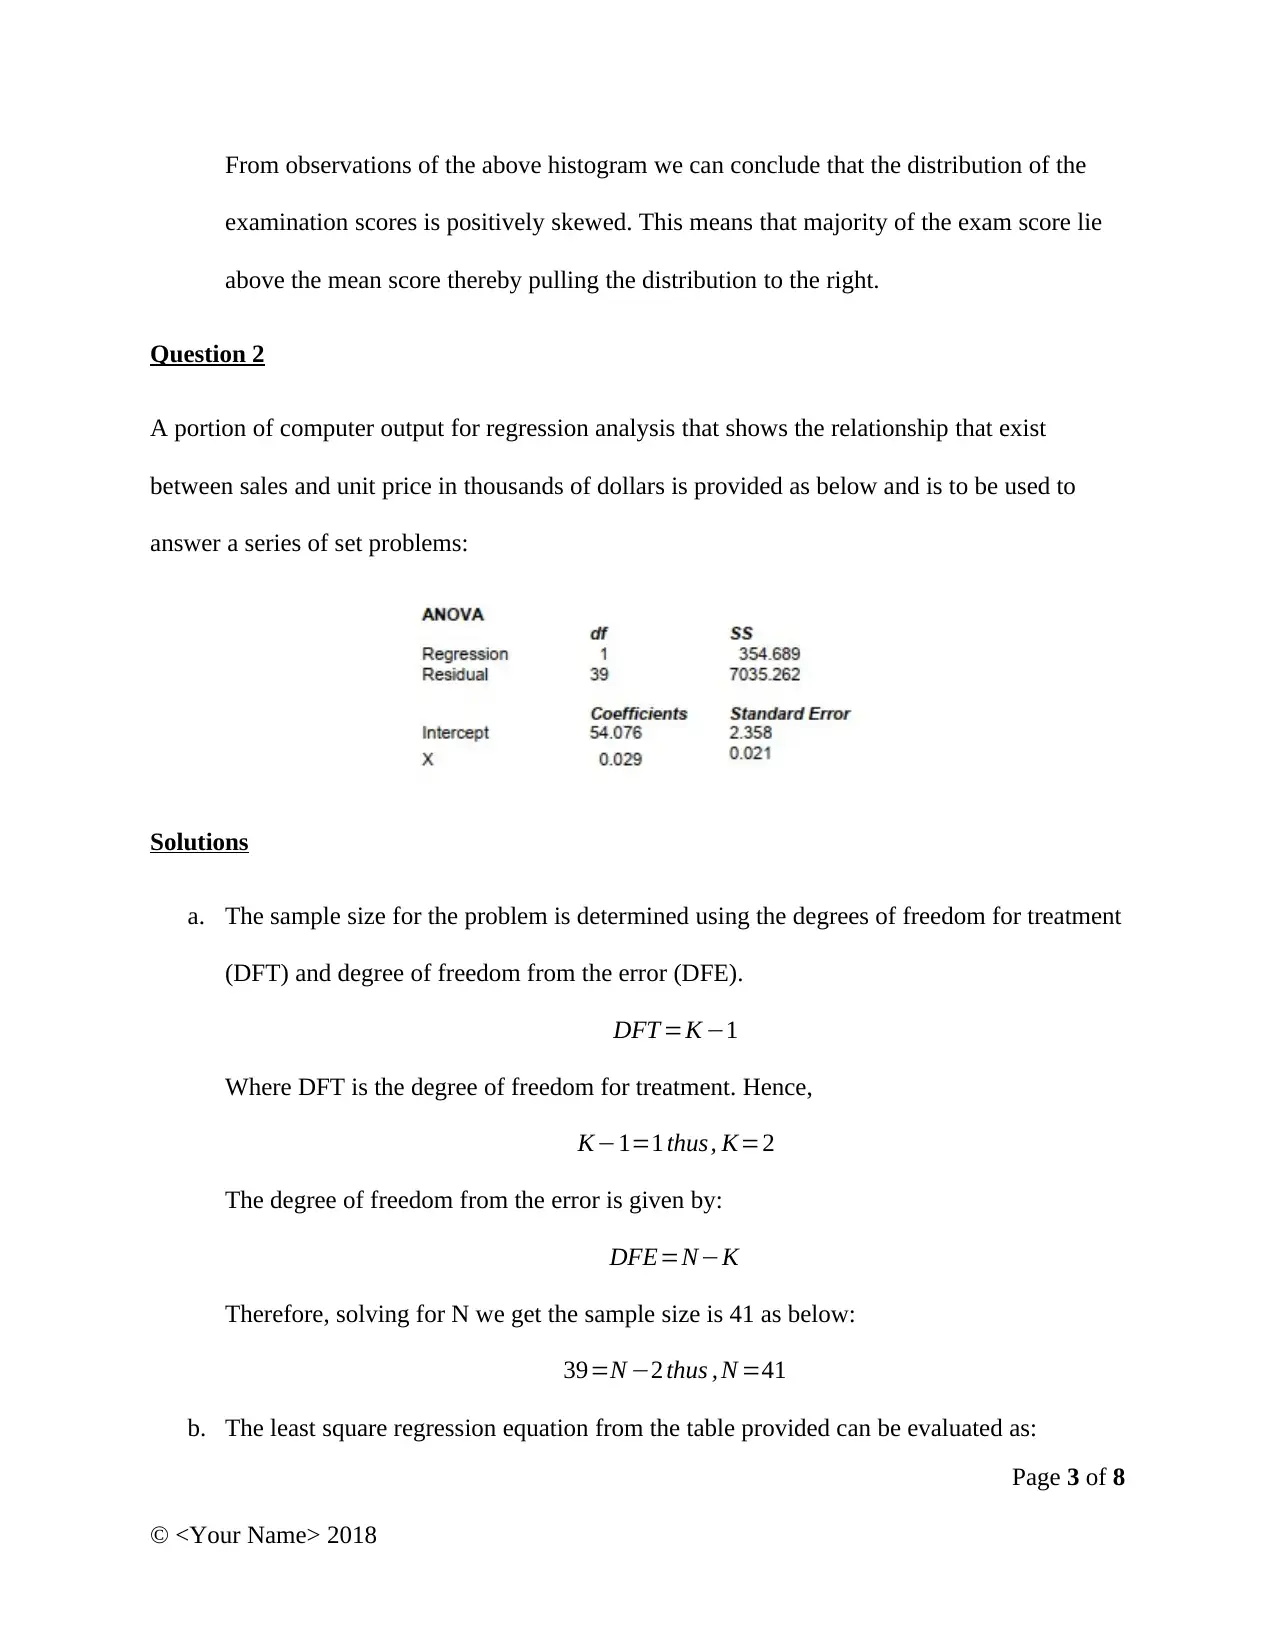
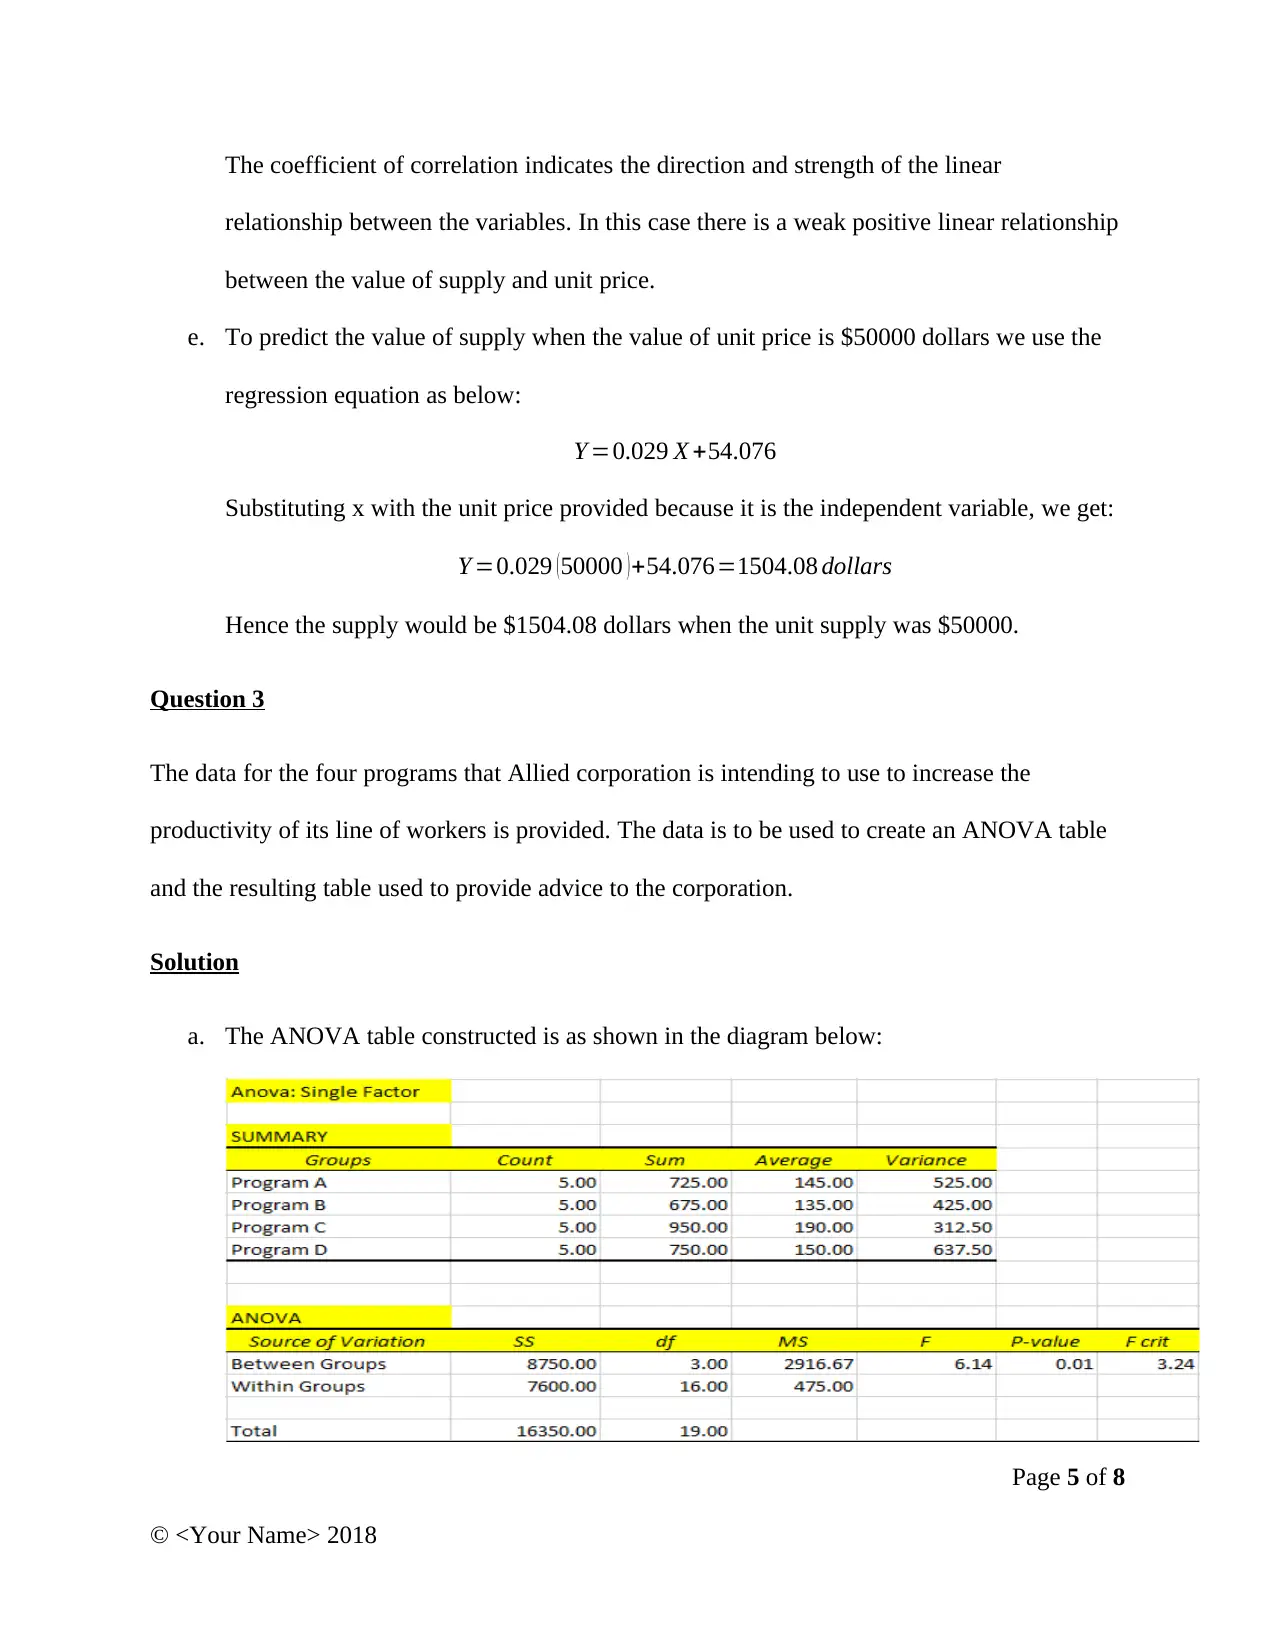
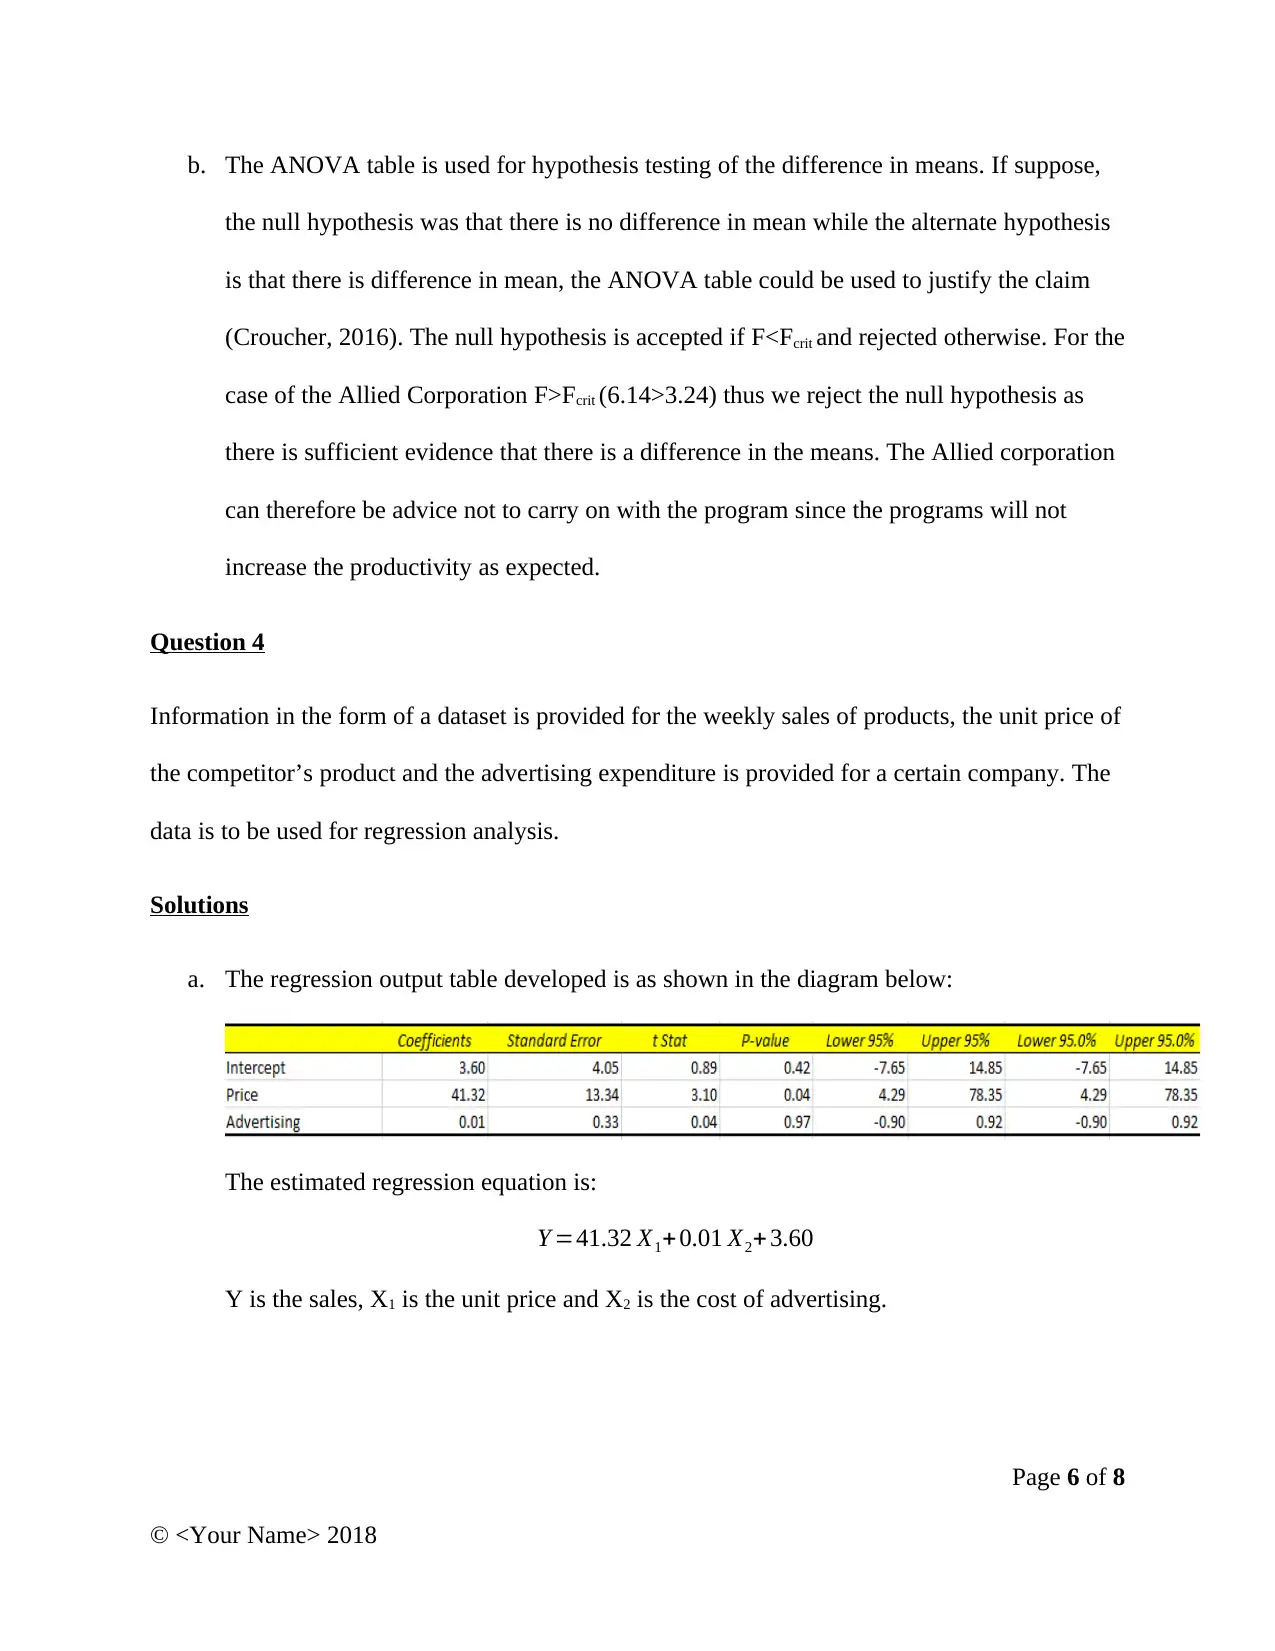
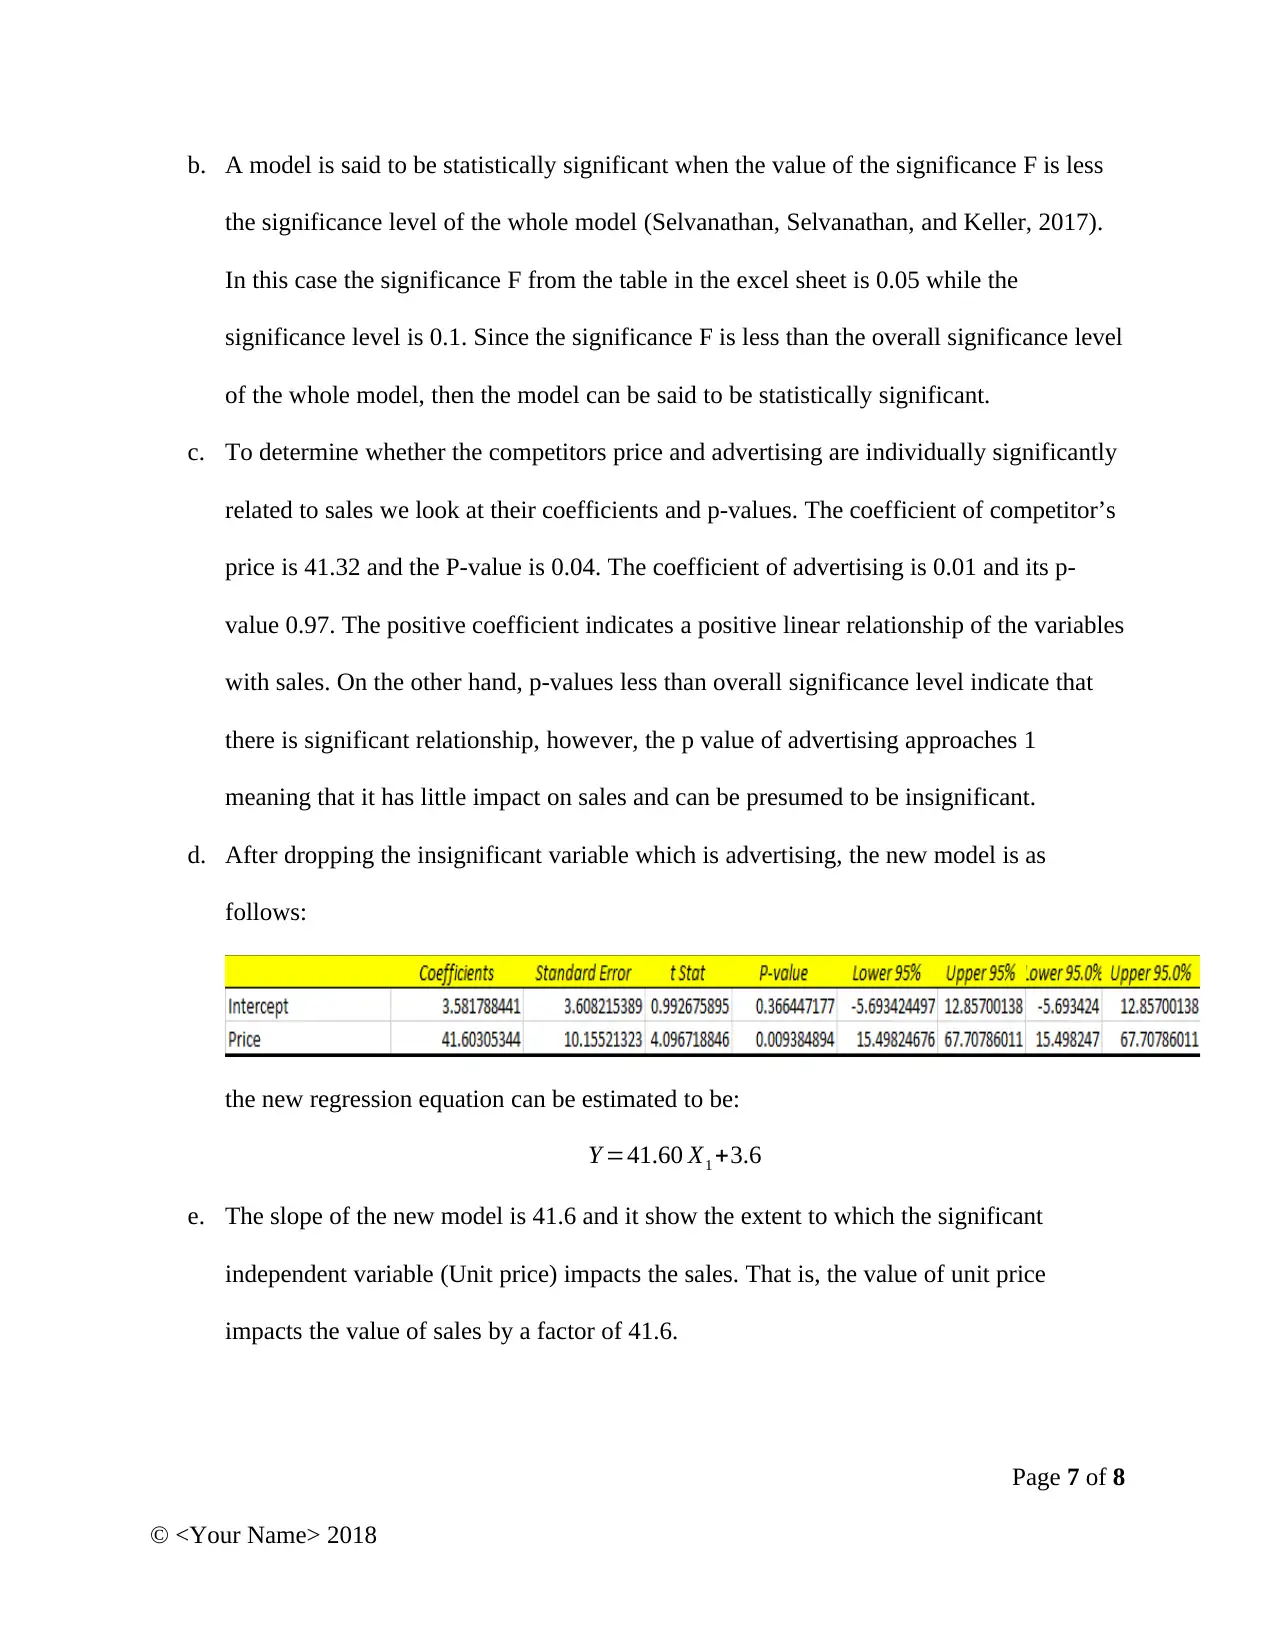
This assignment solution provides a comprehensive analysis of business statistics, addressing key concepts such as frequency distribution, regression analysis, and ANOVA. The first question involves constructing frequency distributions and histograms to analyze examination scores, revealing a positively skewed distribution. The second question delves into regression analysis, interpreting computer output to determine sample size, regression equations, coefficients of determination and correlation, and predicting supply based on unit price. The third question focuses on creating and interpreting an ANOVA table to advise Allied Corporation on productivity programs, concluding that the programs may not significantly increase productivity. Finally, the fourth question involves regression analysis of weekly sales data, identifying significant variables like competitor's price and developing a refined regression equation. This detailed solution offers valuable insights and practical applications of statistical methods in a business context. Desklib offers a wide array of similar solved assignments and past papers.
tabler-icon-diamond-filled.svg

Contribute Materials

Your contribution can guide someone’s learning journey. Share your documents today.
Document Page
University
Statistics of Business Studies
By
Your Name
Lecturer’s Name
Date
Page 1 of 8
© <Your Name> 2018
tabler-icon-diamond-filled.svg

Secure Best Marks with AI Grader

Need help grading? Try our AI Grader for instant feedback on your assignments.
Document Page
Question 1
Information about the examination score is provided in the form of a dataset and it is required of
us to construct a frequency distribution for the data and its histogram and describe the shape of
the distribution.
Solution
a. The frequency distribution table with the required columns is as shown in the excel file
and a replica of the same is as shown below:
b. The histogram showing the percent frequency distribution of the examination score is as
shown in the figure below:
Page 2 of 8
© <Your Name> 2018
Document Page
From observations of the above histogram we can conclude that the distribution of the
examination scores is positively skewed. This means that majority of the exam score lie
above the mean score thereby pulling the distribution to the right.
Question 2
A portion of computer output for regression analysis that shows the relationship that exist
between sales and unit price in thousands of dollars is provided as below and is to be used to
answer a series of set problems:
Solutions
a. The sample size for the problem is determined using the degrees of freedom for treatment
(DFT) and degree of freedom from the error (DFE).
DFT =K 1
Where DFT is the degree of freedom for treatment. Hence,
K1=1 thus, K=2
The degree of freedom from the error is given by:
DFE=NK
Therefore, solving for N we get the sample size is 41 as below:
39=N 2 thus , N =41
b. The least square regression equation from the table provided can be evaluated as:
Page 3 of 8
© <Your Name> 2018
Document Page
Y =0.029 X +54.076
Where Y is the dependent variable (supply) and the x represents the explanatory variable
(Unit price). The regression equation indicates there is a positive linear relationship
between sales and unit price. That is the sales increase with increase in unit price and
drop when the unit price drops.
c. The coefficient of determination is the r-squared value and is calculated using the
equation below:
R2= SSM
SST
The value of SST is the sum of squares for total while the value SSM represents the sum
of squares for the evaluated model. From the table provided SSM is 354.689 while the
SST value is (354.689+ 7035.262 =7389.951). The value of coefficient for determination
will therefore be given by:
R2= 354.689
7389.951 =0.047996
The coefficient of determination indicates the possibility of future sales and unit prices
being related in the same manner as in the regression equation above. The probability of
future supply and unit prices in this case of being related in the same manner is 0.047996.
d. The coefficient of correlation is the square root of the coefficient of determination as
shown below:
R= R2
In this case it will be:
0.047996=0.219
Page 4 of 8
© <Your Name> 2018
tabler-icon-diamond-filled.svg

Secure Best Marks with AI Grader

Need help grading? Try our AI Grader for instant feedback on your assignments.
Document Page
The coefficient of correlation indicates the direction and strength of the linear
relationship between the variables. In this case there is a weak positive linear relationship
between the value of supply and unit price.
e. To predict the value of supply when the value of unit price is $50000 dollars we use the
regression equation as below:
Y =0.029 X +54.076
Substituting x with the unit price provided because it is the independent variable, we get:
Y =0.029 (50000 )+54.076=1504.08 dollars
Hence the supply would be $1504.08 dollars when the unit supply was $50000.
Question 3
The data for the four programs that Allied corporation is intending to use to increase the
productivity of its line of workers is provided. The data is to be used to create an ANOVA table
and the resulting table used to provide advice to the corporation.
Solution
a. The ANOVA table constructed is as shown in the diagram below:
Page 5 of 8
© <Your Name> 2018
Document Page
b. The ANOVA table is used for hypothesis testing of the difference in means. If suppose,
the null hypothesis was that there is no difference in mean while the alternate hypothesis
is that there is difference in mean, the ANOVA table could be used to justify the claim
(Croucher, 2016). The null hypothesis is accepted if F<Fcrit and rejected otherwise. For the
case of the Allied Corporation F>Fcrit (6.14>3.24) thus we reject the null hypothesis as
there is sufficient evidence that there is a difference in the means. The Allied corporation
can therefore be advice not to carry on with the program since the programs will not
increase the productivity as expected.
Question 4
Information in the form of a dataset is provided for the weekly sales of products, the unit price of
the competitor’s product and the advertising expenditure is provided for a certain company. The
data is to be used for regression analysis.
Solutions
a. The regression output table developed is as shown in the diagram below:
The estimated regression equation is:
Y =41.32 X1+ 0.01 X2+ 3.60
Y is the sales, X1 is the unit price and X2 is the cost of advertising.
Page 6 of 8
© <Your Name> 2018
Document Page
b. A model is said to be statistically significant when the value of the significance F is less
the significance level of the whole model (Selvanathan, Selvanathan, and Keller, 2017).
In this case the significance F from the table in the excel sheet is 0.05 while the
significance level is 0.1. Since the significance F is less than the overall significance level
of the whole model, then the model can be said to be statistically significant.
c. To determine whether the competitors price and advertising are individually significantly
related to sales we look at their coefficients and p-values. The coefficient of competitor’s
price is 41.32 and the P-value is 0.04. The coefficient of advertising is 0.01 and its p-
value 0.97. The positive coefficient indicates a positive linear relationship of the variables
with sales. On the other hand, p-values less than overall significance level indicate that
there is significant relationship, however, the p value of advertising approaches 1
meaning that it has little impact on sales and can be presumed to be insignificant.
d. After dropping the insignificant variable which is advertising, the new model is as
follows:
the new regression equation can be estimated to be:
Y =41.60 X1 +3.6
e. The slope of the new model is 41.6 and it show the extent to which the significant
independent variable (Unit price) impacts the sales. That is, the value of unit price
impacts the value of sales by a factor of 41.6.
Page 7 of 8
© <Your Name> 2018
tabler-icon-diamond-filled.svg

Paraphrase This Document

Need a fresh take? Get an instant paraphrase of this document with our AI Paraphraser
Document Page
References
Croucher, J. S. (2016). Introductory mathematics & statistics. 6th ed. Australia: North Ryde,
N.S.W. McGraw-Hill Education.
Selvanathan, E. A., Selvanathan, S., and Keller, G. (2017). Business statistics abridged. 7th ed.
South Melbourne, Victoria: Cengage Learning.
Page 8 of 8
© <Your Name> 2018
chevron_up_icon
1 out of 8
circle_padding
hide_on_mobile
zoom_out_icon
logo.png

Your All-in-One AI-Powered Toolkit for Academic Success.

Available 24*7 on WhatsApp / Email

[object Object]