Statistics for Business: Data Analysis and Interpretation Assignment
VerifiedAdded on 2023/01/11
|10
|1993
|100
Homework Assignment
AI Summary
This assignment solution provides a comprehensive overview of key statistical concepts relevant to business applications. It begins with an introduction to statistics and its importance in business decision-making, covering topics such as population parameters, sample statistics, descriptive and inferential statistics, and different scales of measurement like nominal and ordinal scales. The solution then delves into data analysis, including the construction and interpretation of histograms, and explores concepts like skewness. Probability and conditional probability are also examined, along with the independence of events. Furthermore, the assignment addresses the application of the normal distribution, calculating probabilities and identifying key percentiles. Finally, the solution applies the central limit theorem to analyze sample means and calculate probabilities related to sample distributions. The assignment provides a practical application of statistical methods for business analysis.
STATISTICS FOR
BUSINESS
BUSINESS
Paraphrase This Document
Need a fresh take? Get an instant paraphrase of this document with our AI Paraphraser
TABLE OF CONTENTS
TABLE OF CONTENTS................................................................................................................2
INTRODUTION..............................................................................................................................1
QUESTION 1..................................................................................................................................1
a. Population Parameter and the sample statistic.........................................................................1
b. Descriptive Statistics and Inferential Statistic.........................................................................1
c. Nominal Scale and Ordinal Scale............................................................................................1
d. Primary Data Source and the Secondary Data Source.............................................................2
QUESTION 2..................................................................................................................................2
a)..................................................................................................................................................2
b)..................................................................................................................................................3
c.).................................................................................................................................................3
QUESTION 3..................................................................................................................................3
a)..................................................................................................................................................3
b)..................................................................................................................................................4
c)..................................................................................................................................................4
d)..................................................................................................................................................4
QUESTION 4..................................................................................................................................4
a)..................................................................................................................................................4
b)..................................................................................................................................................5
c)..................................................................................................................................................5
d)..................................................................................................................................................5
QUESTION 5..................................................................................................................................5
a)..................................................................................................................................................5
b...................................................................................................................................................6
CONCLUSION................................................................................................................................6
REFERENCES................................................................................................................................7
INTRODUTION
Statistics is an important tool used by the business for efficient business decision making
process. It helps the business to deal with the uncertainties by making forecasts about the cyclic,
seasonal and general economic fluctuations. It helps the business in making sound decisions by
making accurate estimates on the costs, prices, demand, sales etc. It helps the business in
planning on basis of effective predictions and assumptions. Present report will provide about the
application of concepts of statistics. This will enhance the understanding of statistical concepts.
QUESTION 1
a. Population Parameter and the sample statistic
Parameter is defined as the number describing population and where the statistics is
defined as number which describes sample. Parameter refers to the value which describes the
characteristics of the entire population like population mean. As it is not possible to measure the
entire population therefore the real value could not be identified as a parameter. These
parameters are generally unknowable. For example average height of the adult women in US is
parameter having exact value but it is not known.
Static is the characteristics of the sample. When the samples are collected it standard deviation
and mean are also calculated, this is known as sample statistics (Holland And et.al., 2017).
Inferential statistics allows using the sample statistics for making the conclusions about
population.
b. Descriptive Statistics and Inferential Statistic
Descriptive statistic gives information describing the data in some of the manner.
Graphical representation of the data an another method used in descriptive analysis. for instance,
pet shop sells dogs, cats, fish and birds. If in total 100 pets are sold out of which 40 were dogs.
Then the description of pet’s sold data could be 40% are dogs. It provides easier and faster
method of making comparisons between the various data sets.
Inferential Statistics makes the inferences for the population using data drawn from
population. Rather than selecting entire population for gathering data, sample or the samples
from millions of the residents are collected and inferences about entire population could be made
using sample
1
⊘ This is a preview!⊘
Do you want full access?
Subscribe today to unlock all pages.
Trusted by 1+ million students worldwide
c. Nominal Scale and Ordinal Scale
Nominal and Ordinal scale are the two parameters of variable measurement scale. The
measurement scales have significance in the questionnaires and surveys, polls and subsequent
statistics analysis. Difference between the two has considerable impact over market research
methods because of information and details they are required to offer.
Nominal scale is used for indicating the categories. The categories have the
corresponding number allotted for the analysis of the collected data. For instance ethnicity,
gender and hair colour of any person may be considered as nominal scale data.
Ordinary Scale data over other hand involve arrangement of information the specific
order which means in comparison of one another & ranking each parameter. Example after
receiving the services from a shop customers are asked for filling kiosk survey over the scale 1 to
5 about the experience (Dasí, Montesinos and Murgui, 2016). The data will be evaluated on the
basis of mainly two scales of variables that are ratio and interval.
d. Primary Data Source and the Secondary Data Source.
Primary data is obtained freshly for first time using personal evidence or experiences for
the research. It is also known as first hand information and raw data. Primary sources of data are
less accurate and are required to go number of tests and examination.
Secondary data is second hand data which is already recorded and collected by the research
for their personal studies and not for use of current research. Secondary sources of data are
censuses, government publications, articles, books, journals and many more.
Primary sources of data are less accurate and where the secondary data are more reliable and
accurate. Data in primary sources is much are more specific for the researcher and have direct
supervision where secondary data have less supervision over the data. Primary data collection is
much expensive as compared with the secondary data source as it is collected all new.
QUESTION 2
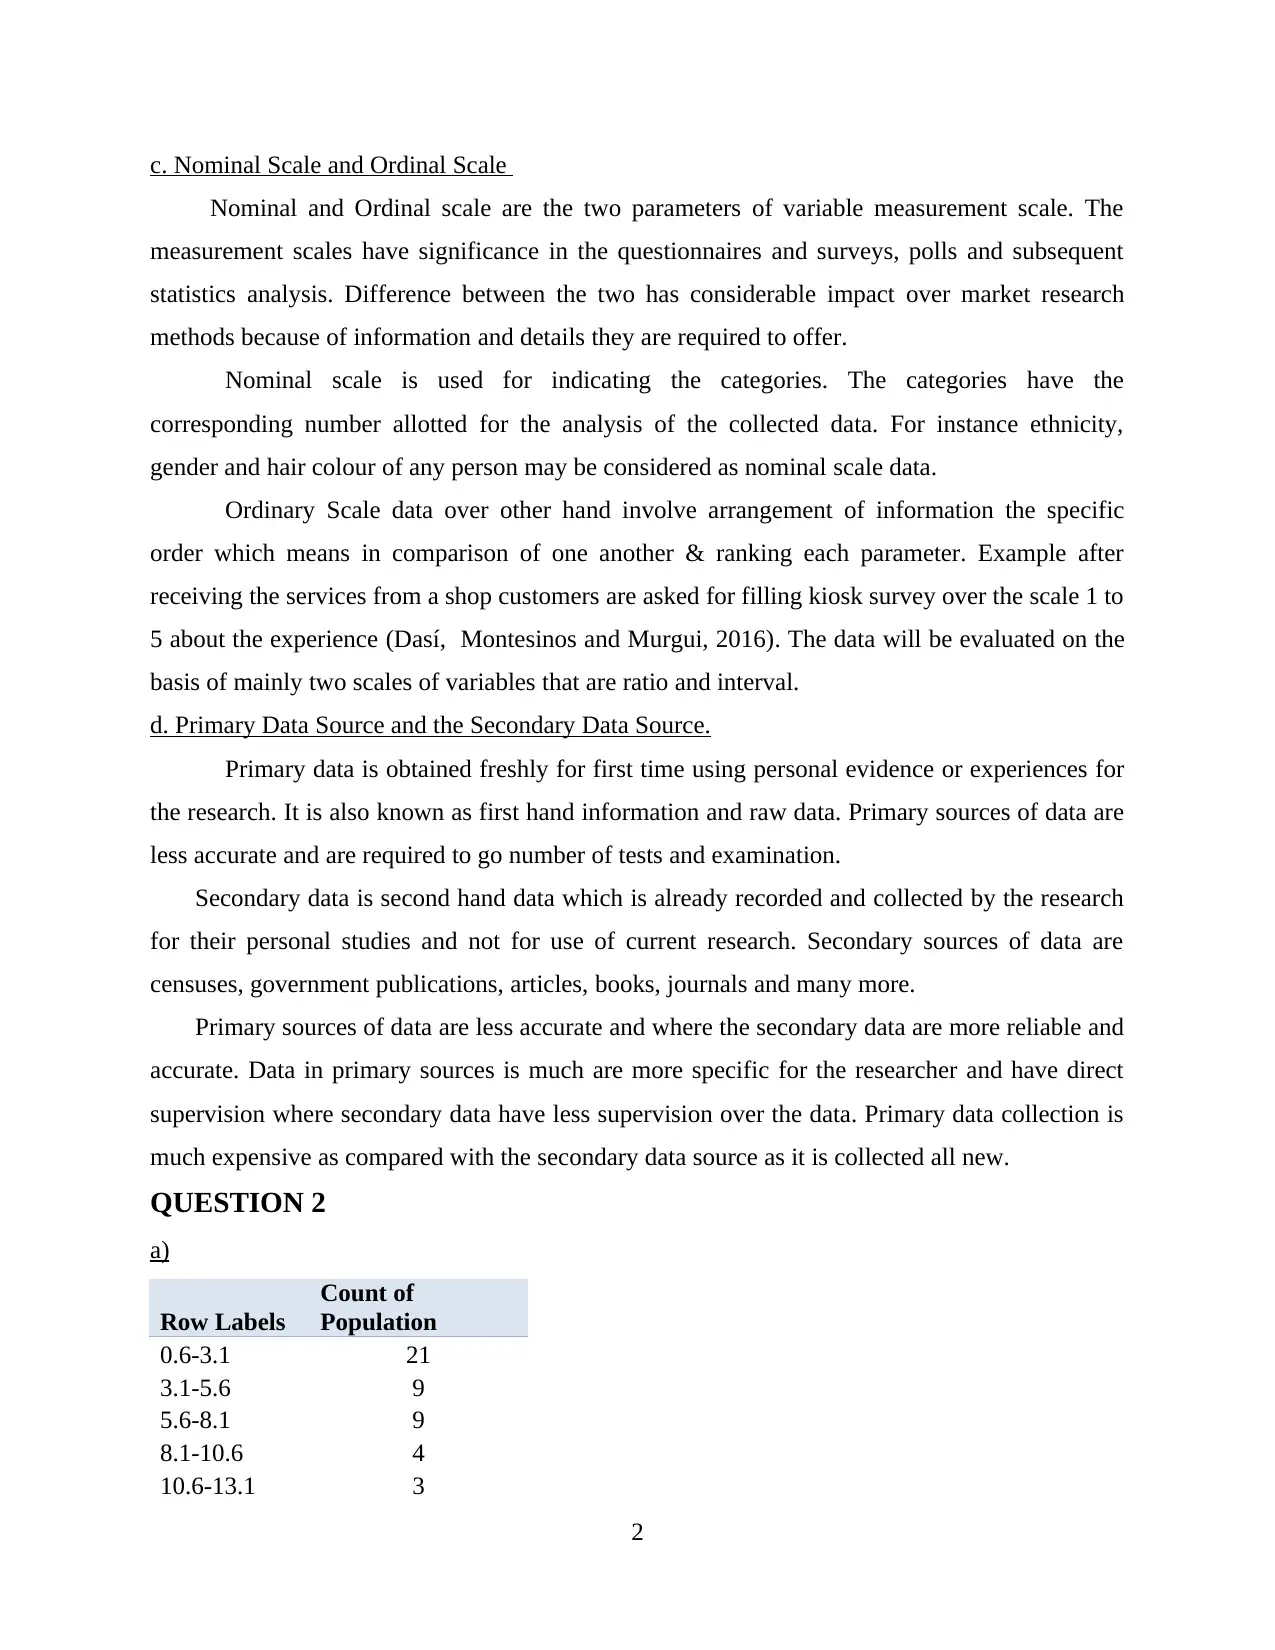
a)
Row Labels
Count of
Population
0.6-3.1 21
3.1-5.6 9
5.6-8.1 9
8.1-10.6 4
10.6-13.1 3
2
Nominal and Ordinal scale are the two parameters of variable measurement scale. The
measurement scales have significance in the questionnaires and surveys, polls and subsequent
statistics analysis. Difference between the two has considerable impact over market research
methods because of information and details they are required to offer.
Nominal scale is used for indicating the categories. The categories have the
corresponding number allotted for the analysis of the collected data. For instance ethnicity,
gender and hair colour of any person may be considered as nominal scale data.
Ordinary Scale data over other hand involve arrangement of information the specific
order which means in comparison of one another & ranking each parameter. Example after
receiving the services from a shop customers are asked for filling kiosk survey over the scale 1 to
5 about the experience (Dasí, Montesinos and Murgui, 2016). The data will be evaluated on the
basis of mainly two scales of variables that are ratio and interval.
d. Primary Data Source and the Secondary Data Source.
Primary data is obtained freshly for first time using personal evidence or experiences for
the research. It is also known as first hand information and raw data. Primary sources of data are
less accurate and are required to go number of tests and examination.
Secondary data is second hand data which is already recorded and collected by the research
for their personal studies and not for use of current research. Secondary sources of data are
censuses, government publications, articles, books, journals and many more.
Primary sources of data are less accurate and where the secondary data are more reliable and
accurate. Data in primary sources is much are more specific for the researcher and have direct
supervision where secondary data have less supervision over the data. Primary data collection is
much expensive as compared with the secondary data source as it is collected all new.
QUESTION 2
a)
Row Labels
Count of
Population
0.6-3.1 21
3.1-5.6 9
5.6-8.1 9
8.1-10.6 4
10.6-13.1 3
2
Paraphrase This Document
Need a fresh take? Get an instant paraphrase of this document with our AI Paraphraser
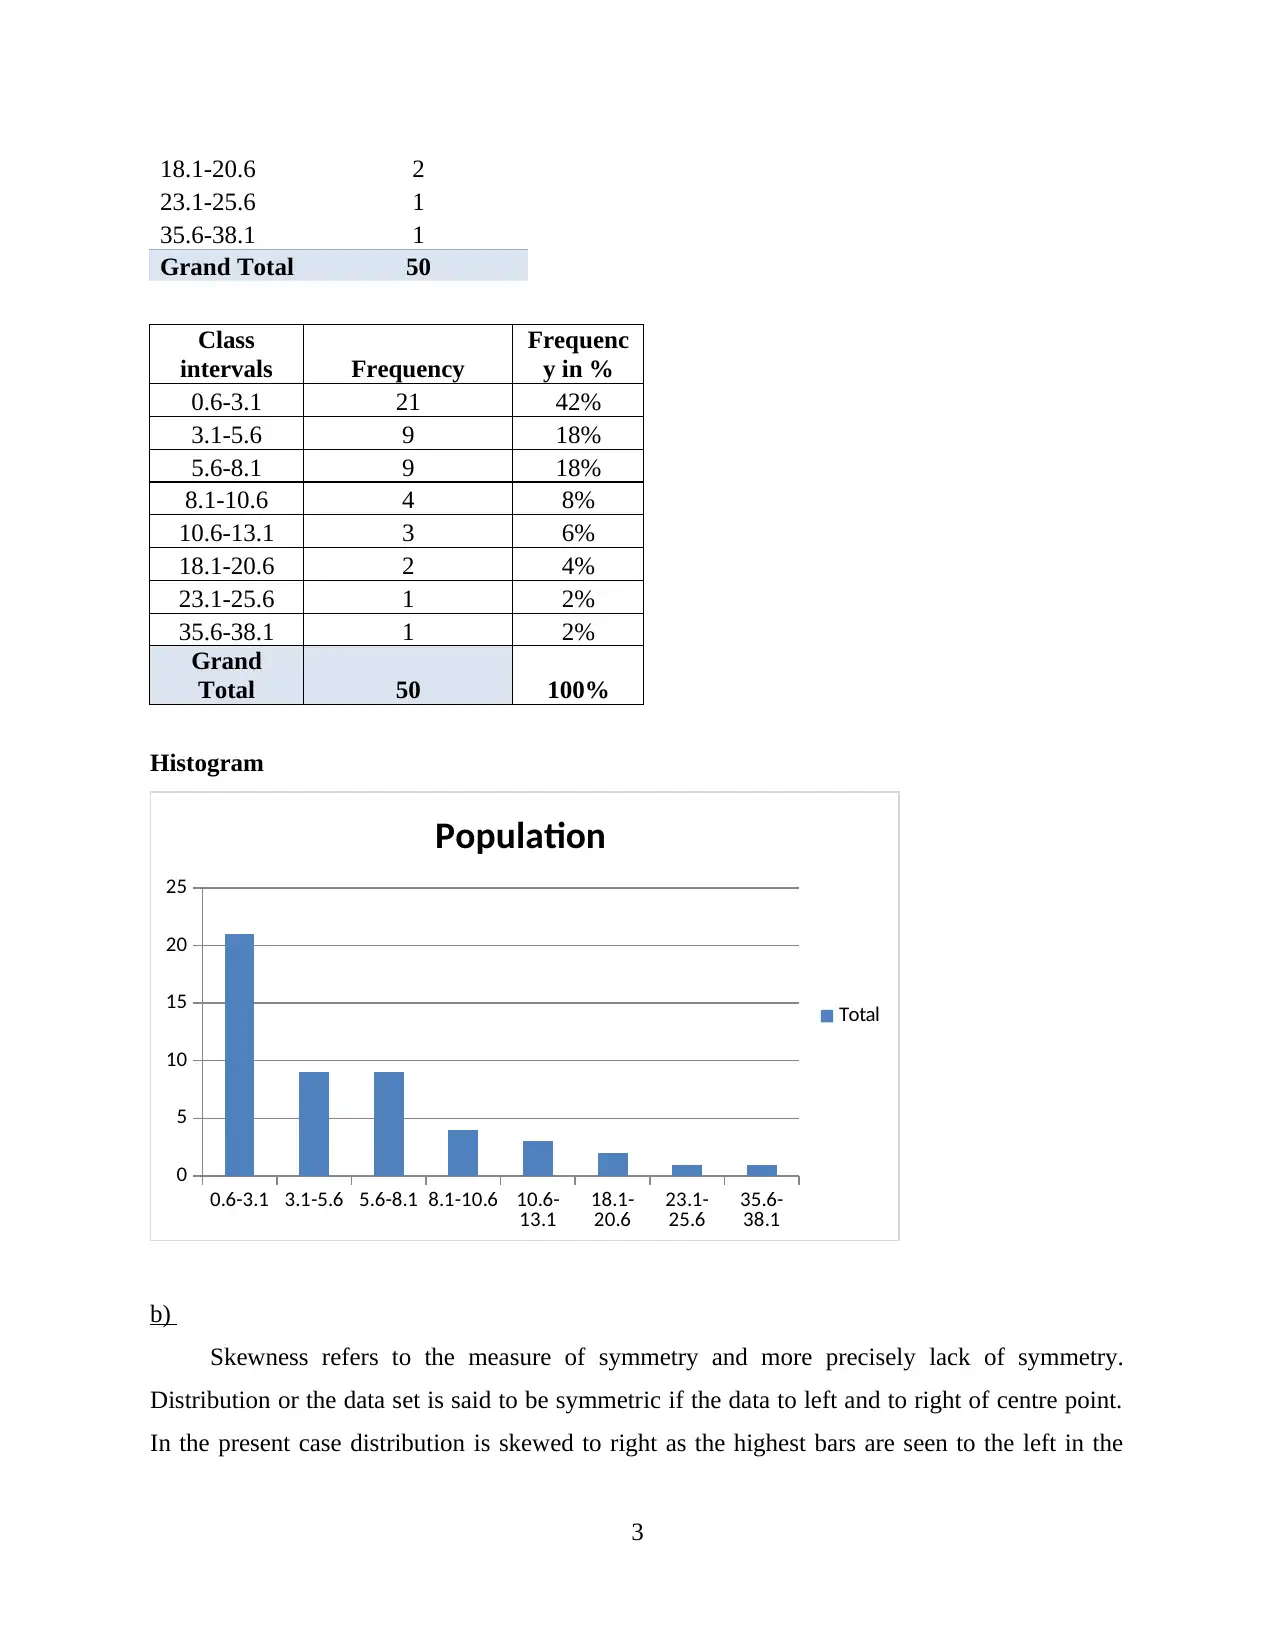
18.1-20.6 2
23.1-25.6 1
35.6-38.1 1
Grand Total 50
Class
intervals Frequency
Frequenc
y in %
0.6-3.1 21 42%
3.1-5.6 9 18%
5.6-8.1 9 18%
8.1-10.6 4 8%
10.6-13.1 3 6%
18.1-20.6 2 4%
23.1-25.6 1 2%
35.6-38.1 1 2%
Grand
Total 50 100%
Histogram
0.6-3.1 3.1-5.6 5.6-8.1 8.1-10.6 10.6-
13.1 18.1-
20.6 23.1-
25.6 35.6-
38.1
0
5
10
15
20
25
Population
Total
b)
Skewness refers to the measure of symmetry and more precisely lack of symmetry.
Distribution or the data set is said to be symmetric if the data to left and to right of centre point.
In the present case distribution is skewed to right as the highest bars are seen to the left in the
3
graph ((Cheng And et.al., 2020). There is skewness as the different in population between the
different cities is very high.
c.)
From the above table it could be observed that among the 50 cities 21 cities have
population between the range of 0.6 – 3.1 million. This reflects 41% of the cities have population
ranging between this. There are 9 cities in both where the population is between the 3.14 – 5.6
millions and also the same number of cities has population between 5.6 -8.1 million. It could also
be observed that there is only one city having the population between 23.1 – 25.6 & 35.6 – 38.1
millions.
QUESTION 3
a)
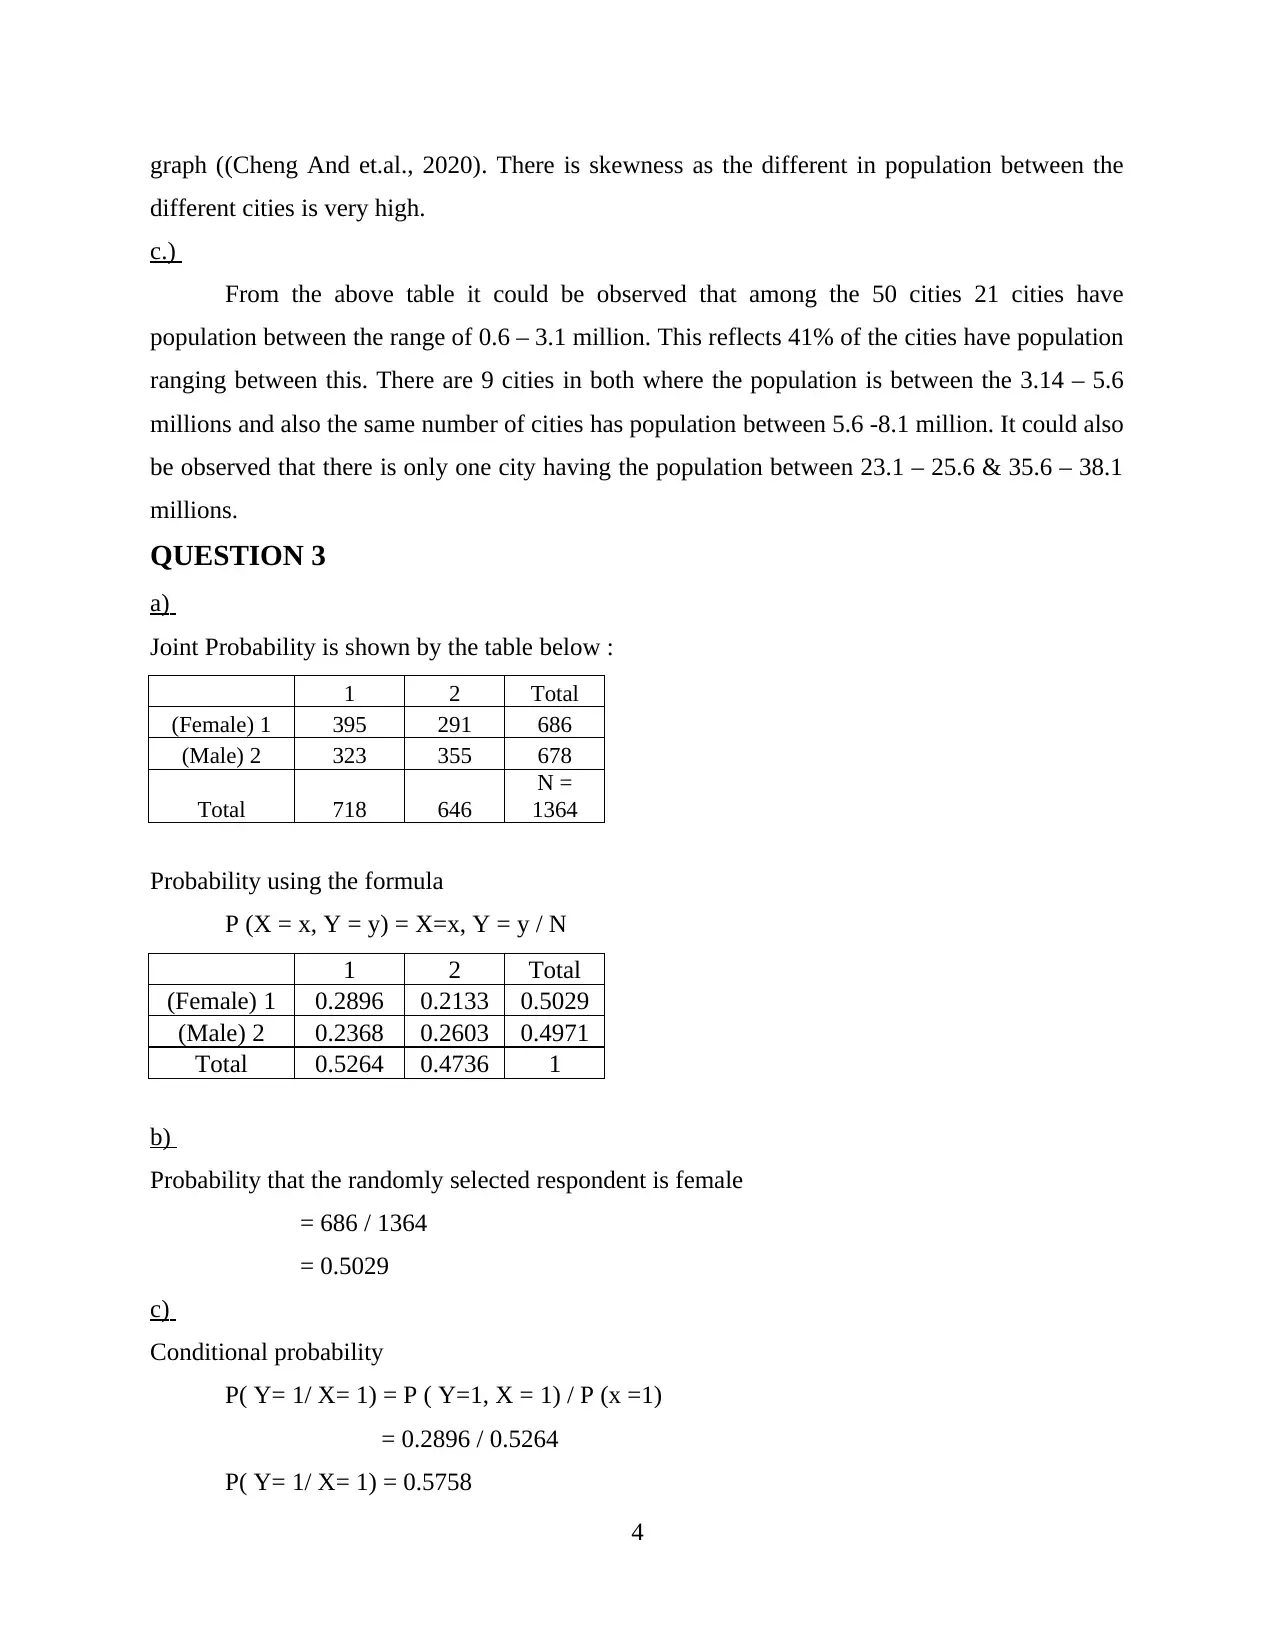
Joint Probability is shown by the table below :
1 2 Total
(Female) 1 395 291 686
(Male) 2 323 355 678
Total 718 646
N =
1364
Probability using the formula
P (X = x, Y = y) = X=x, Y = y / N
1 2 Total
(Female) 1 0.2896 0.2133 0.5029
(Male) 2 0.2368 0.2603 0.4971
Total 0.5264 0.4736 1
b)
Probability that the randomly selected respondent is female
= 686 / 1364
= 0.5029
c)
Conditional probability
P( Y= 1/ X= 1) = P ( Y=1, X = 1) / P (x =1)
= 0.2896 / 0.5264
P( Y= 1/ X= 1) = 0.5758
4
different cities is very high.
c.)
From the above table it could be observed that among the 50 cities 21 cities have
population between the range of 0.6 – 3.1 million. This reflects 41% of the cities have population
ranging between this. There are 9 cities in both where the population is between the 3.14 – 5.6
millions and also the same number of cities has population between 5.6 -8.1 million. It could also
be observed that there is only one city having the population between 23.1 – 25.6 & 35.6 – 38.1
millions.
QUESTION 3
a)
Joint Probability is shown by the table below :
1 2 Total
(Female) 1 395 291 686
(Male) 2 323 355 678
Total 718 646
N =
1364
Probability using the formula
P (X = x, Y = y) = X=x, Y = y / N
1 2 Total
(Female) 1 0.2896 0.2133 0.5029
(Male) 2 0.2368 0.2603 0.4971
Total 0.5264 0.4736 1
b)
Probability that the randomly selected respondent is female
= 686 / 1364
= 0.5029
c)
Conditional probability
P( Y= 1/ X= 1) = P ( Y=1, X = 1) / P (x =1)
= 0.2896 / 0.5264
P( Y= 1/ X= 1) = 0.5758
4
⊘ This is a preview!⊘
Do you want full access?
Subscribe today to unlock all pages.
Trusted by 1+ million students worldwide
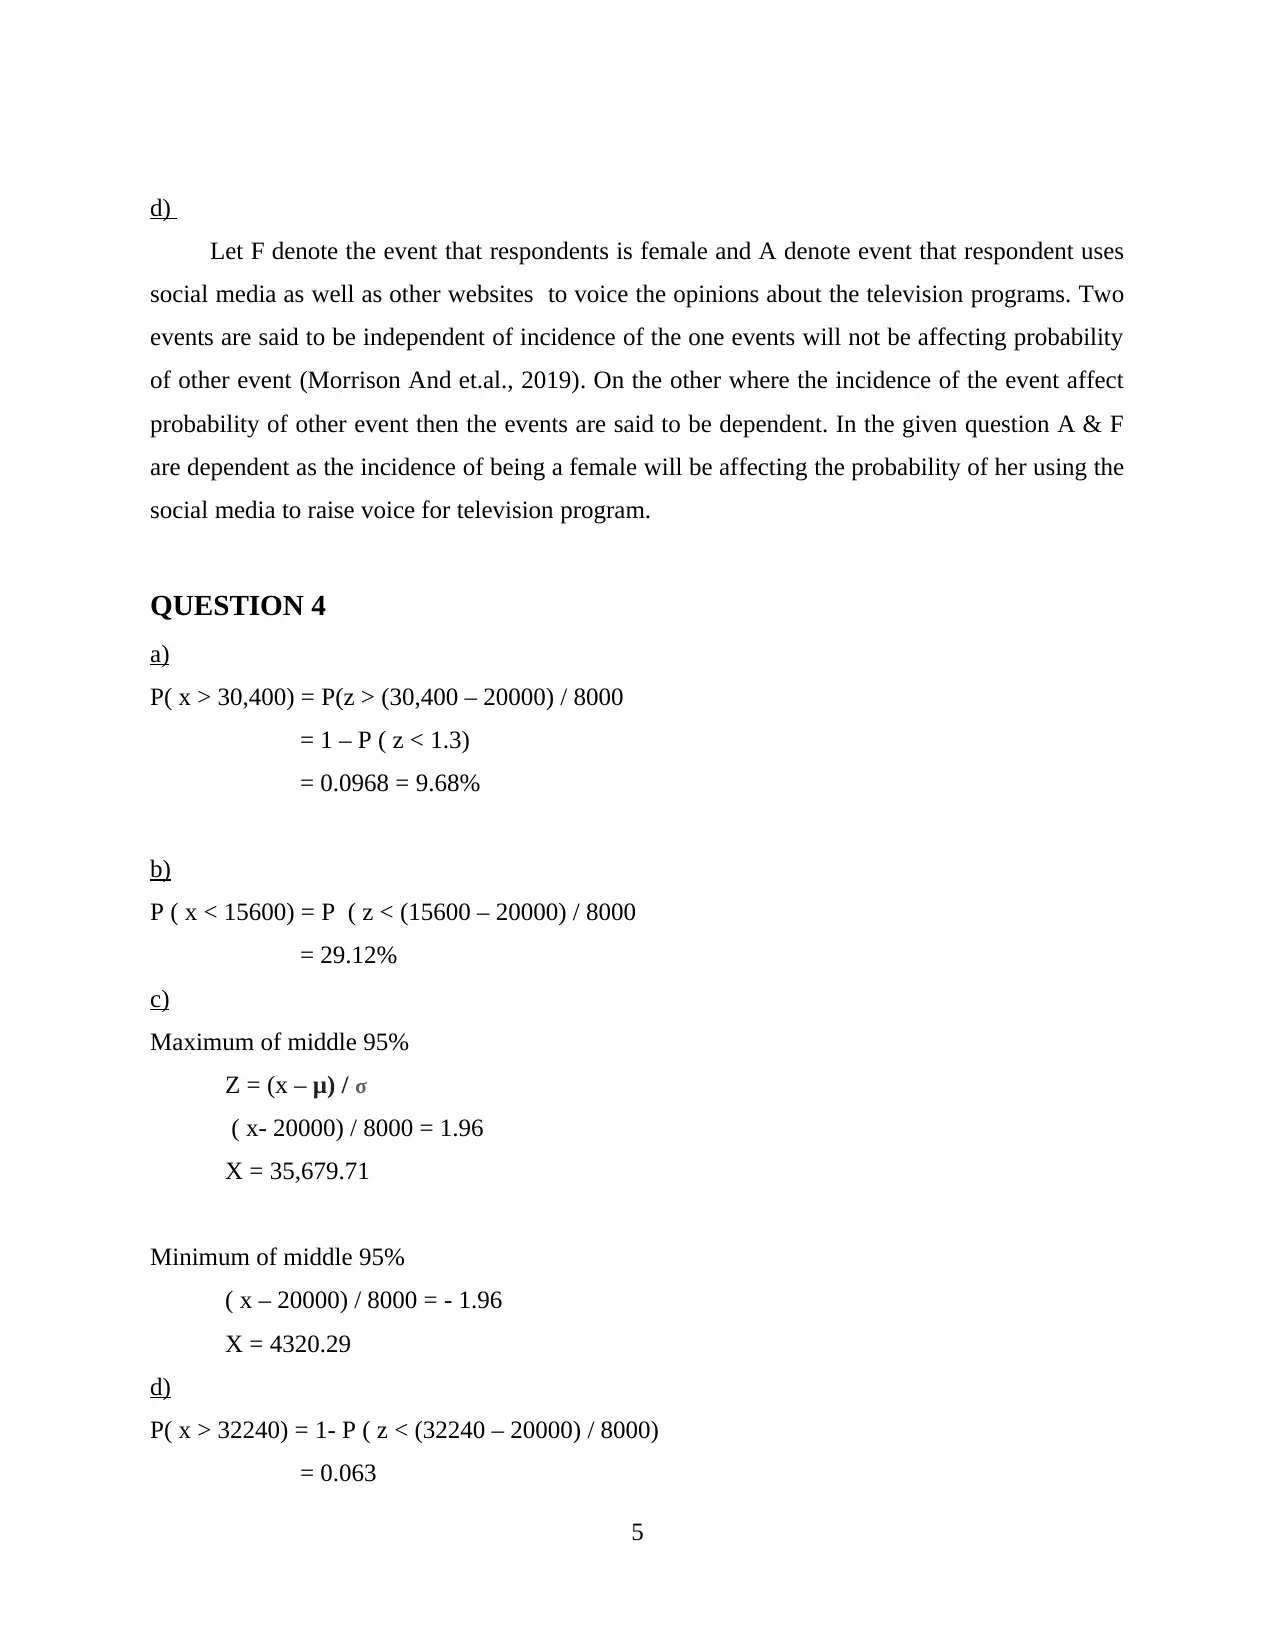
d)
Let F denote the event that respondents is female and A denote event that respondent uses
social media as well as other websites to voice the opinions about the television programs. Two
events are said to be independent of incidence of the one events will not be affecting probability
of other event (Morrison And et.al., 2019). On the other where the incidence of the event affect
probability of other event then the events are said to be dependent. In the given question A & F
are dependent as the incidence of being a female will be affecting the probability of her using the
social media to raise voice for television program.
QUESTION 4
a)
P( x > 30,400) = P(z > (30,400 – 20000) / 8000
= 1 – P ( z < 1.3)
= 0.0968 = 9.68%
b)
P ( x < 15600) = P ( z < (15600 – 20000) / 8000
= 29.12%
c)
Maximum of middle 95%
Z = (x – μ) / σ
( x- 20000) / 8000 = 1.96
X = 35,679.71
Minimum of middle 95%
( x – 20000) / 8000 = - 1.96
X = 4320.29
d)
P( x > 32240) = 1- P ( z < (32240 – 20000) / 8000)
= 0.063
5
Paraphrase This Document
Need a fresh take? Get an instant paraphrase of this document with our AI Paraphraser
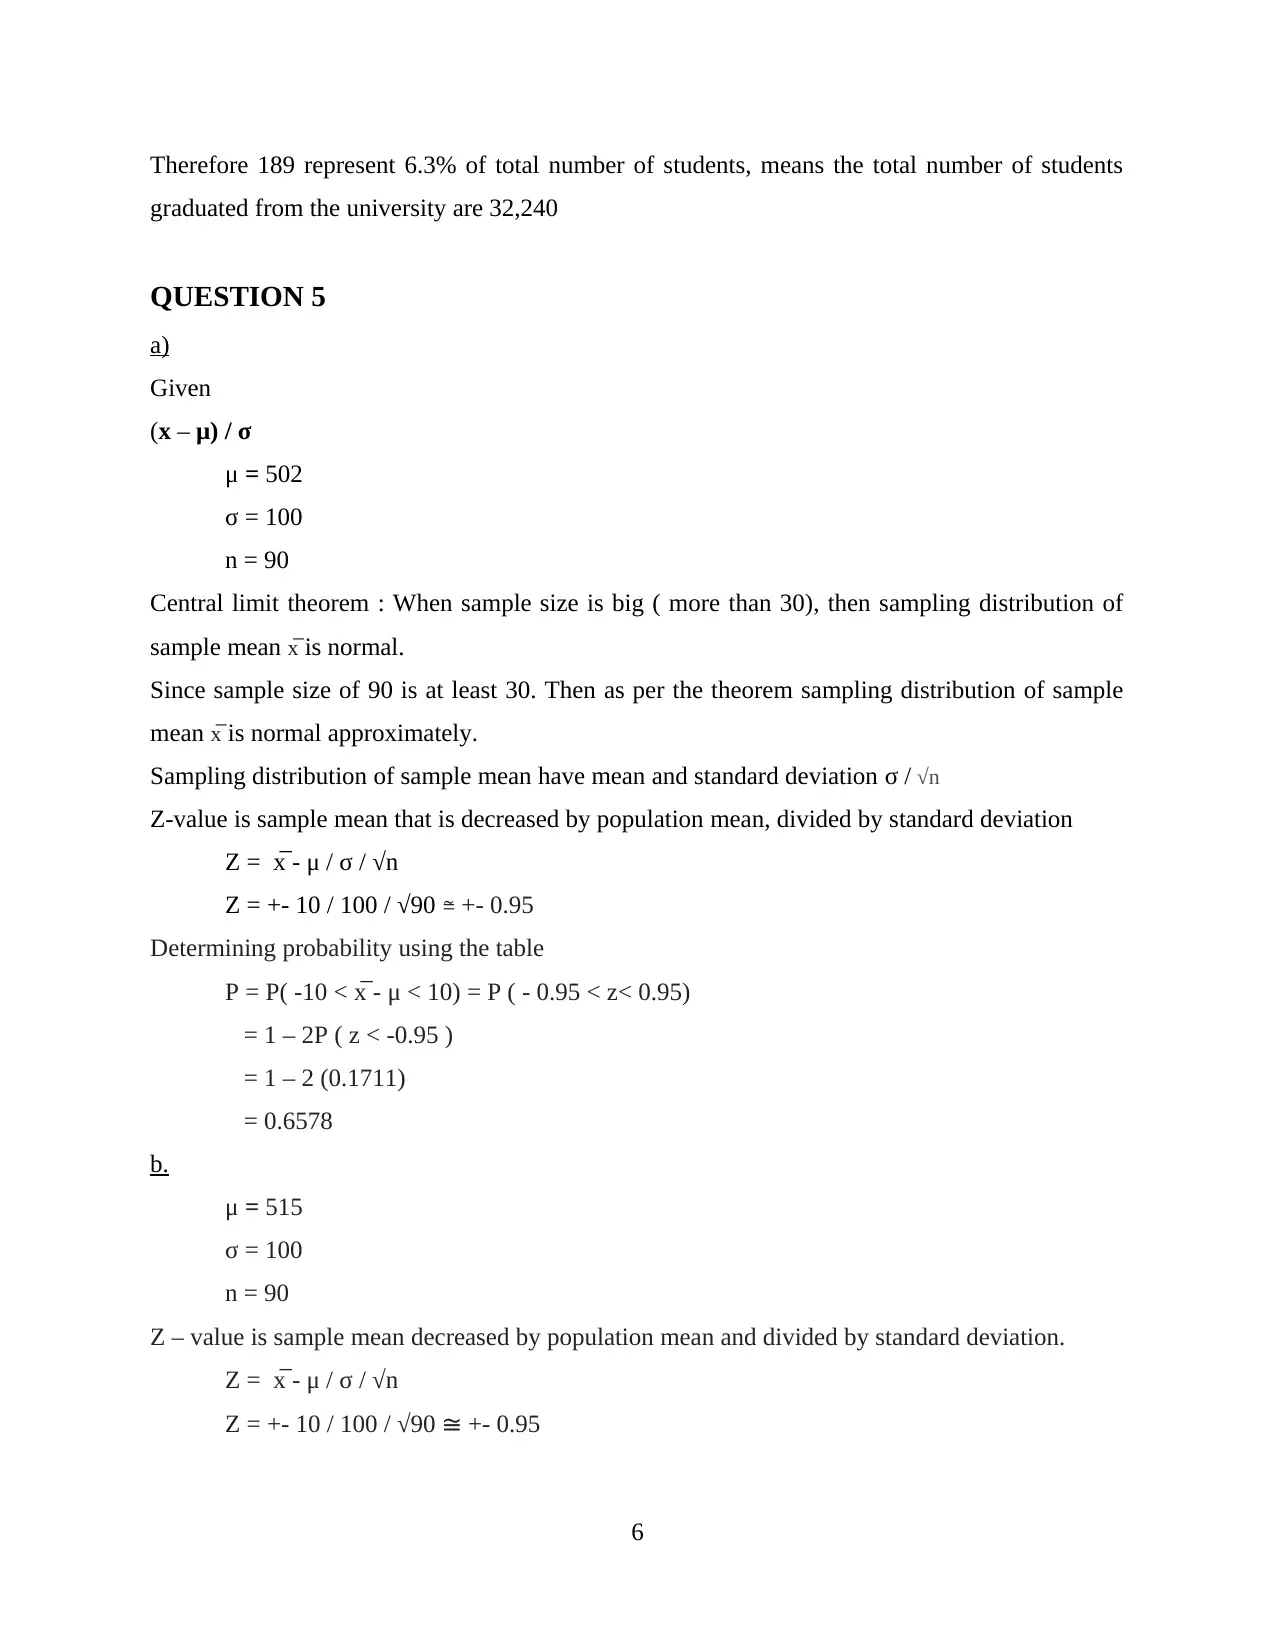
Therefore 189 represent 6.3% of total number of students, means the total number of students
graduated from the university are 32,240
QUESTION 5
a)
Given
(x – μ) / σ
μ = 502
σ = 100
n = 90
Central limit theorem : When sample size is big ( more than 30), then sampling distribution of
sample mean x̅ is normal.
Since sample size of 90 is at least 30. Then as per the theorem sampling distribution of sample
mean x̅ is normal approximately.
Sampling distribution of sample mean have mean and standard deviation σ / √n
Z-value is sample mean that is decreased by population mean, divided by standard deviation
Z = x̅ - μ / σ / √n
Z = +- 10 / 100 / √90 +- 0.95≅
Determining probability using the table
P = P( -10 < x̅ - μ < 10) = P ( - 0.95 < z< 0.95)
= 1 – 2P ( z < -0.95 )
= 1 – 2 (0.1711)
= 0.6578
b.
μ = 515
σ = 100
n = 90
Z – value is sample mean decreased by population mean and divided by standard deviation.
Z = x̅ - μ / σ / √n
Z = +- 10 / 100 / √90 ≅ +- 0.95
6
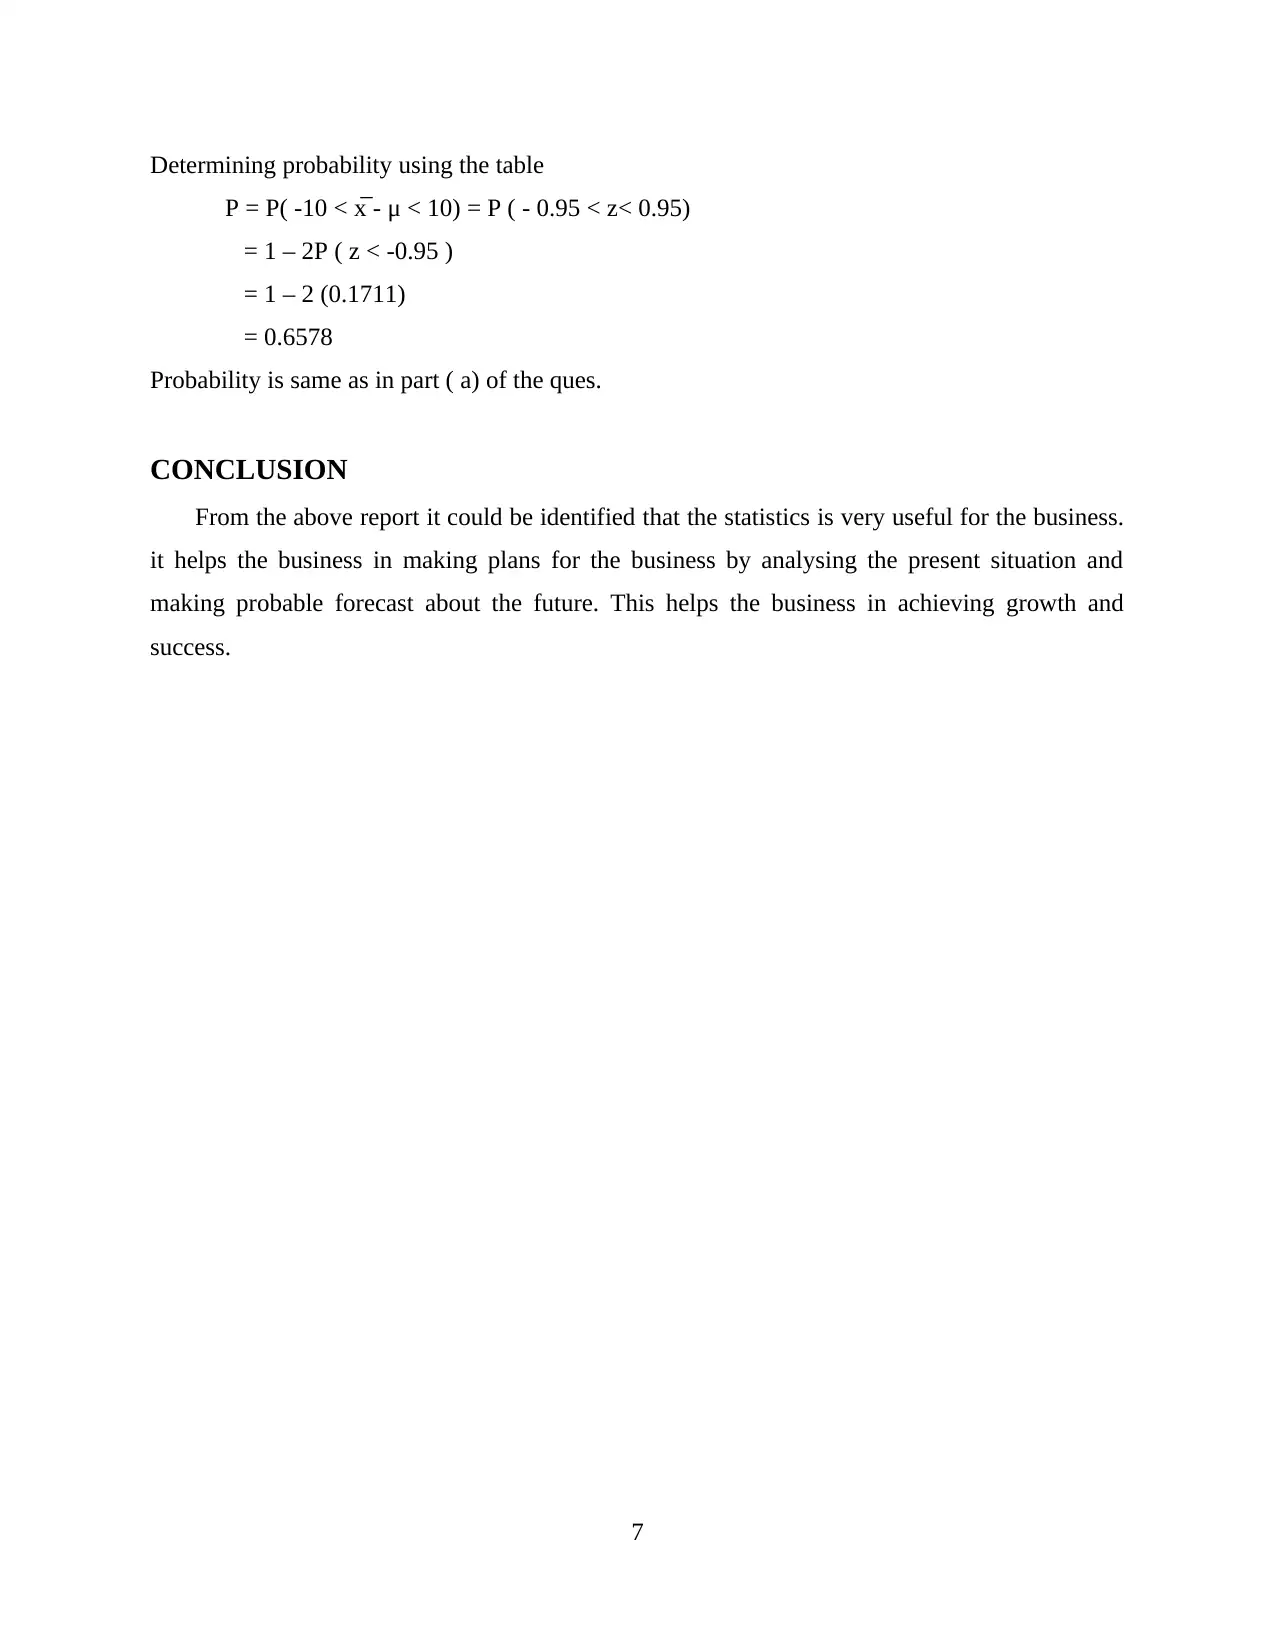
Determining probability using the table
P = P( -10 < x̅ - μ < 10) = P ( - 0.95 < z< 0.95)
= 1 – 2P ( z < -0.95 )
= 1 – 2 (0.1711)
= 0.6578
Probability is same as in part ( a) of the ques.
CONCLUSION
From the above report it could be identified that the statistics is very useful for the business.
it helps the business in making plans for the business by analysing the present situation and
making probable forecast about the future. This helps the business in achieving growth and
success.
7
⊘ This is a preview!⊘
Do you want full access?
Subscribe today to unlock all pages.
Trusted by 1+ million students worldwide
REFERENCES
Books and Journals
Holland, D. And et.al., 2017. Estimating phenotypic polygenicity and causal effect size variance
from GWAS summary statistics while accounting for inflation due to cryptic
relatedness. BioRxiv. p.133132.
Dasí, R.M., Montesinos, V. and Murgui, S., 2016. Government financial statistics and
accounting in Europe: is ESA 2010 improving convergence?. Public Money &
Management.36(3).pp.165-172.
Morrison, J. And et.al., 2019. Mendelian randomization accounting for correlated and
uncorrelated pleiotropic effects using genome-wide summary statistics. BioRxiv.
p.682237.
Cheng, Q. And et.al., 2020. MR-LDP: a two-sample Mendelian randomization for GWAS
summary statistics accounting for linkage disequilibrium and horizontal pleiotropy. NAR
Genomics and Bioinformatics. 2(2). p.lqaa028.
8
1 out of 10
Related Documents


Your All-in-One AI-Powered Toolkit for Academic Success.
+13062052269
info@desklib.com
Available 24*7 on WhatsApp / Email
![[object Object]](/_next/static/media/star-bottom.7253800d.svg)
Unlock your academic potential
Copyright © 2020–2026 A2Z Services. All Rights Reserved. Developed and managed by ZUCOL.