Business Statistics Assignment: Analysis and Solutions

Verified

Added on  2020/02/24

|17
|2441
|26
Homework Assignment
AI Summary
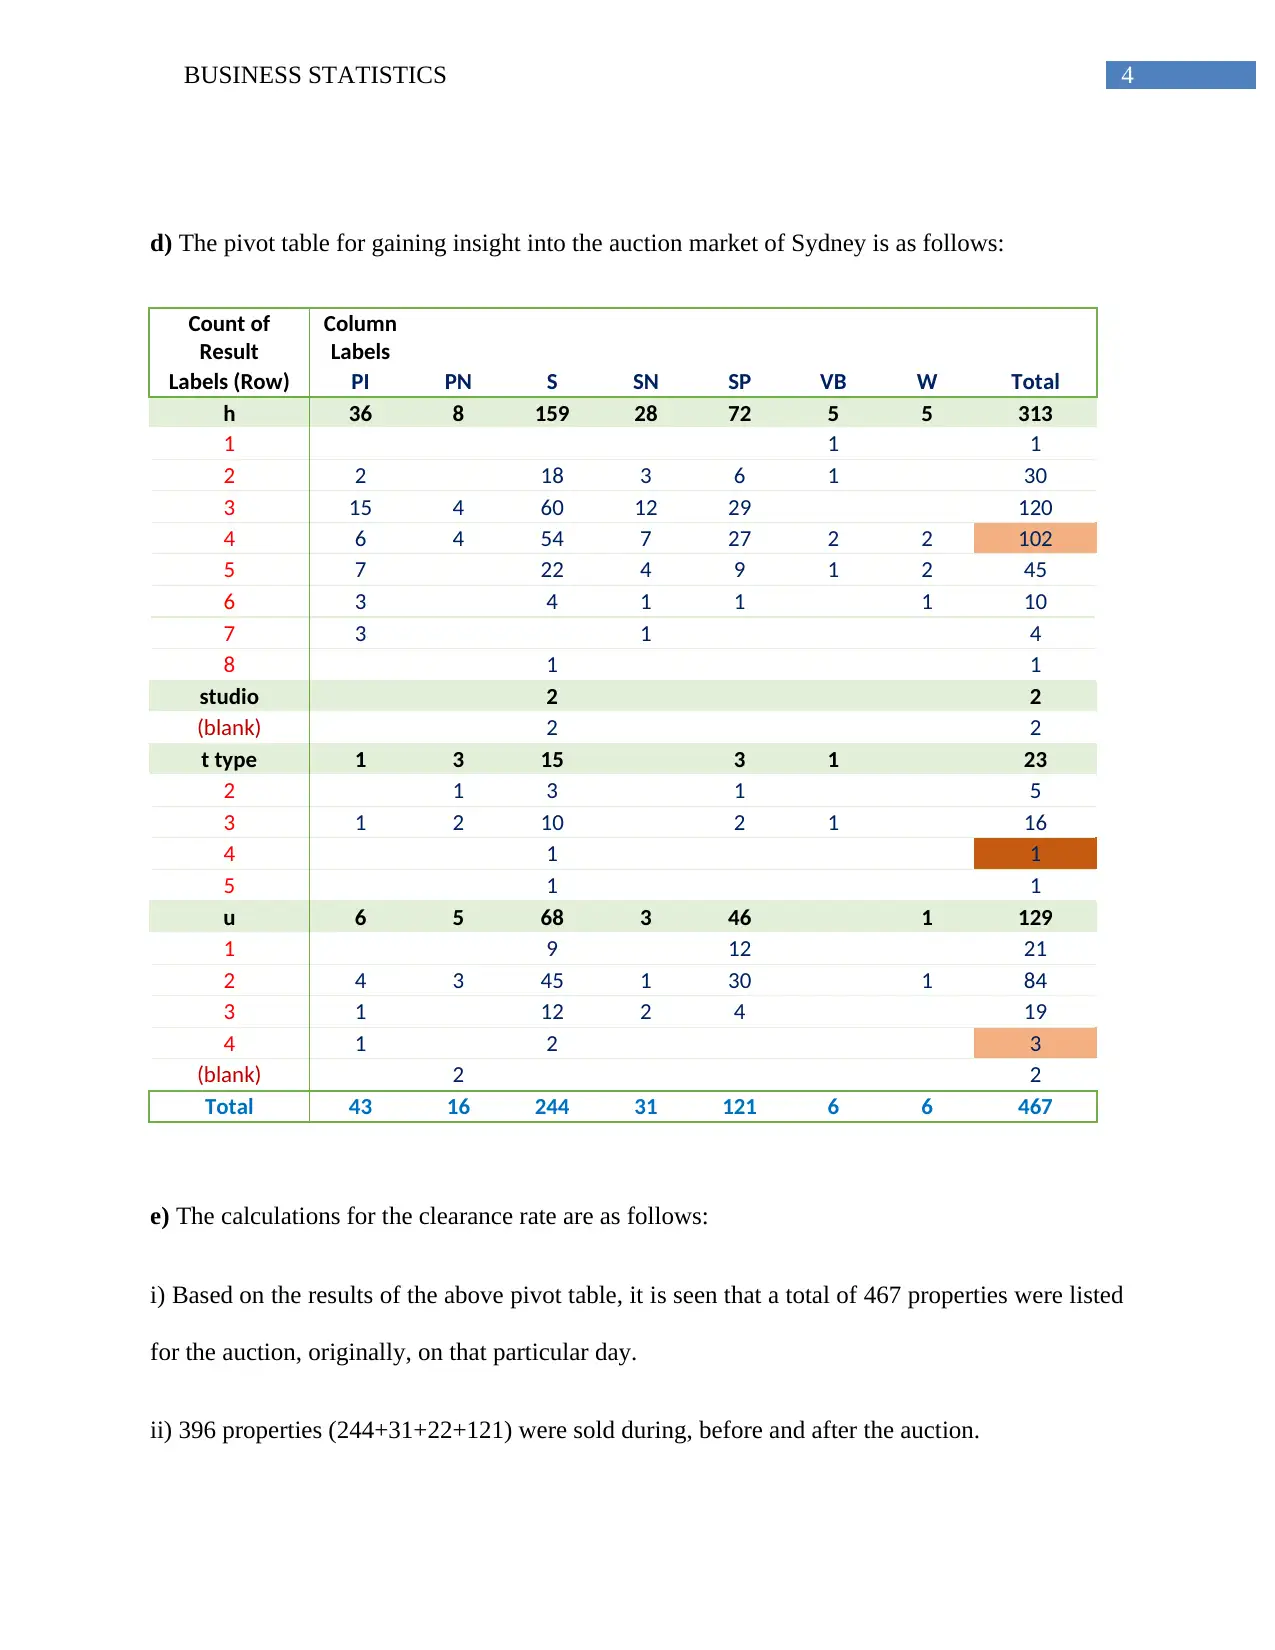
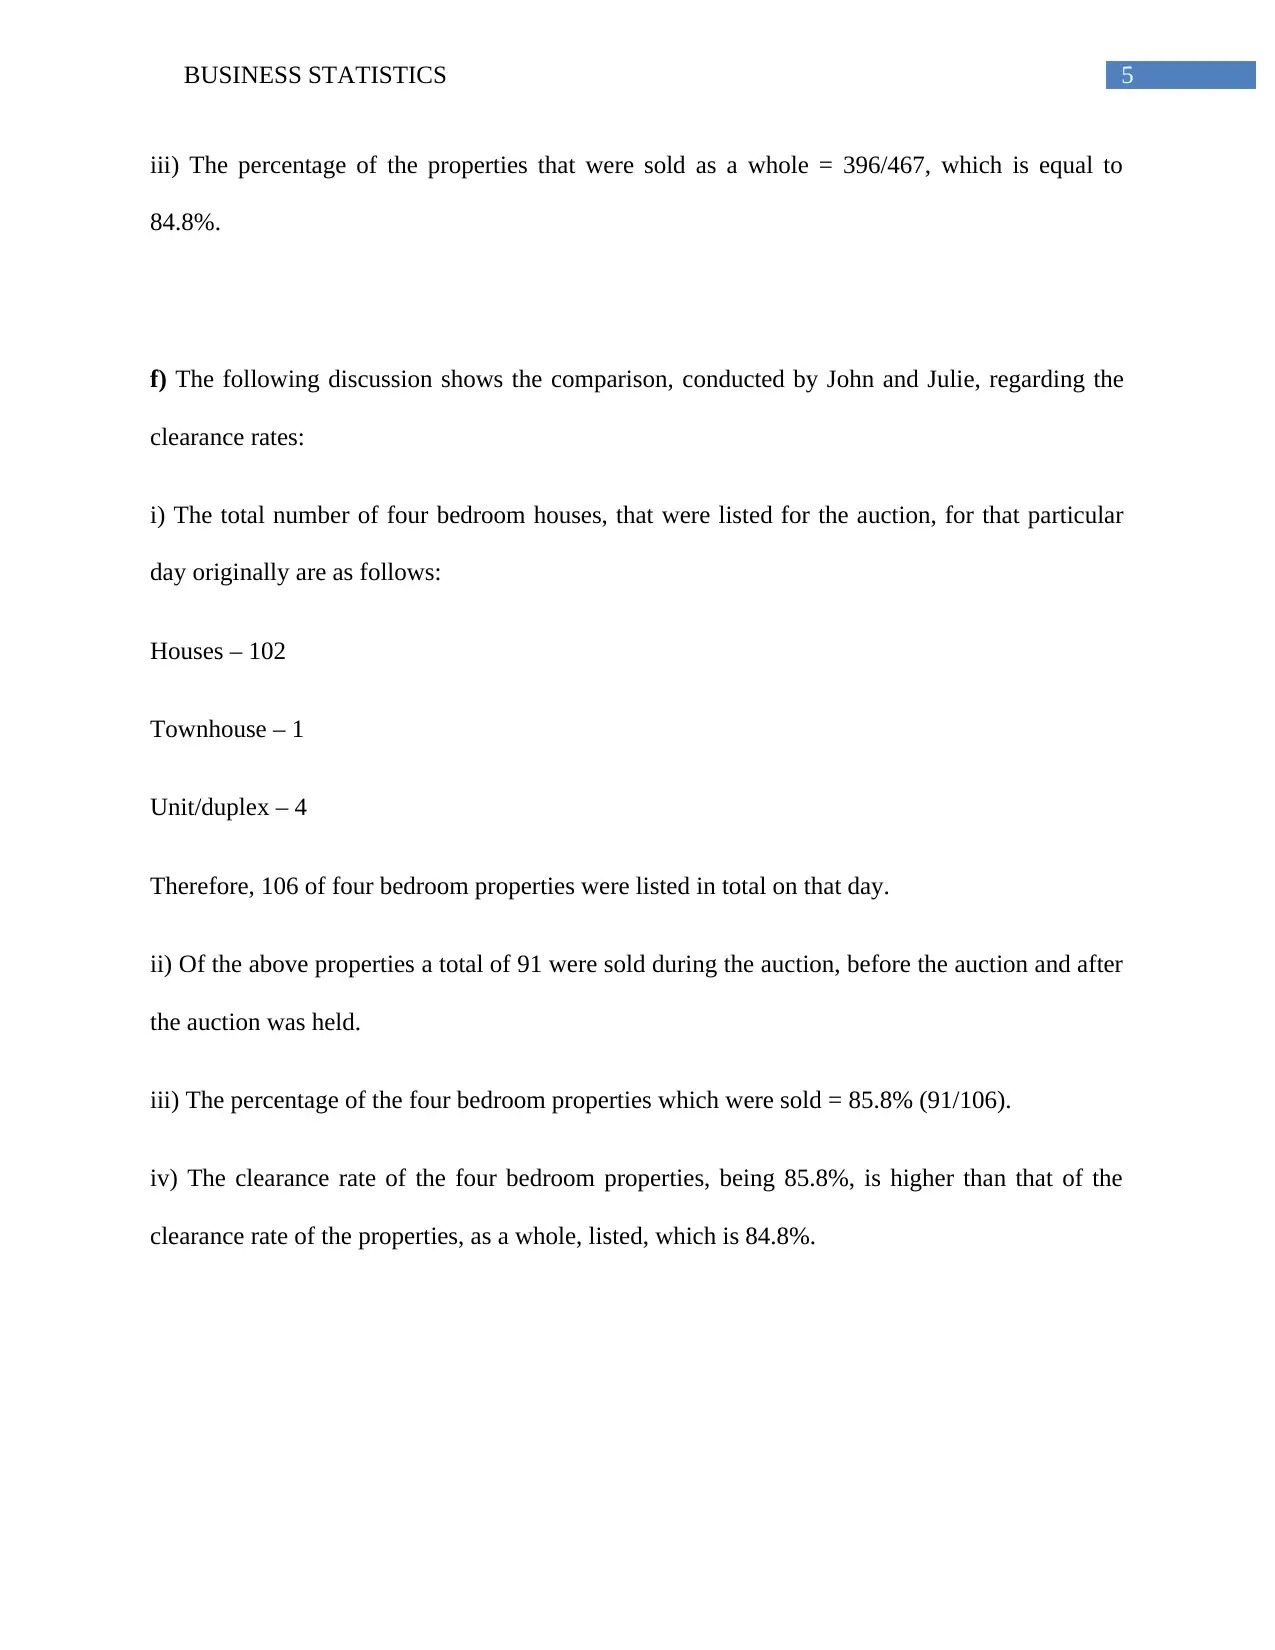
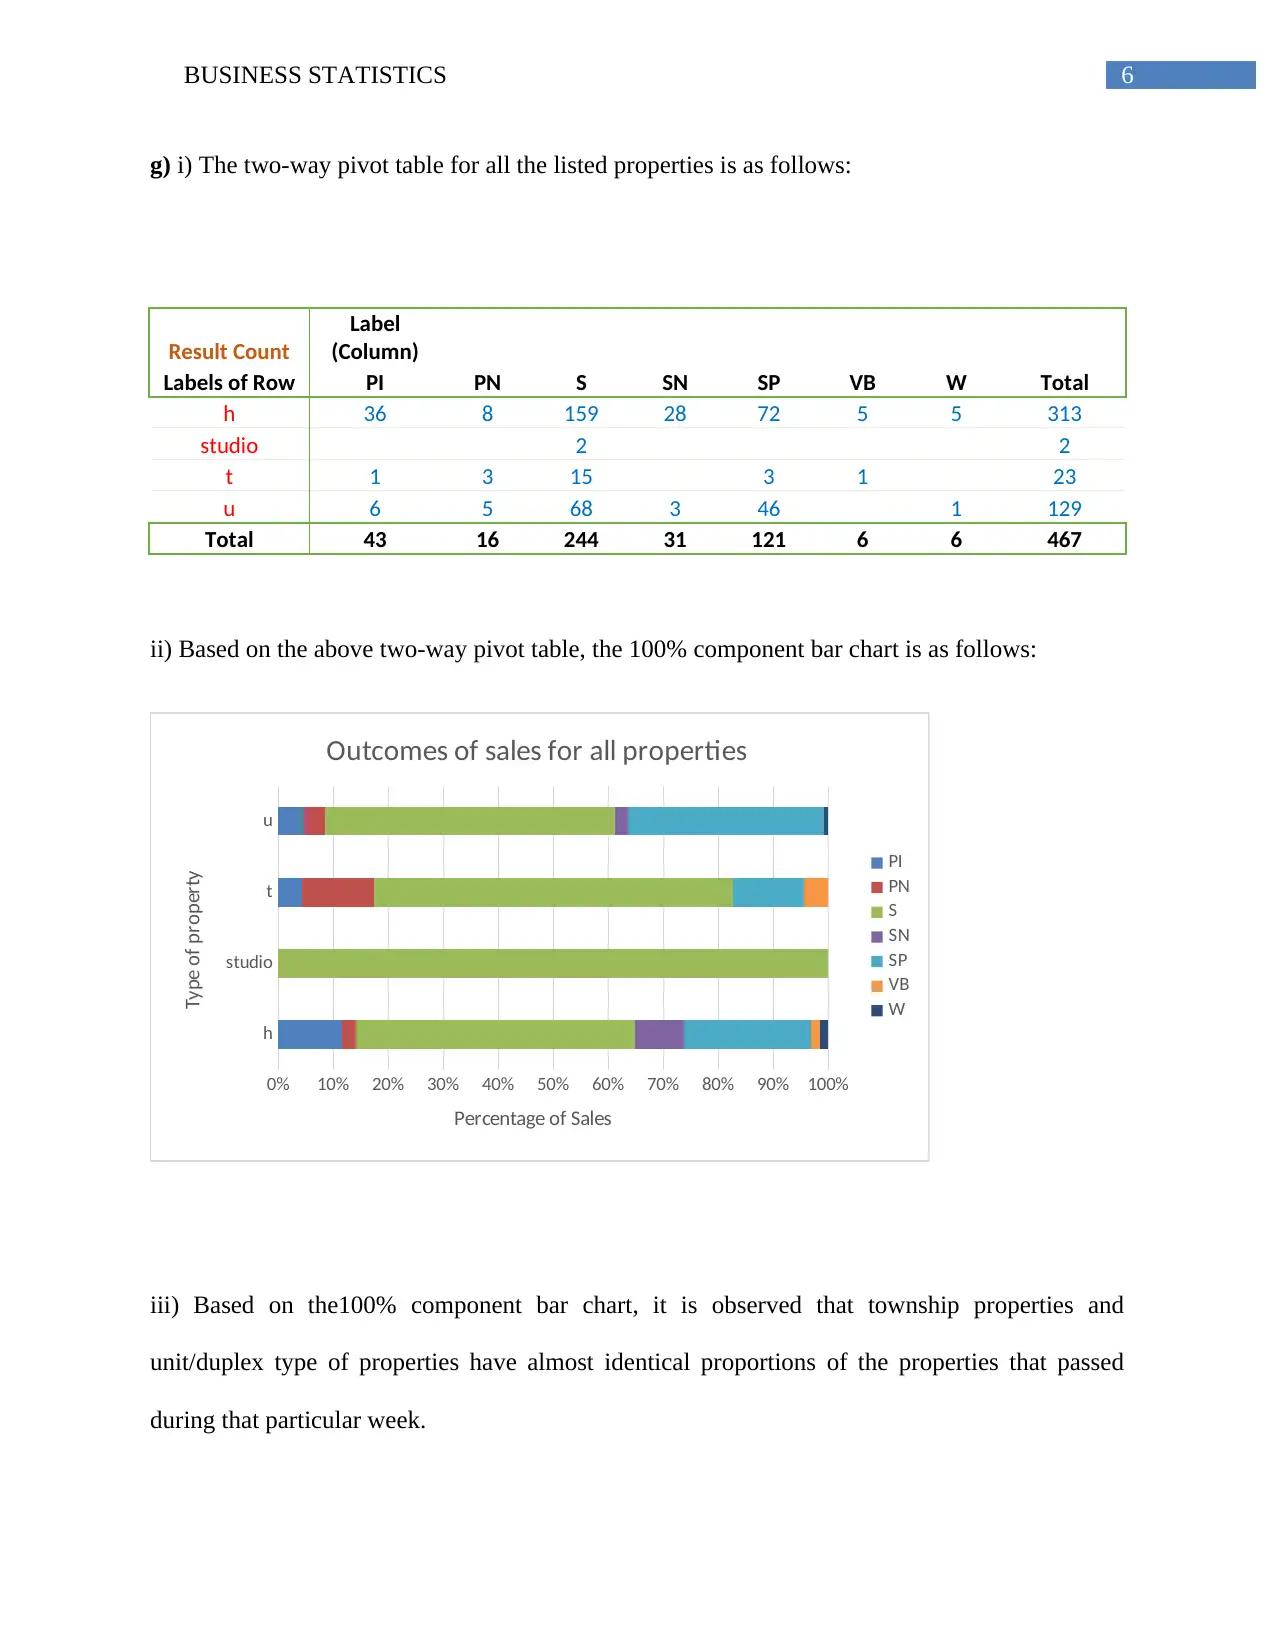
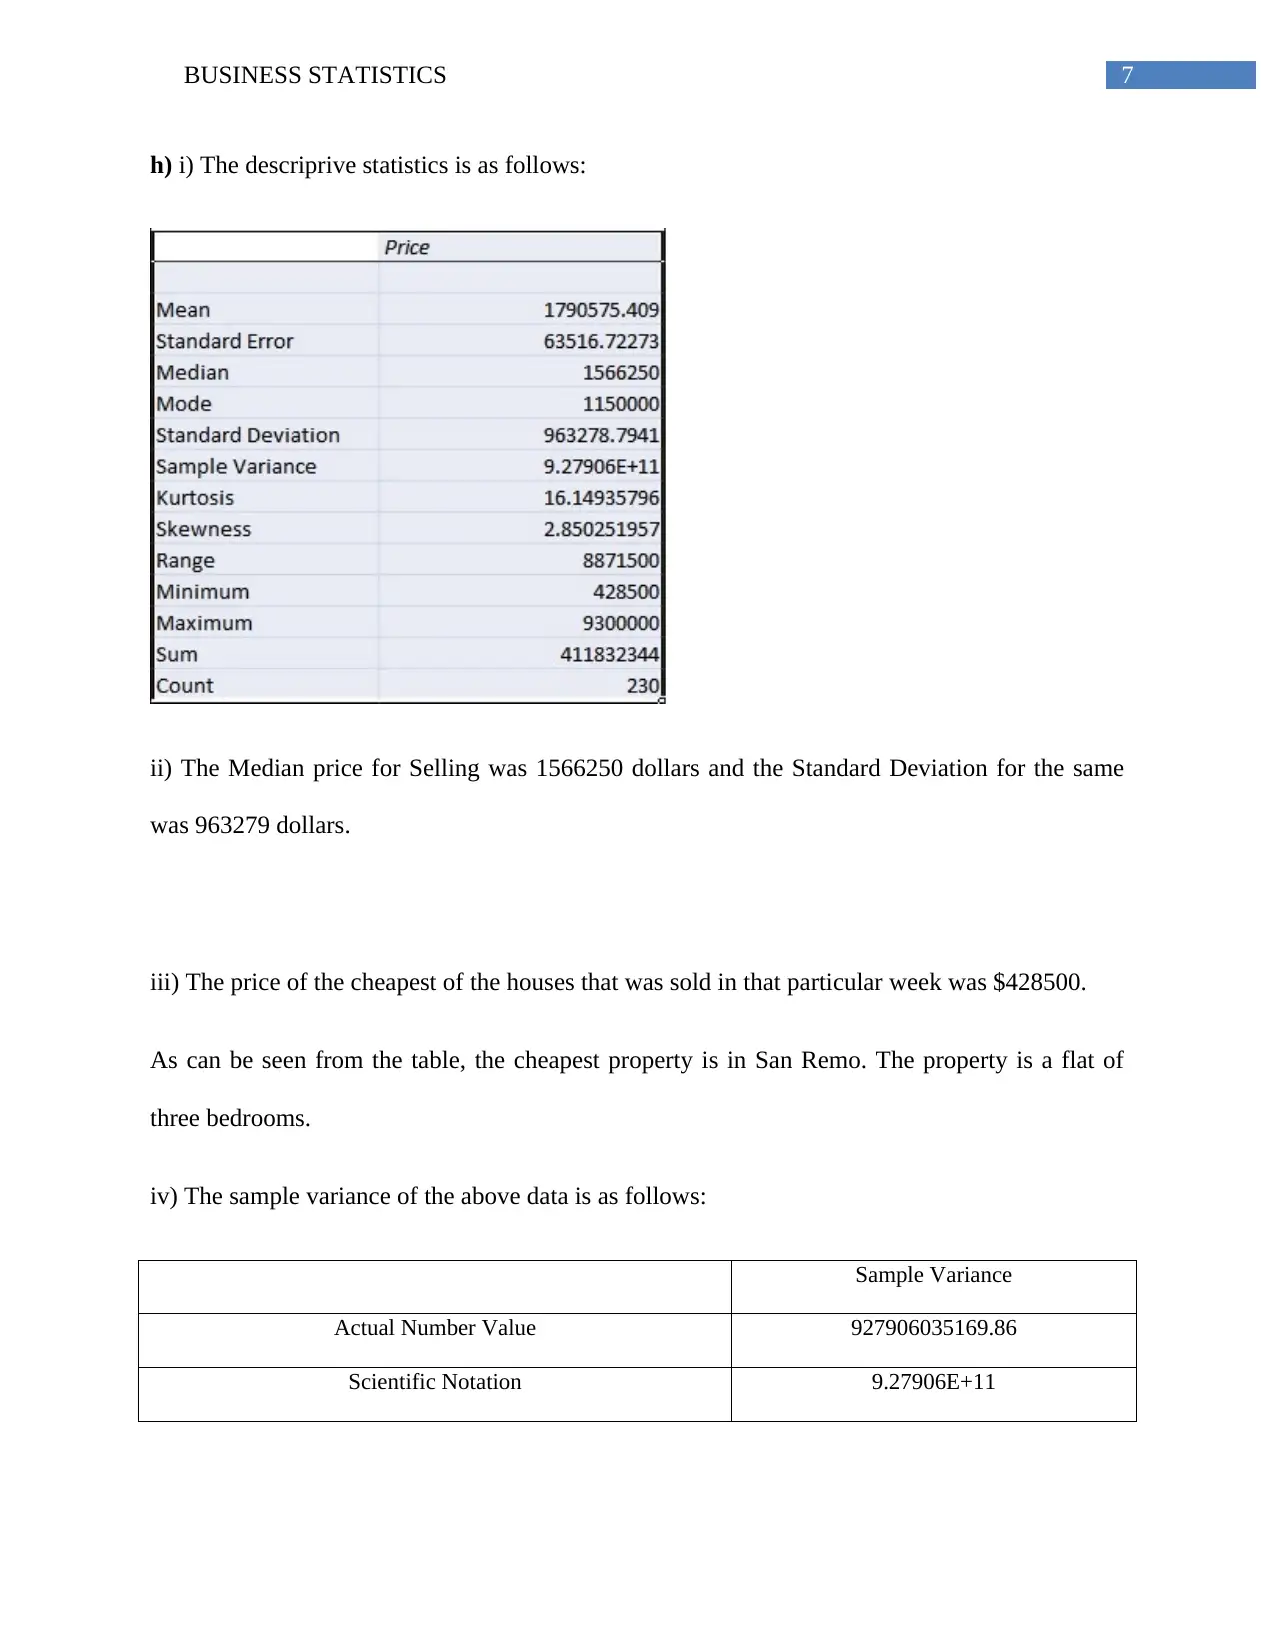
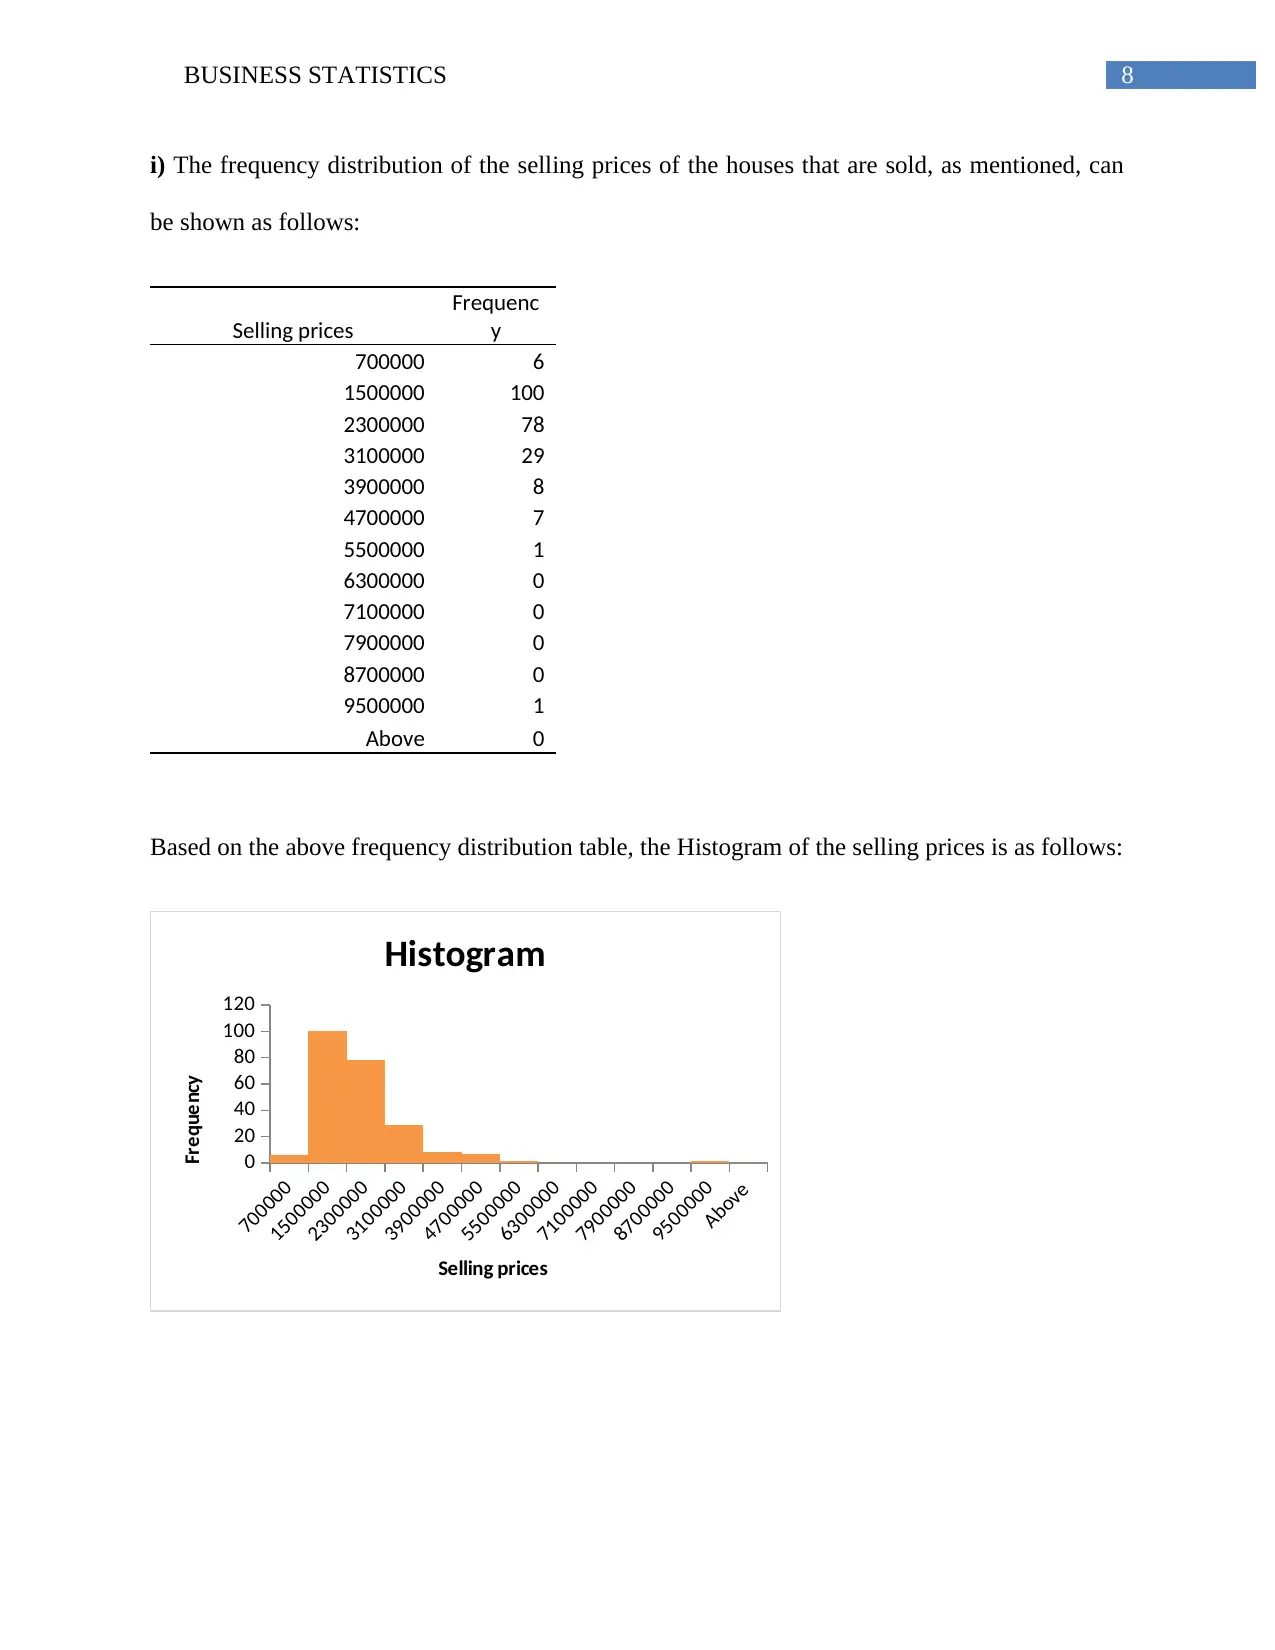
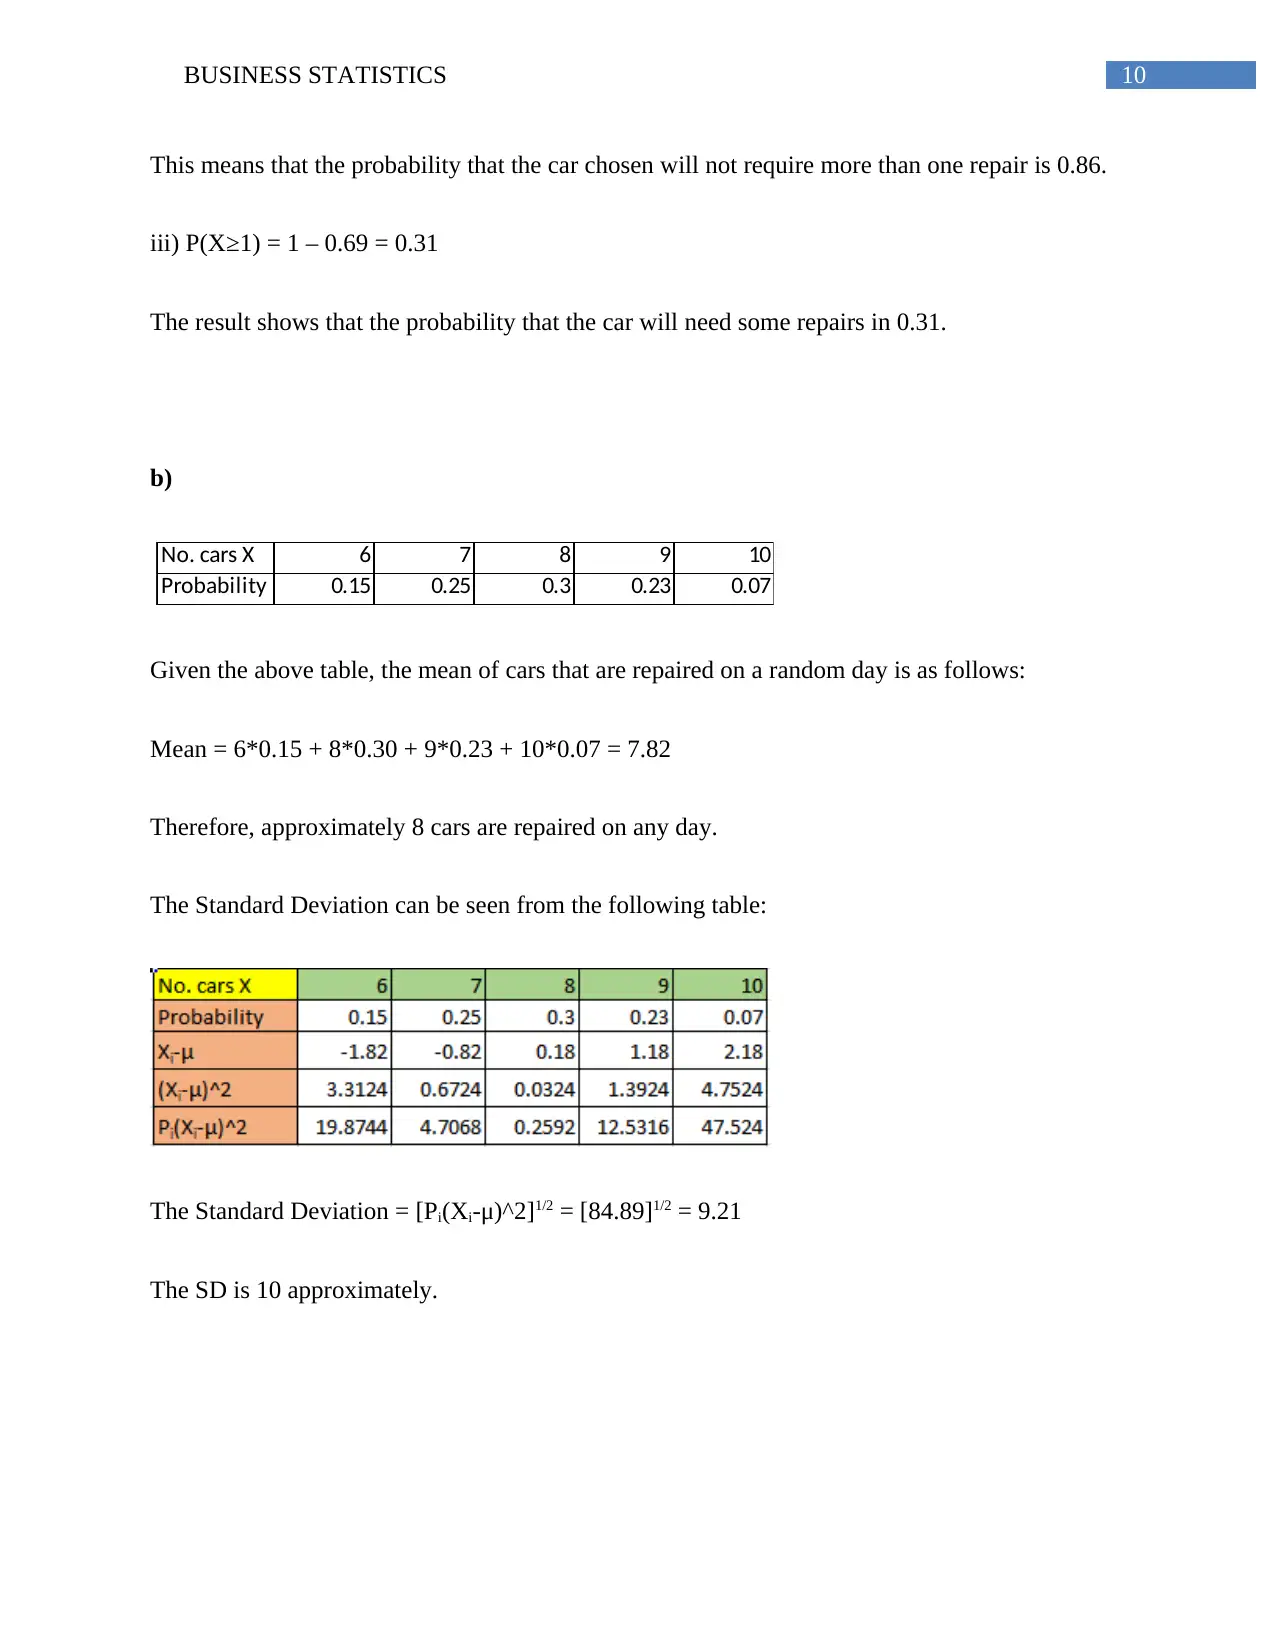
This document presents a comprehensive solution to a business statistics assignment. It begins with data analysis, categorizing variables and analyzing outcomes related to property auctions. The solution includes pivot tables to gain insights into the Sydney auction market, calculating clearance rates and comparing them across different property types. Probability concepts are applied to various scenarios, including the number of cars needing repair, worker absenteeism, and sales predictions. The assignment also covers statistical distributions such as binomial, Poisson, and normal distributions, with detailed calculations and interpretations. The analysis includes descriptive statistics, frequency distributions, and the comparison of mean and median prices, providing a thorough understanding of the statistical concepts and their applications in a business context.
Document Page
Running head: BUSINESS STATISTICS
Business Statistics
Name of the Student
Name of the University
Author Note
tabler-icon-diamond-filled.svg

Paraphrase This Document

Need a fresh take? Get an instant paraphrase of this document with our AI Paraphraser
Document Page
1BUSINESS STATISTICS
Table of Contents
Answer 1:.........................................................................................................................................2
Answer 2:.........................................................................................................................................9
Answer 3:.......................................................................................................................................11
Answer 4:.......................................................................................................................................13
Answer 5:.......................................................................................................................................13
Answer 6:.......................................................................................................................................14
Answer 7:.......................................................................................................................................15
References......................................................................................................................................16
Document Page
2BUSINESS STATISTICS
Answer 1:
a) The following are the variables from the data set which fall in the respective categories:
i) Qualitative and Normal variable: Address, Type, Agent and Address
ii) Qualitative and Ordinal variable: no variable
iii) Quantitative and Ratio variable: Price
iv) Quantitative and Ordinal variable: Bedrooms
b) The overall outcomes are shown in the following table:
Result Code Overall Outcome
PI, NB, VB Did not sell
SP, PN Sold prior to the auction
S,SN Sold at auction
SA,SS Sold after auction
W Withdrawn from sale
Document Page
3BUSINESS STATISTICS
c) The four properties where the number of bedrooms is missing are as follows:
Suburbs Address of the properties
Kirribilli 49/20, Carabella Street
North Sydney 307/54, High Street
Manly 1/19 – 23, Pittwater Road
Darlington 9/299, Abercrombie Street
The two properties of the above four, which are errors, are as follows:
Suburbs Address Price Result
North Sydney 307/54, High Street NA PN
Darlington 9/299, Abercrombie St. NA PN
The two above properties are errors due to the reasons, discussed as follows:
i. Both the properties were sold before auction was conducted, which implies at the time of the
auction, the properties were no longer available.
ii) The prices of both the properties were not revealed in the data set.
tabler-icon-diamond-filled.svg

Paraphrase This Document

Need a fresh take? Get an instant paraphrase of this document with our AI Paraphraser
Document Page
4BUSINESS STATISTICS
d) The pivot table for gaining insight into the auction market of Sydney is as follows:
Count of
Result
Column
Labels
Labels (Row) PI PN S SN SP VB W Total
h 36 8 159 28 72 5 5 313
1 1 1
2 2 18 3 6 1 30
3 15 4 60 12 29 120
4 6 4 54 7 27 2 2 102
5 7 22 4 9 1 2 45
6 3 4 1 1 1 10
7 3 1 4
8 1 1
studio 2 2
(blank) 2 2
t type 1 3 15 3 1 23
2 1 3 1 5
3 1 2 10 2 1 16
4 1 1
5 1 1
u 6 5 68 3 46 1 129
1 9 12 21
2 4 3 45 1 30 1 84
3 1 12 2 4 19
4 1 2 3
(blank) 2 2
Total 43 16 244 31 121 6 6 467
e) The calculations for the clearance rate are as follows:
i) Based on the results of the above pivot table, it is seen that a total of 467 properties were listed
for the auction, originally, on that particular day.
ii) 396 properties (244+31+22+121) were sold during, before and after the auction.
Document Page
5BUSINESS STATISTICS
iii) The percentage of the properties that were sold as a whole = 396/467, which is equal to
84.8%.
f) The following discussion shows the comparison, conducted by John and Julie, regarding the
clearance rates:
i) The total number of four bedroom houses, that were listed for the auction, for that particular
day originally are as follows:
Houses – 102
Townhouse – 1
Unit/duplex – 4
Therefore, 106 of four bedroom properties were listed in total on that day.
ii) Of the above properties a total of 91 were sold during the auction, before the auction and after
the auction was held.
iii) The percentage of the four bedroom properties which were sold = 85.8% (91/106).
iv) The clearance rate of the four bedroom properties, being 85.8%, is higher than that of the
clearance rate of the properties, as a whole, listed, which is 84.8%.
Document Page
6BUSINESS STATISTICS
g) i) The two-way pivot table for all the listed properties is as follows:
Result Count
Label
(Column)
Labels of Row PI PN S SN SP VB W Total
h 36 8 159 28 72 5 5 313
studio 2 2
t 1 3 15 3 1 23
u 6 5 68 3 46 1 129
Total 43 16 244 31 121 6 6 467
ii) Based on the above two-way pivot table, the 100% component bar chart is as follows:
h
studio
t
u
0% 10% 20% 30% 40% 50% 60% 70% 80% 90% 100%
Outcomes of sales for all properties
PI
PN
S
SN
SP
VB
W
Percentage of Sales
Type of property
iii) Based on the100% component bar chart, it is observed that township properties and
unit/duplex type of properties have almost identical proportions of the properties that passed
during that particular week.
tabler-icon-diamond-filled.svg

Paraphrase This Document

Need a fresh take? Get an instant paraphrase of this document with our AI Paraphraser
Document Page
7BUSINESS STATISTICS
h) i) The descriprive statistics is as follows:
ii) The Median price for Selling was 1566250 dollars and the Standard Deviation for the same
was 963279 dollars.
iii) The price of the cheapest of the houses that was sold in that particular week was $428500.
As can be seen from the table, the cheapest property is in San Remo. The property is a flat of
three bedrooms.
iv) The sample variance of the above data is as follows:
Sample Variance
Actual Number Value 927906035169.86
Scientific Notation 9.27906E+11
Document Page
8BUSINESS STATISTICS
i) The frequency distribution of the selling prices of the houses that are sold, as mentioned, can
be shown as follows:
Selling prices
Frequenc
y
700000 6
1500000 100
2300000 78
3100000 29
3900000 8
4700000 7
5500000 1
6300000 0
7100000 0
7900000 0
8700000 0
9500000 1
Above 0
Based on the above frequency distribution table, the Histogram of the selling prices is as follows:
700000
1500000
2300000
3100000
3900000
4700000
5500000
6300000
7100000
7900000
8700000
9500000
Above
0
20
40
60
80
100
120
Histogram
Selling prices
Frequency
Document Page
9BUSINESS STATISTICS
j) Instead of using mean price, during the quotation of the prices of the houses in Sydney, the
median prices are always considered. This is done because, mean takes all the samples in the
data and is extremely affected by the extreme values which are present in the series. However,
the median pricing is more appropriate as it shows the 50% point of the data and is not affected
by the extreme values unlike mean prices. Therefore, median pricing is more appropriate than ea
pricing.
In the above data, it can be seen that the mean price is 1790575 whereas that of the median price
is 1566250, which implies that fifty percent of the total observations, are above this value and the
rest are below. This observation is supported by the outcome as is shown in the above histogram.
Answer 2:
a) Let X be the event of the number of cars that needs repairing.
i) P(X=1) = 0.17
P(X=2) = 0.08
P(X>2) = 0.06
Therefore, P(X=0) = 1 – 0.17- 0.08-0.06 = 0.69
This implies that the probability that the car needs no repair is 0.69.
ii) P(X≤1) = 0.69+0.17 = 0.86
tabler-icon-diamond-filled.svg

Paraphrase This Document

Need a fresh take? Get an instant paraphrase of this document with our AI Paraphraser
Document Page
10BUSINESS STATISTICS
This means that the probability that the car chosen will not require more than one repair is 0.86.
iii) P(X≥1) = 1 – 0.69 = 0.31
The result shows that the probability that the car will need some repairs in 0.31.
b)
No. cars X 6 7 8 9 10
Probability 0.15 0.25 0.3 0.23 0.07
Given the above table, the mean of cars that are repaired on a random day is as follows:
Mean = 6*0.15 + 8*0.30 + 9*0.23 + 10*0.07 = 7.82
Therefore, approximately 8 cars are repaired on any day.
The Standard Deviation can be seen from the following table:
The Standard Deviation = [Pi(Xi-μ)^2]1/2 = [84.89]1/2 = 9.21
The SD is 10 approximately.
Document Page
11BUSINESS STATISTICS
c) The sample is biased due to the following reasons:
A. The survey is gender biased as it primarily took into account females, thereby biasing the data
set.
B. The survey specifically was conducted for only a single day, ruling out the variations that can
occur in the numbers on any other day. It would have been better if the survey took into account
more than one (at-least four) days within a specific period as that would have made the results
more robust and reliable (Ross, 2014).
d) i) Paul should sample at least (300/900)*90 male members = 30 male members between the
range of 31 years to 50 years.
ii) He should survey (200/900)*90 female members = 20 female members.
Answer 3:
a) In the concerned problem, there are presence of two types of incidents, namely, “Day shift
work” and “Workers not turning up”. Let T denotes that the worker is not coming to work and D
shows the day shift work. This implies D’ shows the work in night shift and T’ shows that the
worker is coming for work.
The probability tree is as follows:
chevron_up_icon
1 out of 17
circle_padding
hide_on_mobile
zoom_out_icon
[object Object]