Statistical Valuation of Business - University Assignment, Semester 2

Verified

Added on  2022/08/19

|12
|788
|10
Homework Assignment
AI Summary
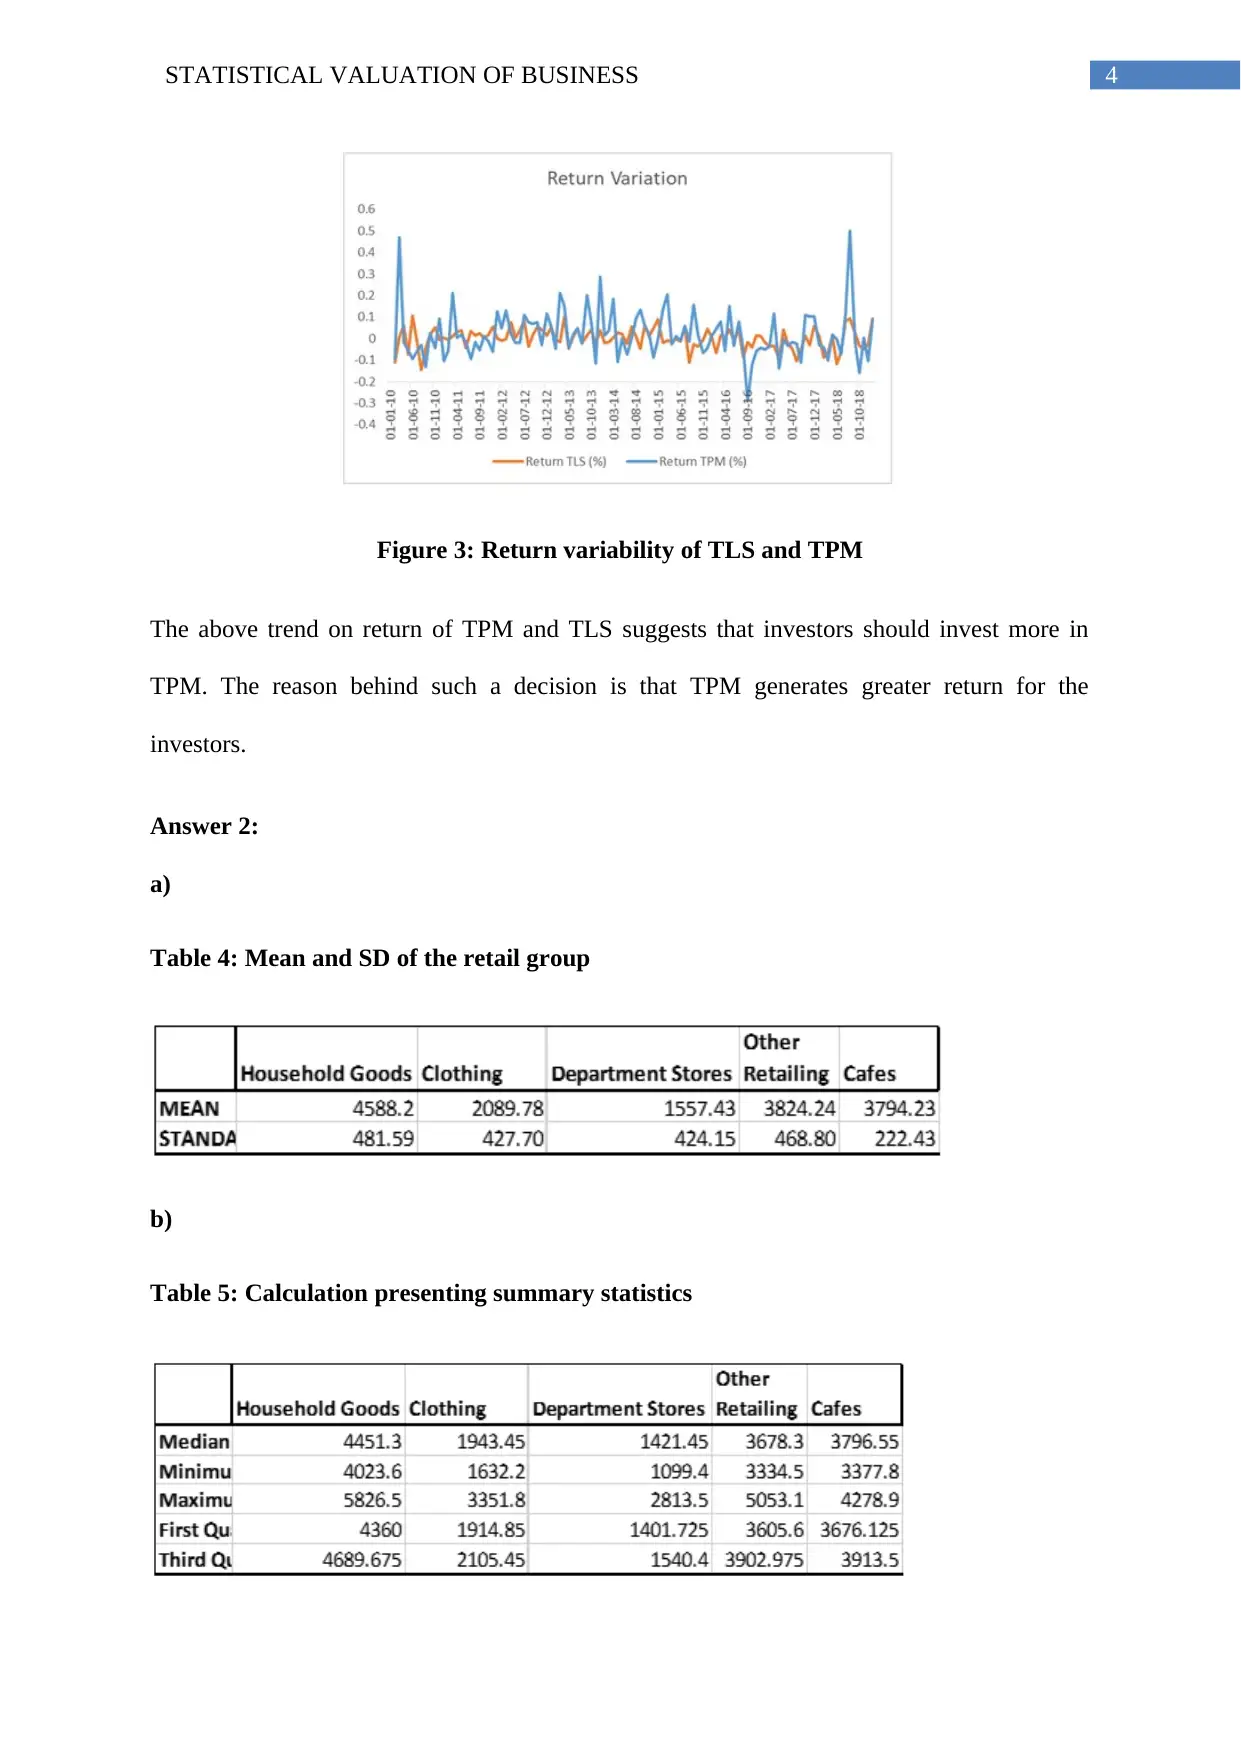
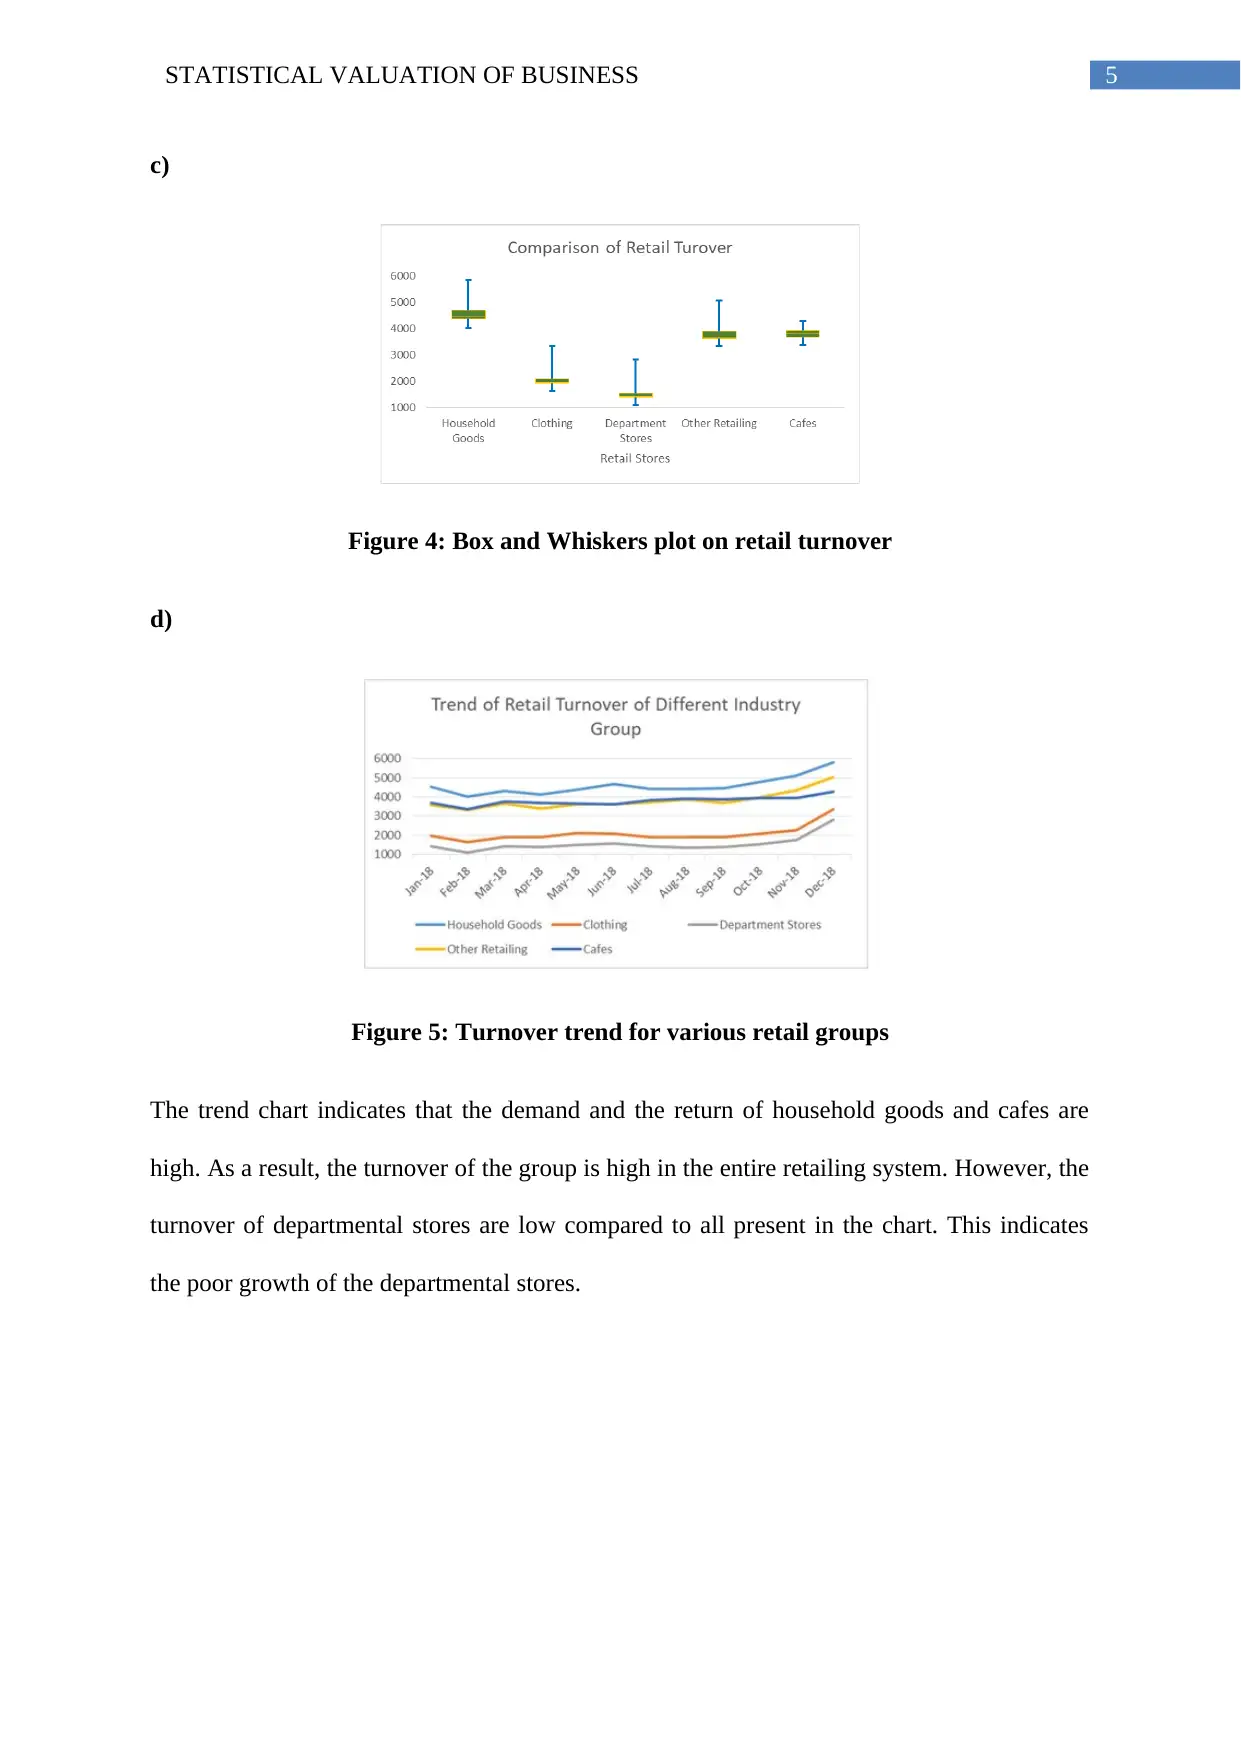
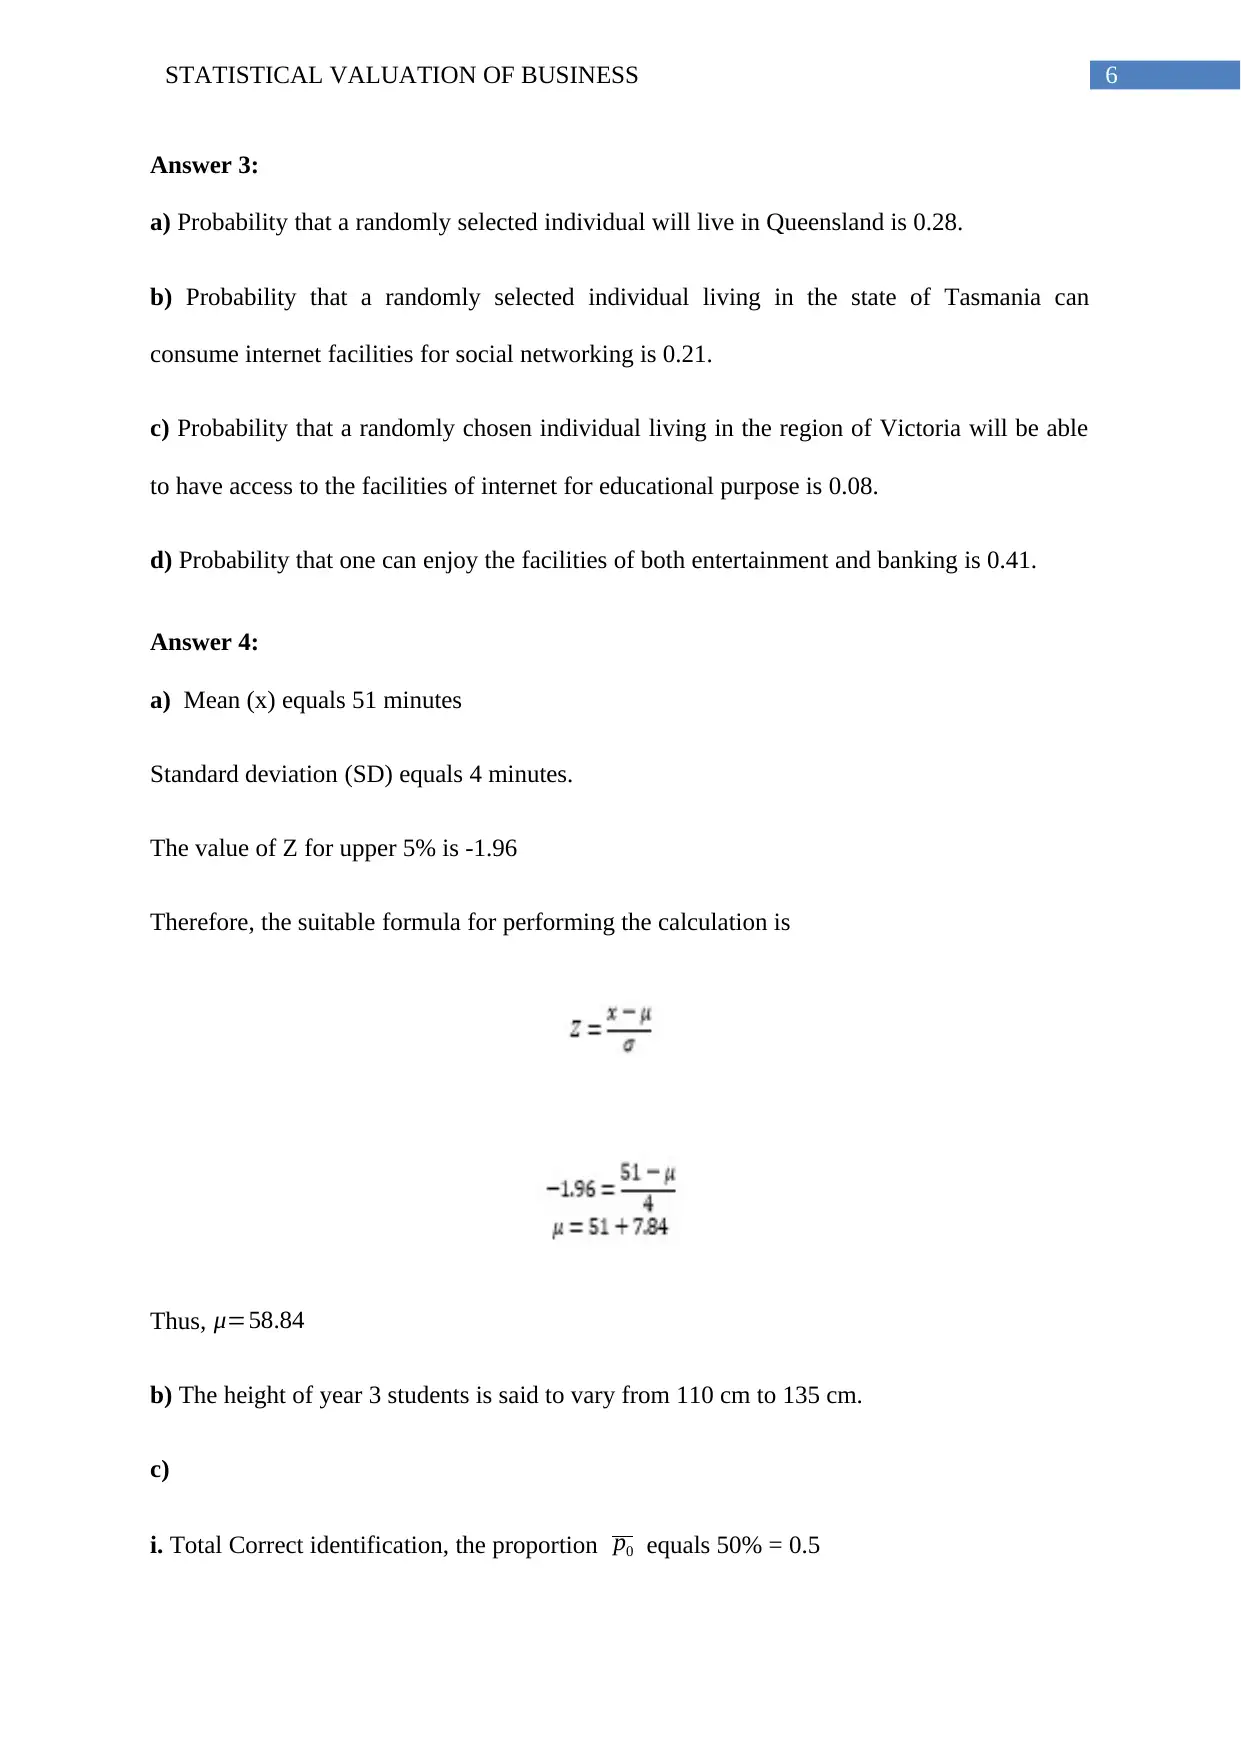
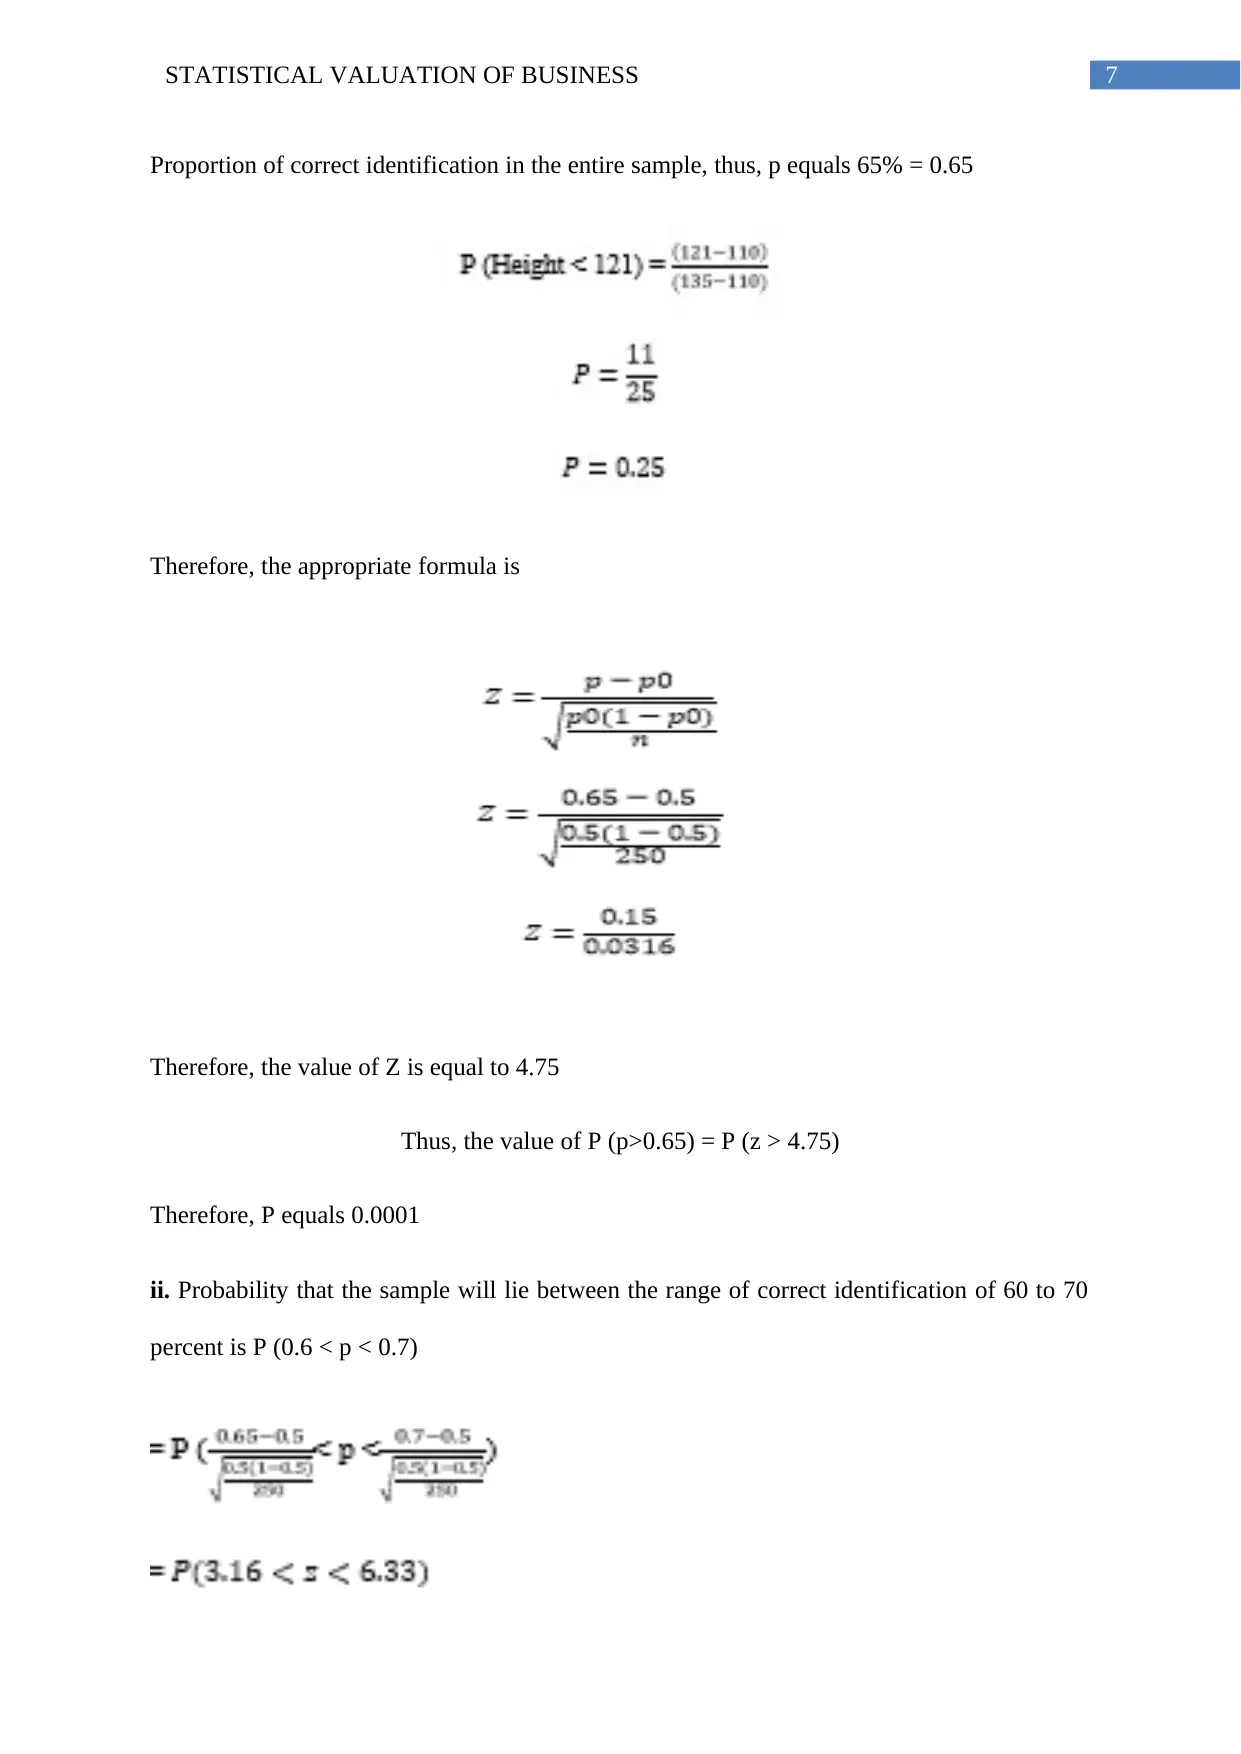
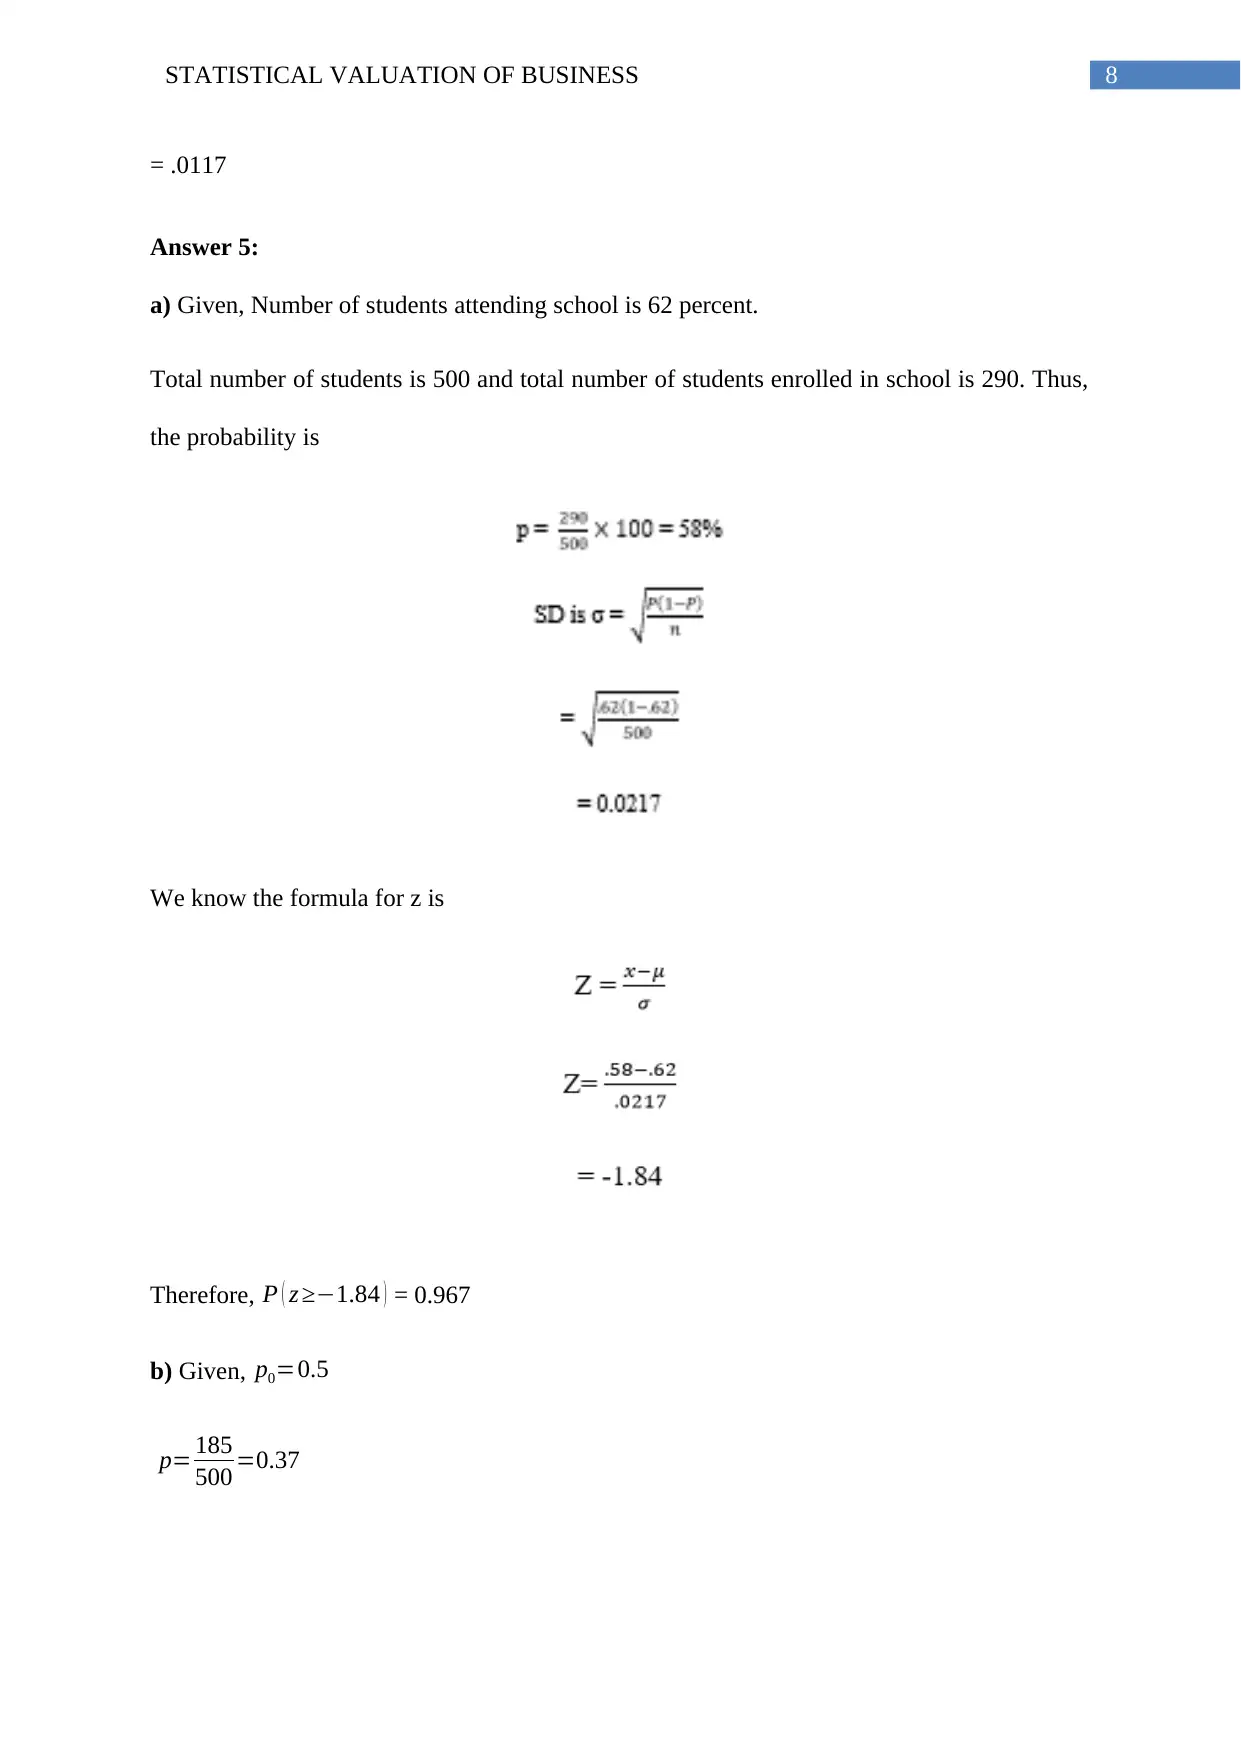
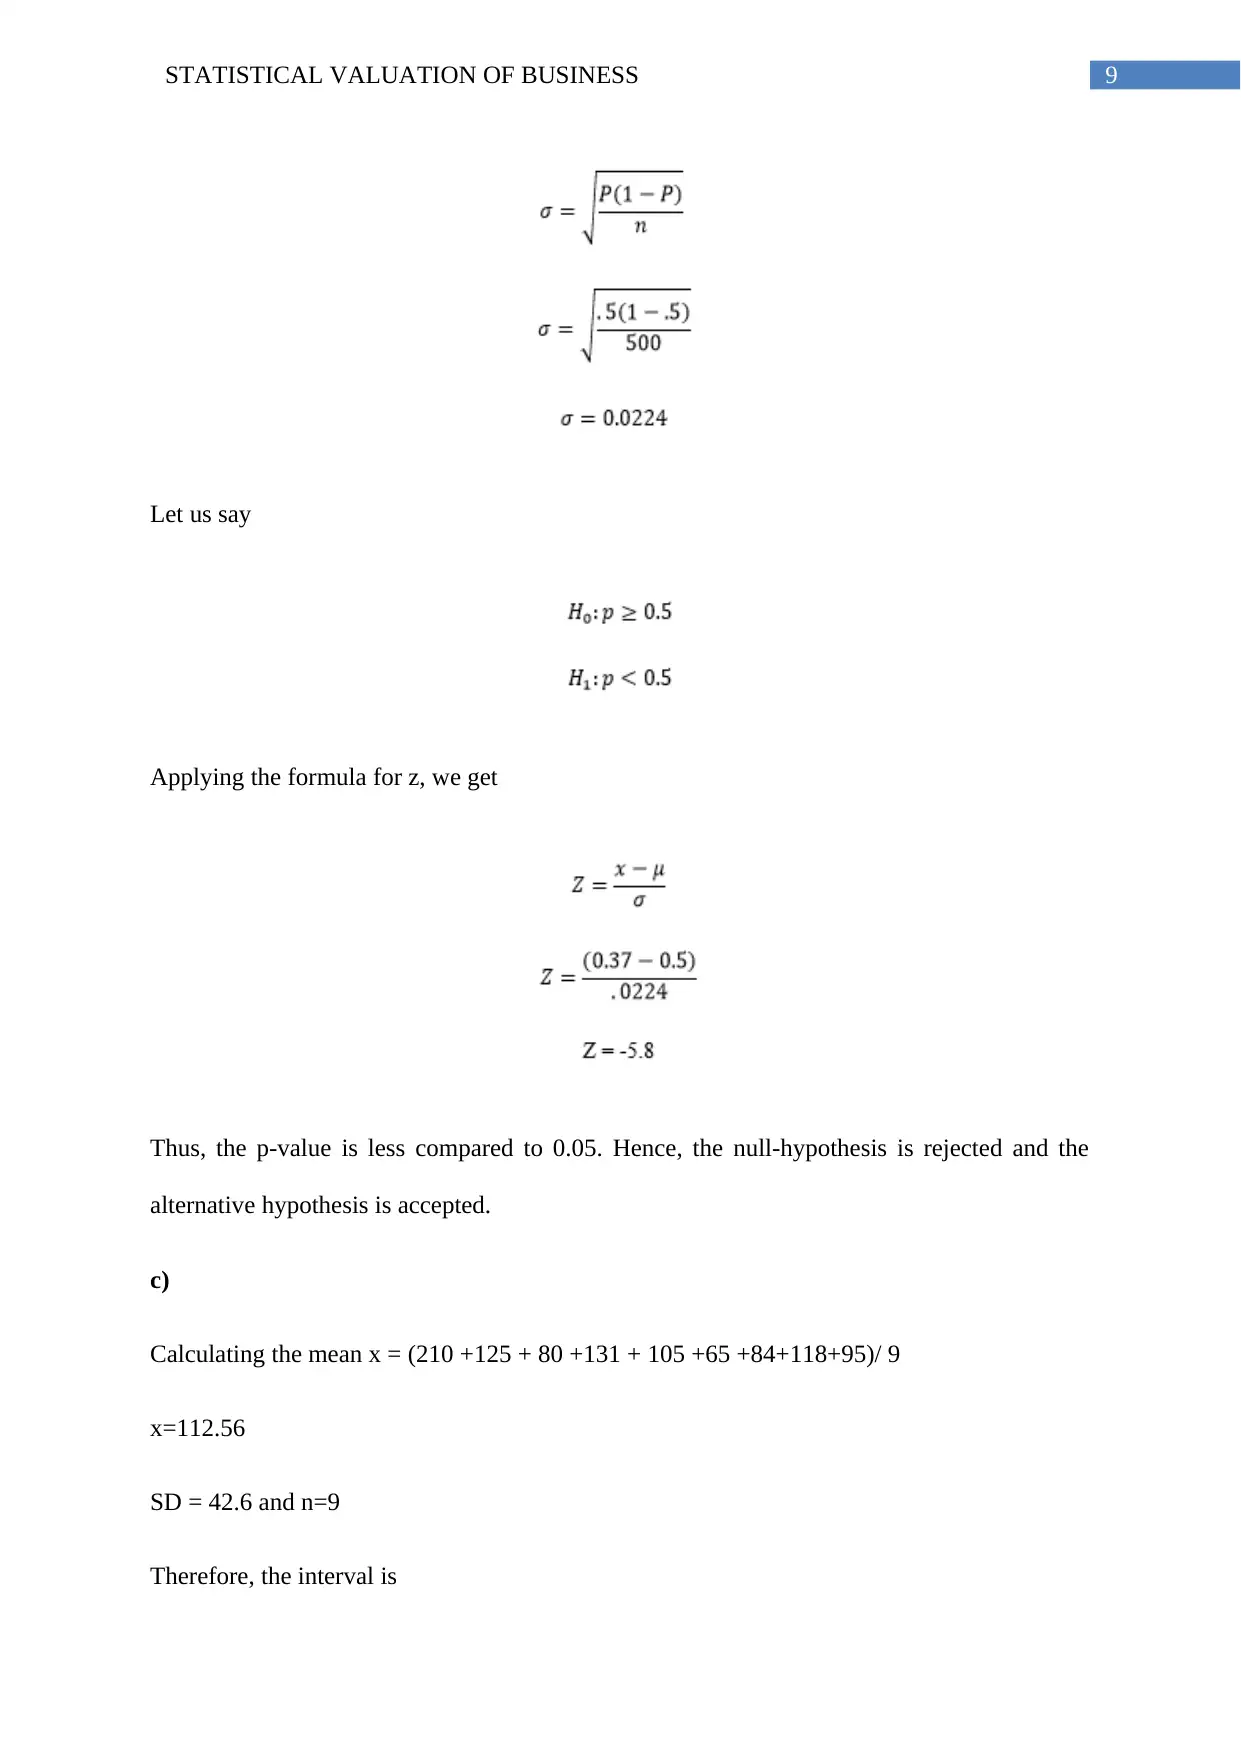
This document presents a comprehensive solution to a statistical valuation assignment, addressing various statistical concepts and their application to business scenarios. The assignment covers topics such as data analysis, including the creation and interpretation of stem and leaf plots, frequency comparisons, and market capitalization charts. It further delves into return variability analysis, retail turnover trends, and probability calculations related to consumer behavior and internet usage. The solution includes detailed calculations, interpretations of results, and the application of statistical formulas like z-scores and p-values for hypothesis testing. The use of Excel for data presentation and calculations is evident, providing a practical approach to solving the assignment problems. The assignment concludes with a series of statistical analyses, including calculations of means, standard deviations, and confidence intervals, alongside relevant references.
Document Page
Running head: STATISTICAL VALUATION OF BUSINESS
STATISTICAL VALUATION OF BUSINESS
Name of the Student
Name of the University
Author Note
Course ID:
tabler-icon-diamond-filled.svg

Paraphrase This Document

Need a fresh take? Get an instant paraphrase of this document with our AI Paraphraser
Document Page
1STATISTICAL VALUATION OF BUSINESS
Table of Contents
Answer 1:...................................................................................................................................2
Answer 2:...................................................................................................................................4
Answer 3:...................................................................................................................................6
Answer 4:...................................................................................................................................6
Answer 5:...................................................................................................................................8
References................................................................................................................................11
Document Page
2STATISTICAL VALUATION OF BUSINESS
Answer 1:
a) Table 1: Data of opening prices of TLS and TPM taken in quarterly basis
The table demonstrates the opening prices of TPM and TLS from 2010 January to 2018
December.
Table 2: Displaying Steam and Leaf plot
Document Page
3STATISTICAL VALUATION OF BUSINESS
The above table is a demonstration of stem and leaf of both the companies, with TLS on right
and TPM on left.
b)
Figure 1: Comparison between frequencies of both the companies
c)
Table 3: Chart showing market capitalisation of five telecommunicating companies
Figure 2: Market share of five listed telecommunicating companies of Australia
d)
tabler-icon-diamond-filled.svg

Paraphrase This Document

Need a fresh take? Get an instant paraphrase of this document with our AI Paraphraser
Document Page
4STATISTICAL VALUATION OF BUSINESS
Figure 3: Return variability of TLS and TPM
The above trend on return of TPM and TLS suggests that investors should invest more in
TPM. The reason behind such a decision is that TPM generates greater return for the
investors.
Answer 2:
a)
Table 4: Mean and SD of the retail group
b)
Table 5: Calculation presenting summary statistics
Document Page
5STATISTICAL VALUATION OF BUSINESS
c)
Figure 4: Box and Whiskers plot on retail turnover
d)
Figure 5: Turnover trend for various retail groups
The trend chart indicates that the demand and the return of household goods and cafes are
high. As a result, the turnover of the group is high in the entire retailing system. However, the
turnover of departmental stores are low compared to all present in the chart. This indicates
the poor growth of the departmental stores.
Document Page
6STATISTICAL VALUATION OF BUSINESS
Answer 3:
a) Probability that a randomly selected individual will live in Queensland is 0.28.
b) Probability that a randomly selected individual living in the state of Tasmania can
consume internet facilities for social networking is 0.21.
c) Probability that a randomly chosen individual living in the region of Victoria will be able
to have access to the facilities of internet for educational purpose is 0.08.
d) Probability that one can enjoy the facilities of both entertainment and banking is 0.41.
Answer 4:
a) Mean (x) equals 51 minutes
Standard deviation (SD) equals 4 minutes.
The value of Z for upper 5% is -1.96
Therefore, the suitable formula for performing the calculation is
Thus, μ=58.84
b) The height of year 3 students is said to vary from 110 cm to 135 cm.
c)
i. Total Correct identification, the proportion p0 equals 50% = 0.5
tabler-icon-diamond-filled.svg

Paraphrase This Document

Need a fresh take? Get an instant paraphrase of this document with our AI Paraphraser
Document Page
7STATISTICAL VALUATION OF BUSINESS
Proportion of correct identification in the entire sample, thus, p equals 65% = 0.65
Therefore, the appropriate formula is
Therefore, the value of Z is equal to 4.75
Thus, the value of P (p>0.65) = P (z > 4.75)
Therefore, P equals 0.0001
ii. Probability that the sample will lie between the range of correct identification of 60 to 70
percent is P (0.6 < p < 0.7)
Document Page
8STATISTICAL VALUATION OF BUSINESS
= .0117
Answer 5:
a) Given, Number of students attending school is 62 percent.
Total number of students is 500 and total number of students enrolled in school is 290. Thus,
the probability is
We know the formula for z is
Therefore, P ( z 1.84 ) = 0.967
b) Given, p0=0.5
p= 185
500 =0.37
Document Page
9STATISTICAL VALUATION OF BUSINESS
Let us say
Applying the formula for z, we get
Thus, the p-value is less compared to 0.05. Hence, the null-hypothesis is rejected and the
alternative hypothesis is accepted.
c)
Calculating the mean x = (210 +125 + 80 +131 + 105 +65 +84+118+95)/ 9
x=112.56
SD = 42.6 and n=9
Therefore, the interval is
tabler-icon-diamond-filled.svg

Paraphrase This Document

Need a fresh take? Get an instant paraphrase of this document with our AI Paraphraser
Document Page
10STATISTICAL VALUATION OF BUSINESS
Document Page
11STATISTICAL VALUATION OF BUSINESS
References
David, M. (2017). Statistics for Managers, Using Microsoft Excel. Pearson Education India.
Groebner, D. F., Shannon, P. W., Fry, P. C., & Smith, K. D. (2013). Business statistics.
Pearson Education UK.
Krolzig, H. M. (2013). Markov-switching vector autoregressions: Modelling, statistical
inference, and application to business cycle analysis (Vol. 454). Springer Science &
Business Media.
Siegel, A. (2016). Practical business statistics. Academic Press.
chevron_up_icon
1 out of 12
circle_padding
hide_on_mobile
zoom_out_icon
[object Object]