Business Statistics Assignment: Analysis and Interpretation
VerifiedAdded on 2022/08/19
|16
|1546
|11
Homework Assignment
AI Summary
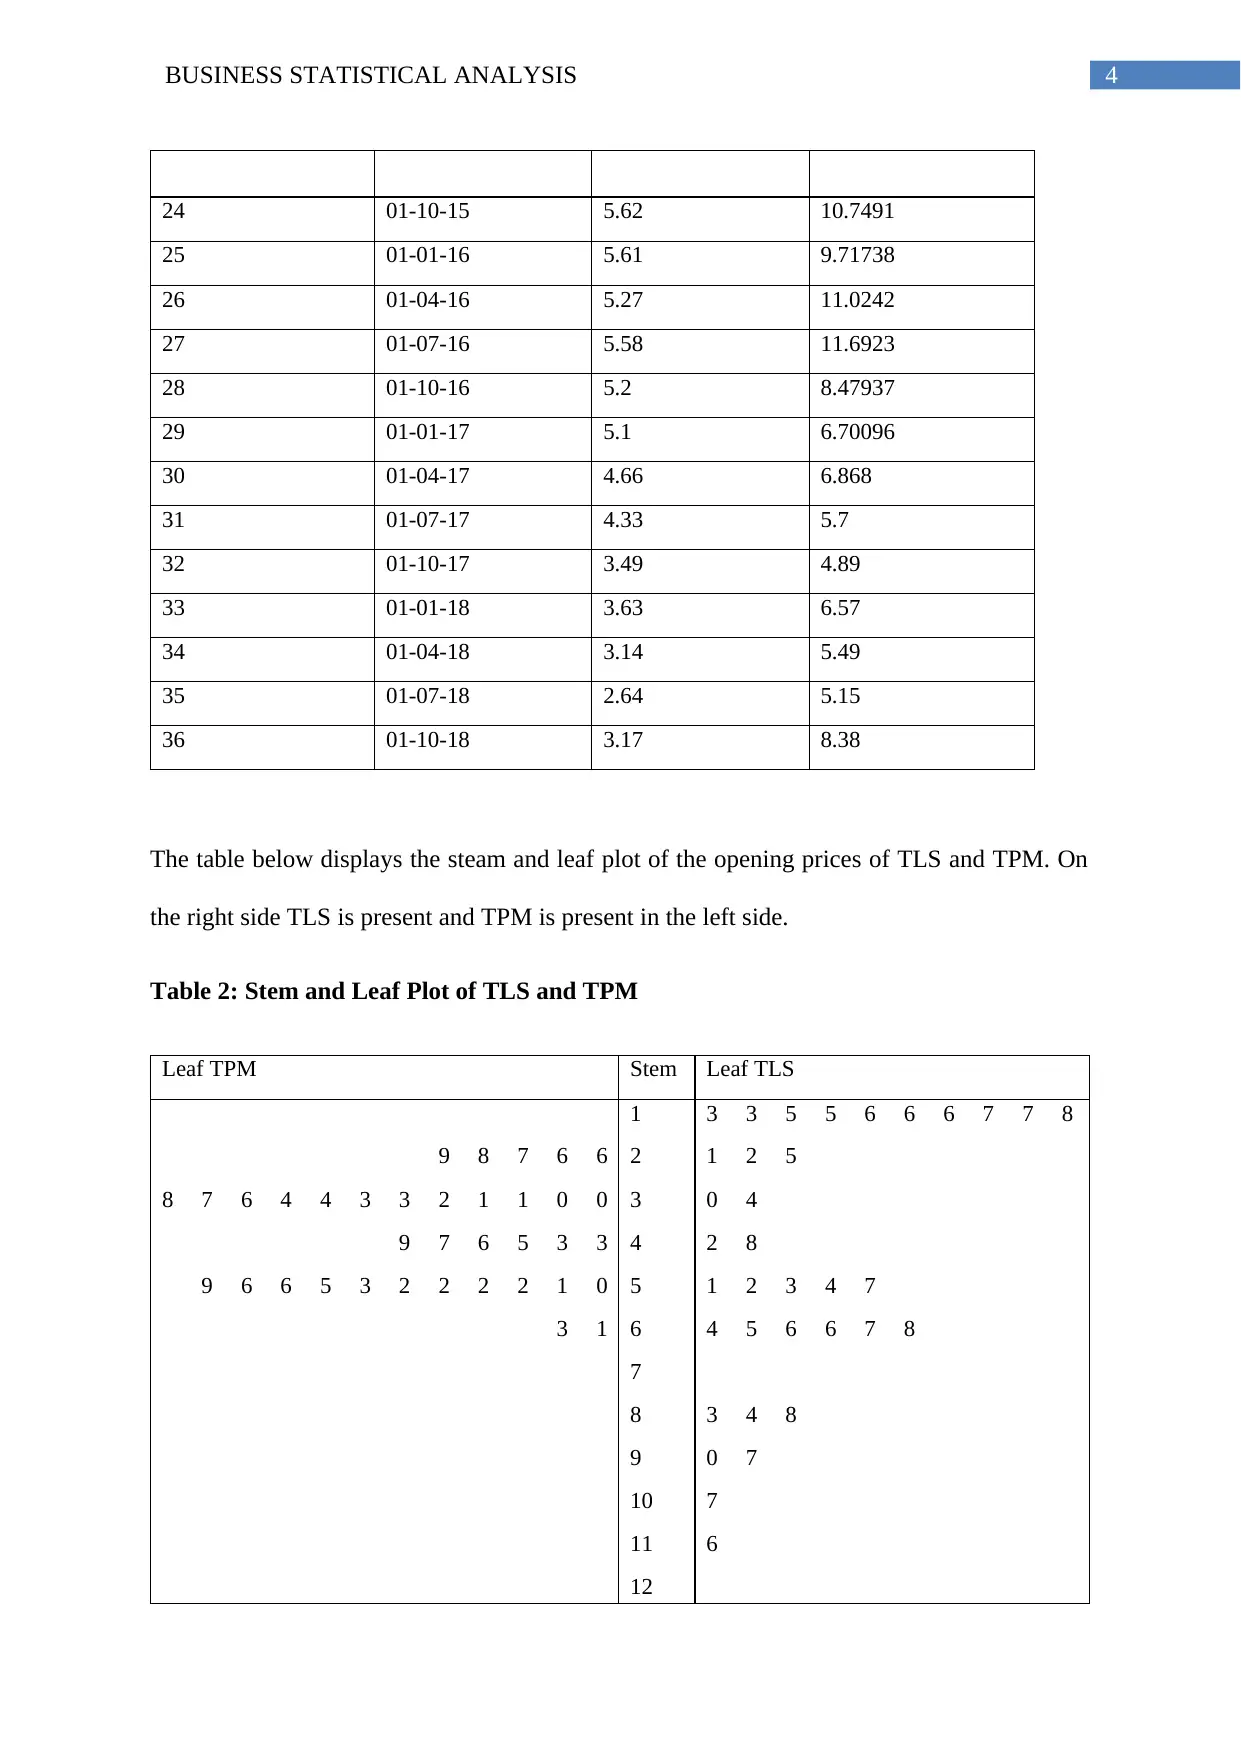
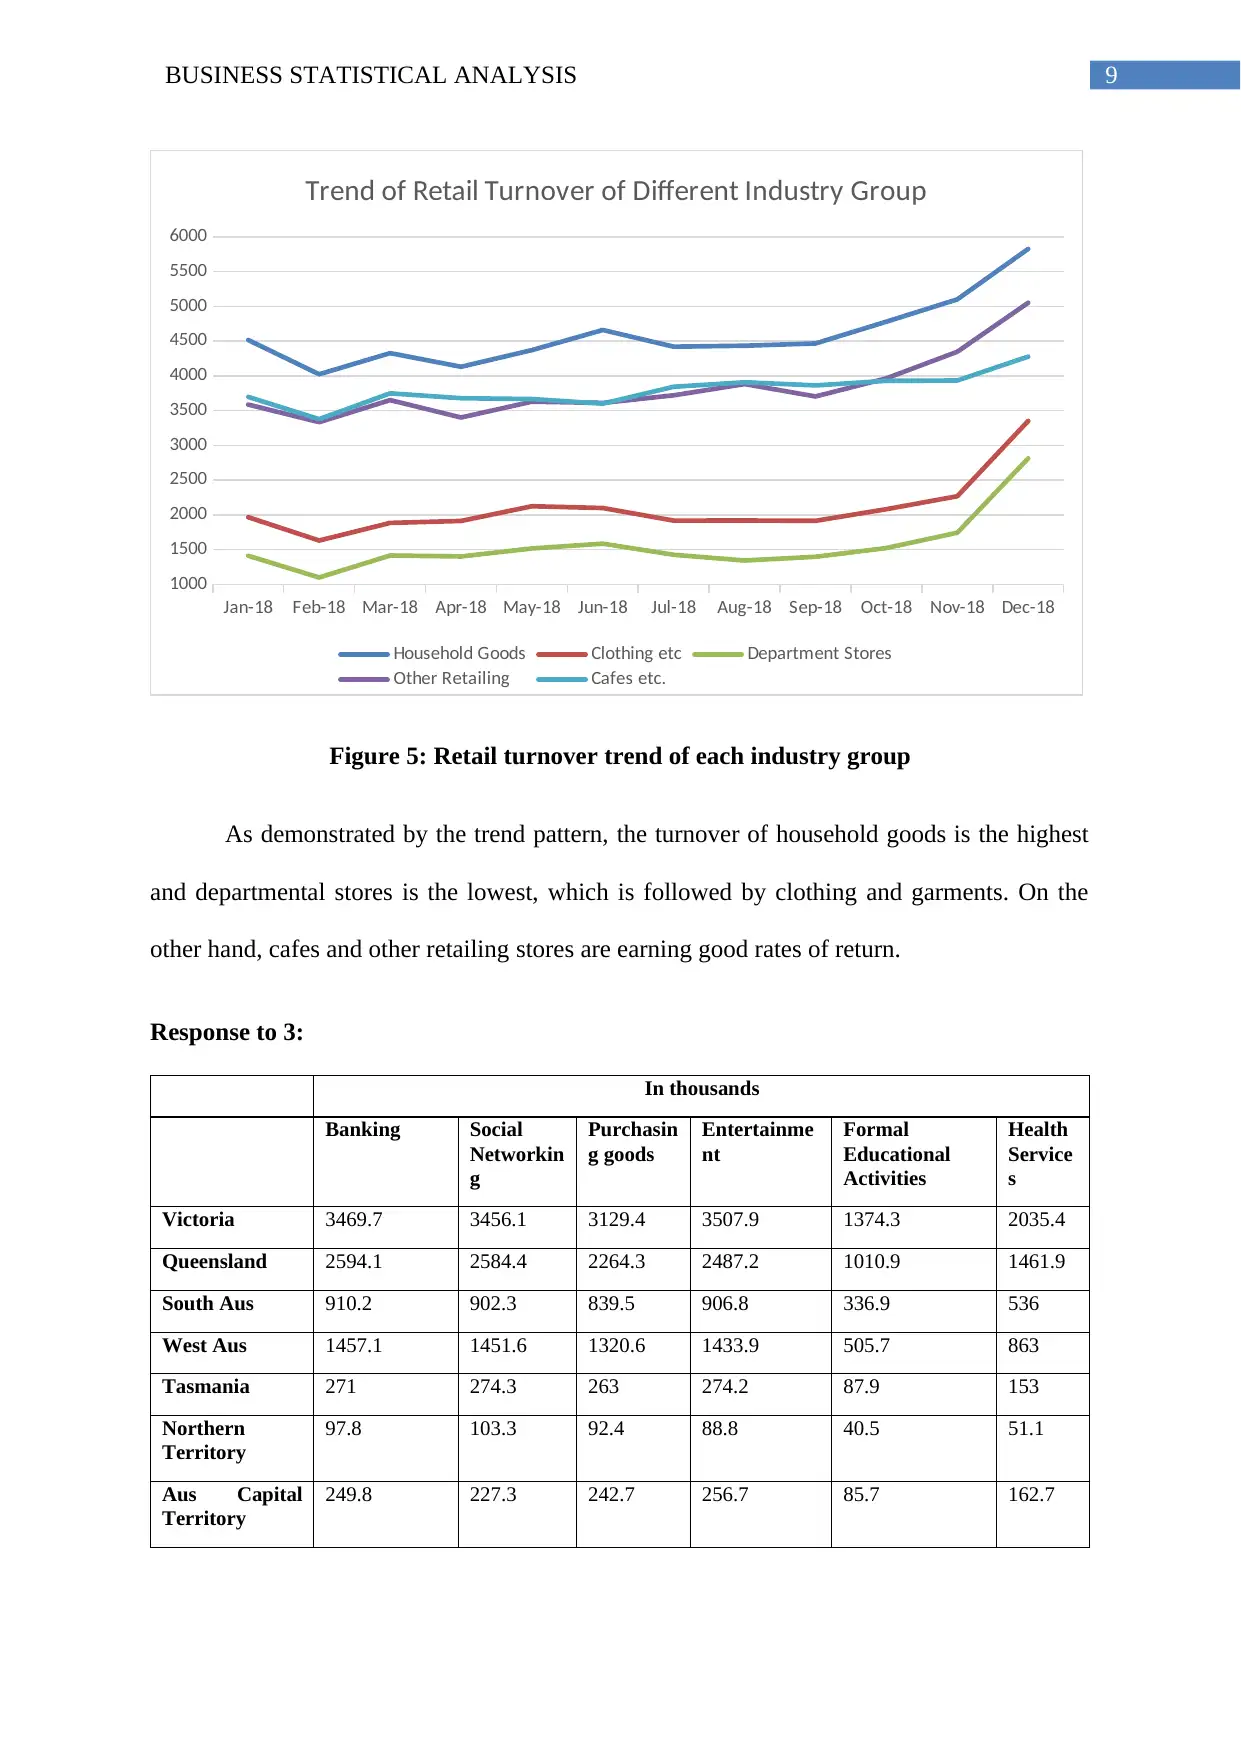
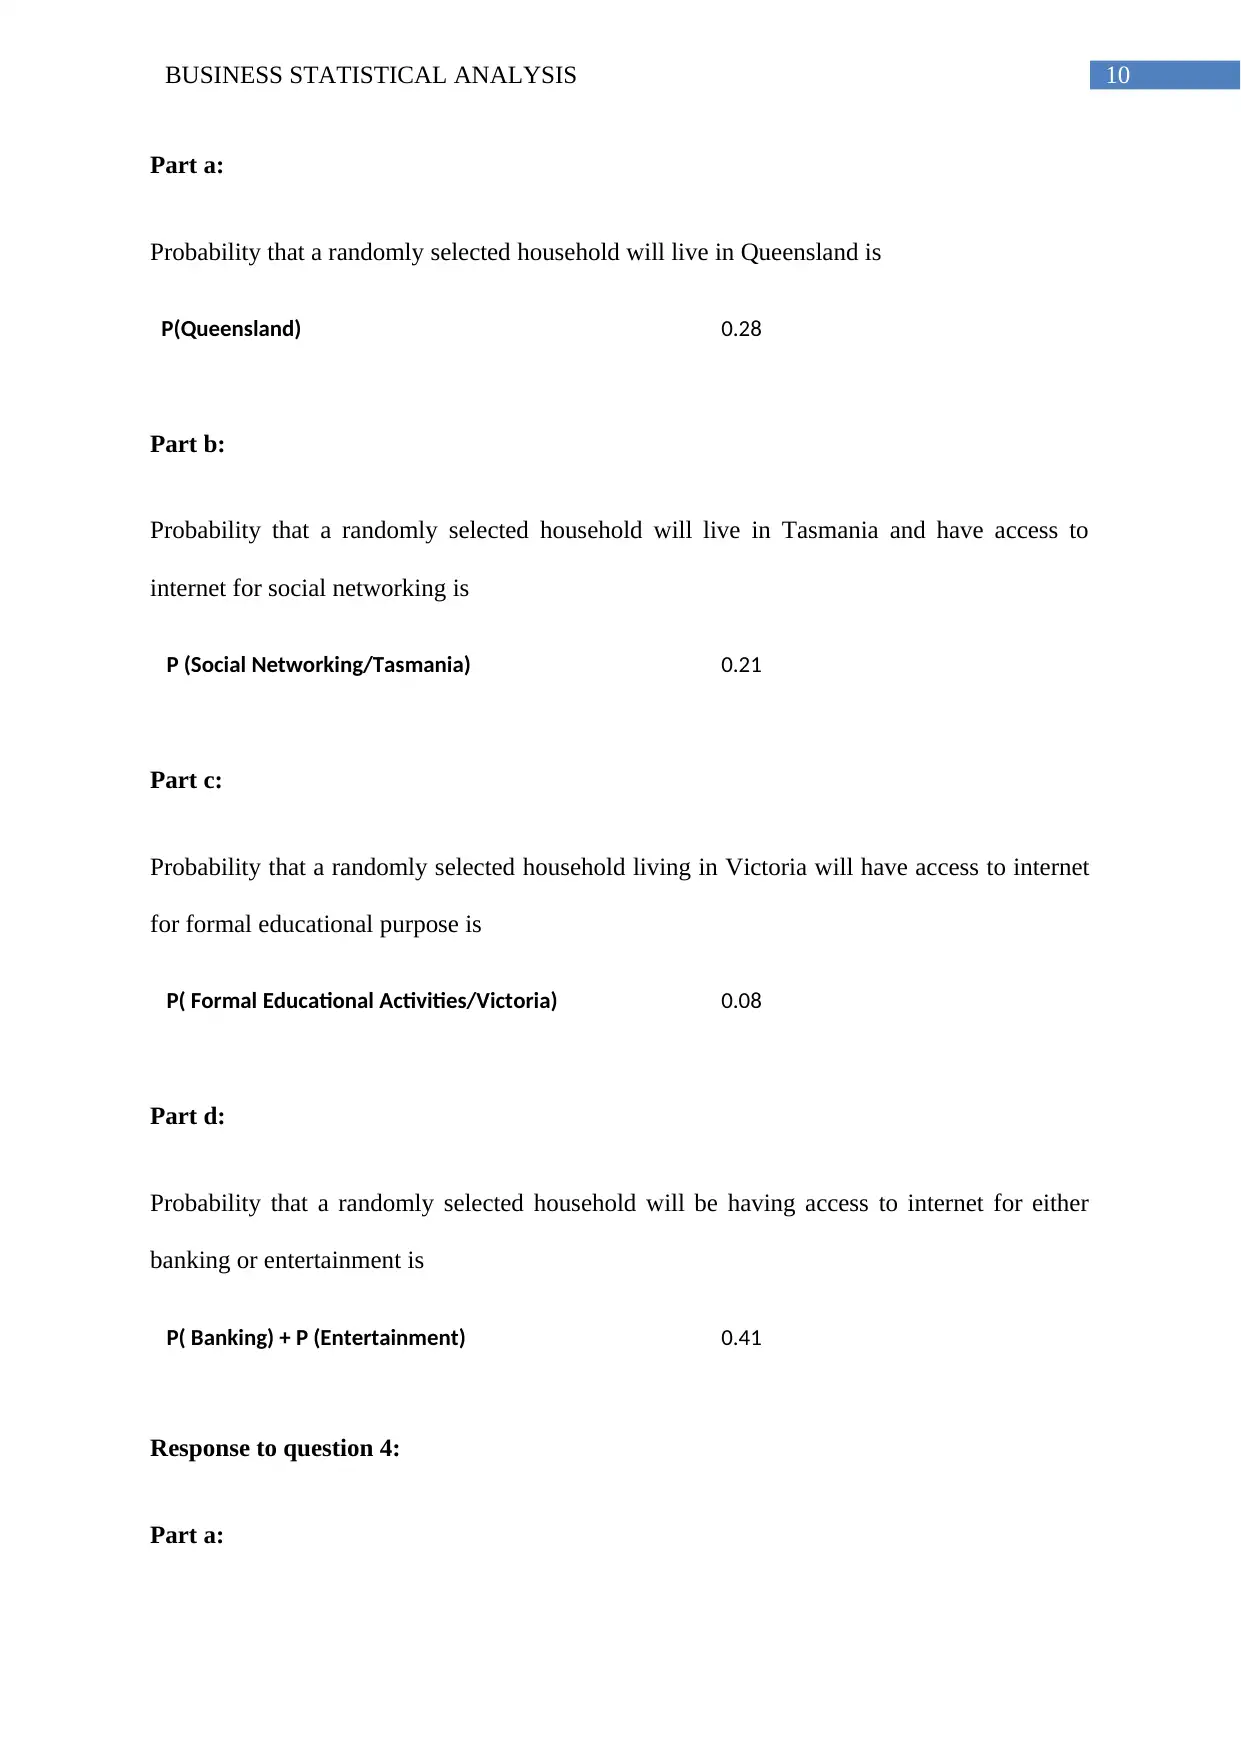
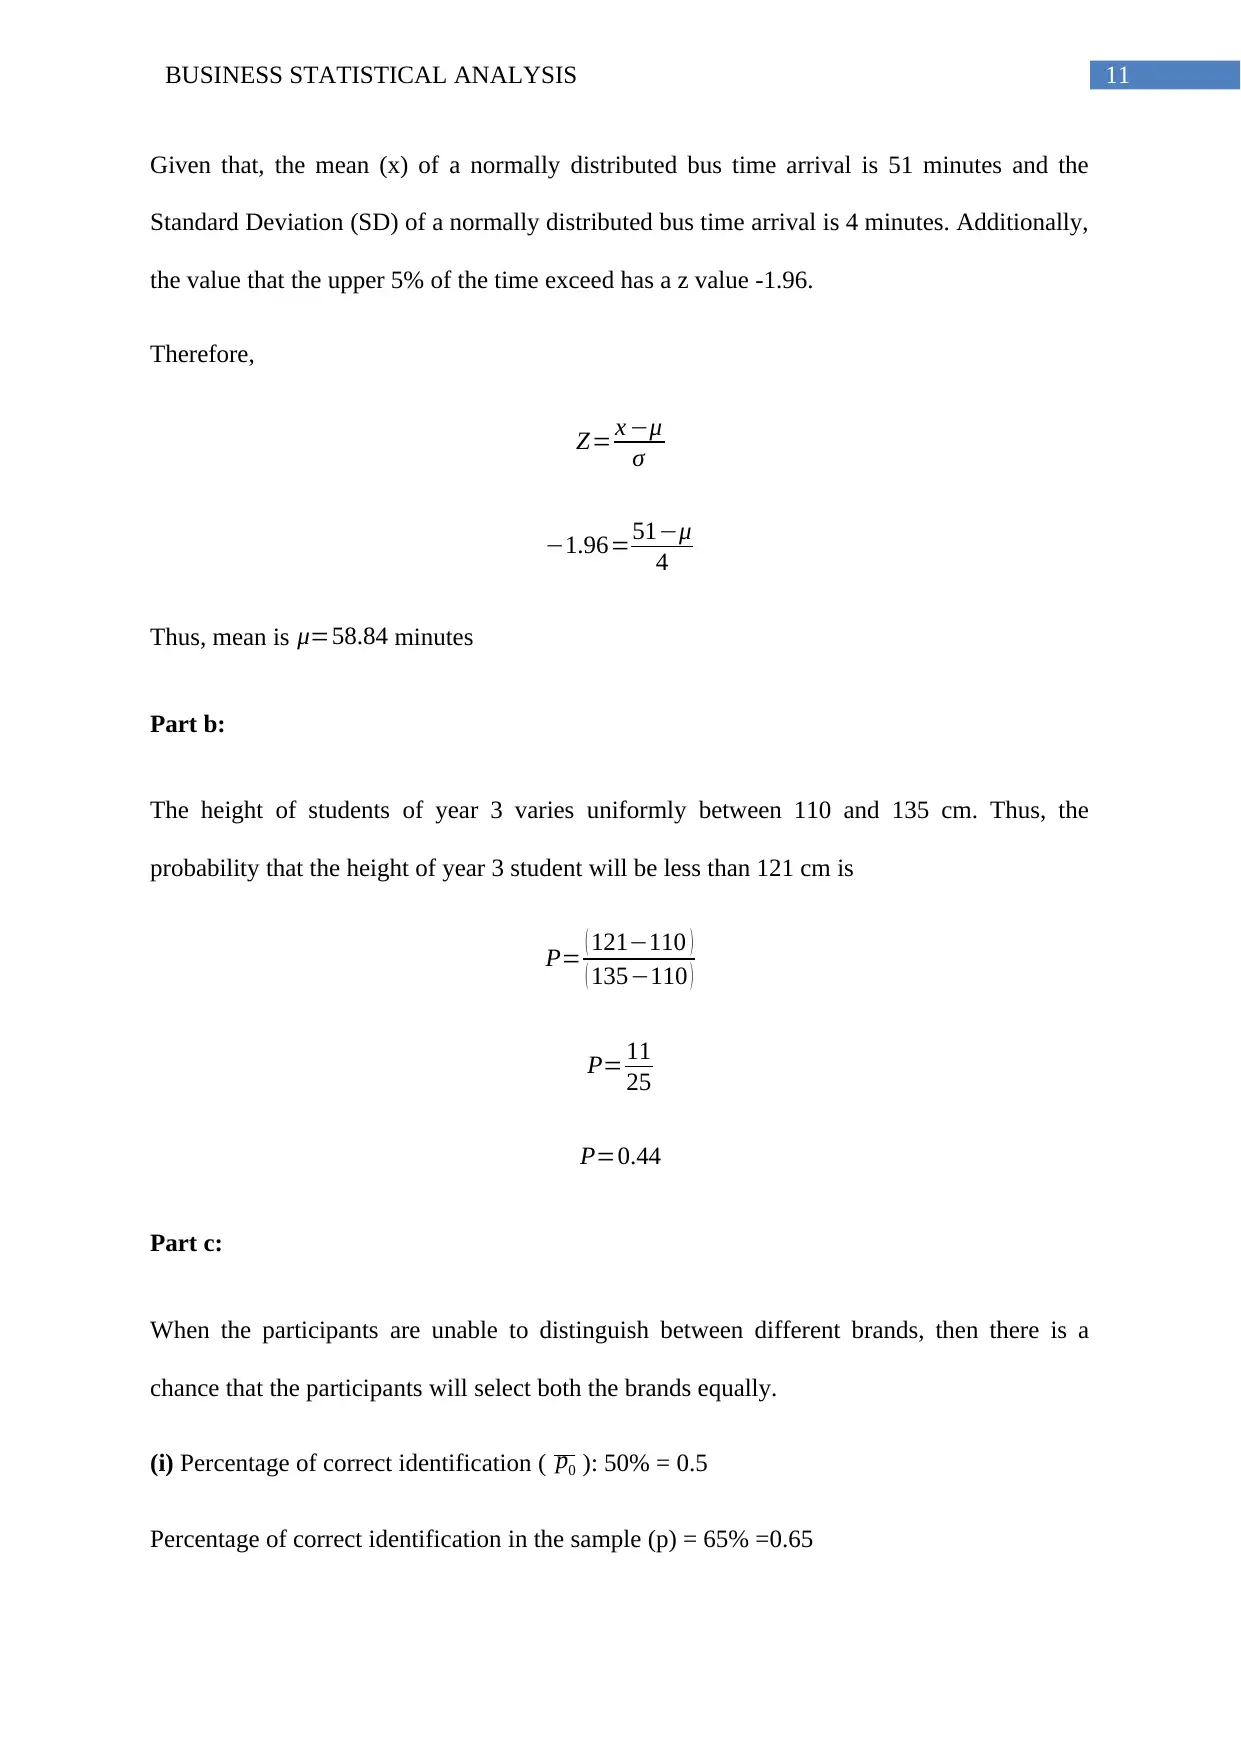
This business statistics assignment presents a comprehensive analysis of data related to the telecommunications and retail industries. It begins with an examination of quarterly opening prices for Telstra Corporation Limited (TLS) and TPG Telecom Limited (TPM), utilizing stem and leaf plots, relative frequency tables, and graphical comparisons to illustrate market trends. The assignment then delves into market capitalization data within the telecommunication sector and the trend of returns for TLS and TPM. Following this, the document analyzes retail industry turnover, employing measures such as mean, standard deviation, median, quartiles, and box-and-whisker plots to compare different retail groups. The assignment also explores probability concepts through scenarios involving internet access for various activities across different regions and hypothesis testing related to student populations and flight booking cancellations. Furthermore, the document addresses confidence intervals and sampling distributions to provide a complete statistical analysis.

Running head: BUSINESS STATISTICAL ANALYSIS
BUSINESS STATISTICAL ANALYSIS
Name of the Student
Name of the University
Author Note
Course ID:
BUSINESS STATISTICAL ANALYSIS
Name of the Student
Name of the University
Author Note
Course ID:
Paraphrase This Document
Need a fresh take? Get an instant paraphrase of this document with our AI Paraphraser

1BUSINESS STATISTICAL ANALYSIS
Table of Contents
Response to question-1:.............................................................................................................3
Part a:.....................................................................................................................................3
Part b:.....................................................................................................................................5
Part c:.....................................................................................................................................5
Part d:.....................................................................................................................................6
Response to question 2:..............................................................................................................7
Part a:.....................................................................................................................................7
Part b:.....................................................................................................................................7
Part c:.....................................................................................................................................8
Part d:.....................................................................................................................................8
Response to 3:............................................................................................................................9
Part a:...................................................................................................................................10
Part b:...................................................................................................................................10
Part c:...................................................................................................................................10
Part d:...................................................................................................................................10
Response to question 4:............................................................................................................10
Part a:...................................................................................................................................10
Part b:...................................................................................................................................11
Part c:...................................................................................................................................11
Response to question 5:............................................................................................................12

2BUSINESS STATISTICAL ANALYSIS
Part a:...................................................................................................................................12
Part b:...................................................................................................................................13
Part c:...................................................................................................................................14
Bibliography.............................................................................................................................15
⊘ This is a preview!⊘
Do you want full access?
Subscribe today to unlock all pages.

Trusted by 1+ million students worldwide

3BUSINESS STATISTICAL ANALYSIS
Response to question-1:
Part a:
The table provides quarterly opening prices of Telstra Corporation Limited (TLS) and TPG
Telecom Limited (TPM) from January 2010 to December 2018.
Table 1: Quarterly opening prices of TLS and TPM
SL.NO. Date TPM TLS
1 01-01-10 3.44 1.63594
2 01-04-10 3.01 2.26968
3 01-07-10 3.23 1.86192
4 01-10-10 2.64 1.50821
5 01-01-11 2.79 1.58681
6 01-04-11 2.82 1.65068
7 01-07-11 2.91 1.65559
8 01-10-11 3.08 1.35591
9 01-01-12 3.33 1.30679
10 01-04-12 3.3 1.75876
11 01-07-12 3.7 1.72928
12 01-10-12 3.89 2.19108
13 01-01-13 4.37 2.54479
14 01-04-13 4.51 3.09502
15 01-07-13 4.76 3.43891
16 01-10-13 4.97 4.27408
17 01-01-14 5.25 5.22714
18 01-04-14 5.07 6.42585
19 01-07-14 5.23 5.39418
20 01-10-14 5.31 6.66166
21 01-01-15 5.97 6.63219
22 01-04-15 6.32 9.0689
23 01-07-15 6.12 8.80361
Paraphrase This Document
Need a fresh take? Get an instant paraphrase of this document with our AI Paraphraser

4BUSINESS STATISTICAL ANALYSIS
24 01-10-15 5.62 10.7491
25 01-01-16 5.61 9.71738
26 01-04-16 5.27 11.0242
27 01-07-16 5.58 11.6923
28 01-10-16 5.2 8.47937
29 01-01-17 5.1 6.70096
30 01-04-17 4.66 6.868
31 01-07-17 4.33 5.7
32 01-10-17 3.49 4.89
33 01-01-18 3.63 6.57
34 01-04-18 3.14 5.49
35 01-07-18 2.64 5.15
36 01-10-18 3.17 8.38
The table below displays the steam and leaf plot of the opening prices of TLS and TPM. On
the right side TLS is present and TPM is present in the left side.
Table 2: Stem and Leaf Plot of TLS and TPM
Leaf TPM Stem Leaf TLS
1 3 3 5 5 6 6 6 7 7 8
9 8 7 6 6 2 1 2 5
8 7 6 4 4 3 3 2 1 1 0 0 3 0 4
9 7 6 5 3 3 4 2 8
9 6 6 5 3 2 2 2 2 1 0 5 1 2 3 4 7
3 1 6 4 5 6 6 7 8
7
8 3 4 8
9 0 7
10 7
11 6
12

5BUSINESS STATISTICAL ANALYSIS
Part b:
Table 3: The relative frequency of price of TLS and TPM
Relative Frequency
Class Width TPM TLS
Less than 2 0.00 0.28
2 to 4 0.47 0.14
4 to 6 0.47 0.19
6 to 8 0.06 0.17
8 to 10 0.00 0.14
10 to 12 0.00 0.08
12 to 14 0.00 0.00
Less than 2 2 to 4 4 to 6 6 to 8 8 to 10 10 to 12 12 to 14
0.00
0.05
0.10
0.15
0.20
0.25
0.30
0.35
0.40
0.45
0.50
Comparison between TLS and TPM
TLS TPM
Class Interval
Cumulative Frequency
Figure 1: Comparison between frequency of prices of TLS and TPM
Part c:
⊘ This is a preview!⊘
Do you want full access?
Subscribe today to unlock all pages.

Trusted by 1+ million students worldwide

6BUSINESS STATISTICAL ANALYSIS
Table 4: Market capitalisation of Telecommunication Industry Listed in ASX
Name of the Organisation Market Capitalisation (M)
Chorus Limited Foreign Exempt (CNU) 2609.01
Spark New Zealand Foreign Exempt (SPK) 7531.88
Telstra Corporation Limited (TLS) 42102.3
TPG Telecom Limited (TPM) 6225.62
Vocus Group Limited (VOC) 1774.83
CNU SPK TLS TPM VOC
0
5000
10000
15000
20000
25000
30000
35000
40000
45000
Market Capitalisation (M)
Market Capitalisation in Million AUD
Name of the Organisation
Figure 2: Comparison of market capitalisation in the Telecommunication industry of
Australia
Part d:
Paraphrase This Document
Need a fresh take? Get an instant paraphrase of this document with our AI Paraphraser

7BUSINESS STATISTICAL ANALYSIS
1/1/2010
5/1/2010
9/1/2010
1/1/2011
5/1/2011
9/1/2011
1/1/2012
5/1/2012
9/1/2012
1/1/2013
5/1/2013
9/1/2013
1/1/2014
5/1/2014
9/1/2014
1/1/2015
5/1/2015
9/1/2015
1/1/2016
5/1/2016
9/1/2016
1/1/2017
5/1/2017
9/1/2017
1/1/2018
5/1/2018
9/1/2018
-0.4
-0.2
0
0.2
0.4
0.6
0.8
Trend of return of TLS and TPM
TLS TPM
Figure 3: Trend of return of TLS and TPM
On analysing the trend or pattern of return of both the organisation, this can be implied that it
is profitable to invest in TPM. This is because of the higher return generated from TPM.
Response to question 2:
Part a:
Table 5: The mean and standard deviation of retail industry group
Household Goods Clothing
etc
Department
Stores
Other
Retailin
g
Cafes
etc.
MEAN 4588.2 2089.78 1557.43 3824.24 3794.2
3
STANDARD
DEVIATION
481.59 427.70 424.15 468.80 222.43
Part b:

8BUSINESS STATISTICAL ANALYSIS
Table 6: Table representing Median, minimum, maximum, first quartile and third quartile of
the industry group
Household Goods Clothing
etc
Department
Stores
Other
Retailin
g
Cafes
etc.
Median 4451.3 1943.45 1421.45 3678.3 3796.55
Minimum 4023.6 1632.2 1099.4 3334.5 3377.8
Maximum 5826.5 3351.8 2813.5 5053.1 4278.9
First Quartile 4360 1914.85 1401.725 3605.6 3676.12
5
Third Quartile 4689.675 2105.45 1540.4 3902.975 3913.5
Part c:
Household Goods Clothing etc Department Stores Other Retailing Cafes etc.
1000
1500
2000
2500
3000
3500
4000
4500
5000
Comparison of Retail Turover
Retail Stores
Figure 4: Comparison of retain turnover of each industry using a box and Whisker's
plot
Part d:
⊘ This is a preview!⊘
Do you want full access?
Subscribe today to unlock all pages.

Trusted by 1+ million students worldwide

9BUSINESS STATISTICAL ANALYSIS
Jan-18 Feb-18 Mar-18 Apr-18 May-18 Jun-18 Jul-18 Aug-18 Sep-18 Oct-18 Nov-18 Dec-18
1000
1500
2000
2500
3000
3500
4000
4500
5000
5500
6000
Trend of Retail Turnover of Different Industry Group
Household Goods Clothing etc Department Stores
Other Retailing Cafes etc.
Figure 5: Retail turnover trend of each industry group
As demonstrated by the trend pattern, the turnover of household goods is the highest
and departmental stores is the lowest, which is followed by clothing and garments. On the
other hand, cafes and other retailing stores are earning good rates of return.
Response to 3:
In thousands
Banking Social
Networkin
g
Purchasin
g goods
Entertainme
nt
Formal
Educational
Activities
Health
Service
s
Victoria 3469.7 3456.1 3129.4 3507.9 1374.3 2035.4
Queensland 2594.1 2584.4 2264.3 2487.2 1010.9 1461.9
South Aus 910.2 902.3 839.5 906.8 336.9 536
West Aus 1457.1 1451.6 1320.6 1433.9 505.7 863
Tasmania 271 274.3 263 274.2 87.9 153
Northern
Territory
97.8 103.3 92.4 88.8 40.5 51.1
Aus Capital
Territory
249.8 227.3 242.7 256.7 85.7 162.7
Paraphrase This Document
Need a fresh take? Get an instant paraphrase of this document with our AI Paraphraser

10BUSINESS STATISTICAL ANALYSIS
Part a:
Probability that a randomly selected household will live in Queensland is
P(Queensland) 0.28
Part b:
Probability that a randomly selected household will live in Tasmania and have access to
internet for social networking is
P (Social Networking/Tasmania) 0.21
Part c:
Probability that a randomly selected household living in Victoria will have access to internet
for formal educational purpose is
P( Formal Educational Activities/Victoria) 0.08
Part d:
Probability that a randomly selected household will be having access to internet for either
banking or entertainment is
P( Banking) + P (Entertainment) 0.41
Response to question 4:
Part a:
Part a:
Probability that a randomly selected household will live in Queensland is
P(Queensland) 0.28
Part b:
Probability that a randomly selected household will live in Tasmania and have access to
internet for social networking is
P (Social Networking/Tasmania) 0.21
Part c:
Probability that a randomly selected household living in Victoria will have access to internet
for formal educational purpose is
P( Formal Educational Activities/Victoria) 0.08
Part d:
Probability that a randomly selected household will be having access to internet for either
banking or entertainment is
P( Banking) + P (Entertainment) 0.41
Response to question 4:
Part a:

11BUSINESS STATISTICAL ANALYSIS
Given that, the mean (x) of a normally distributed bus time arrival is 51 minutes and the
Standard Deviation (SD) of a normally distributed bus time arrival is 4 minutes. Additionally,
the value that the upper 5% of the time exceed has a z value -1.96.
Therefore,
Z= x −μ
σ
−1.96=51−μ
4
Thus, mean is μ=58.84 minutes
Part b:
The height of students of year 3 varies uniformly between 110 and 135 cm. Thus, the
probability that the height of year 3 student will be less than 121 cm is
P= ( 121−110 )
( 135−110 )
P= 11
25
P=0.44
Part c:
When the participants are unable to distinguish between different brands, then there is a
chance that the participants will select both the brands equally.
(i) Percentage of correct identification ( p0 ): 50% = 0.5
Percentage of correct identification in the sample (p) = 65% =0.65
⊘ This is a preview!⊘
Do you want full access?
Subscribe today to unlock all pages.

Trusted by 1+ million students worldwide
1 out of 16
Related Documents

Your All-in-One AI-Powered Toolkit for Academic Success.
+13062052269
info@desklib.com
Available 24*7 on WhatsApp / Email
Unlock your academic potential
Copyright © 2020–2025 A2Z Services. All Rights Reserved. Developed and managed by ZUCOL.