MA508 Business Statistics: Analyzing Customer & Sales Data Report
VerifiedAdded on 2023/06/08
|10
|1238
|177
Homework Assignment
AI Summary
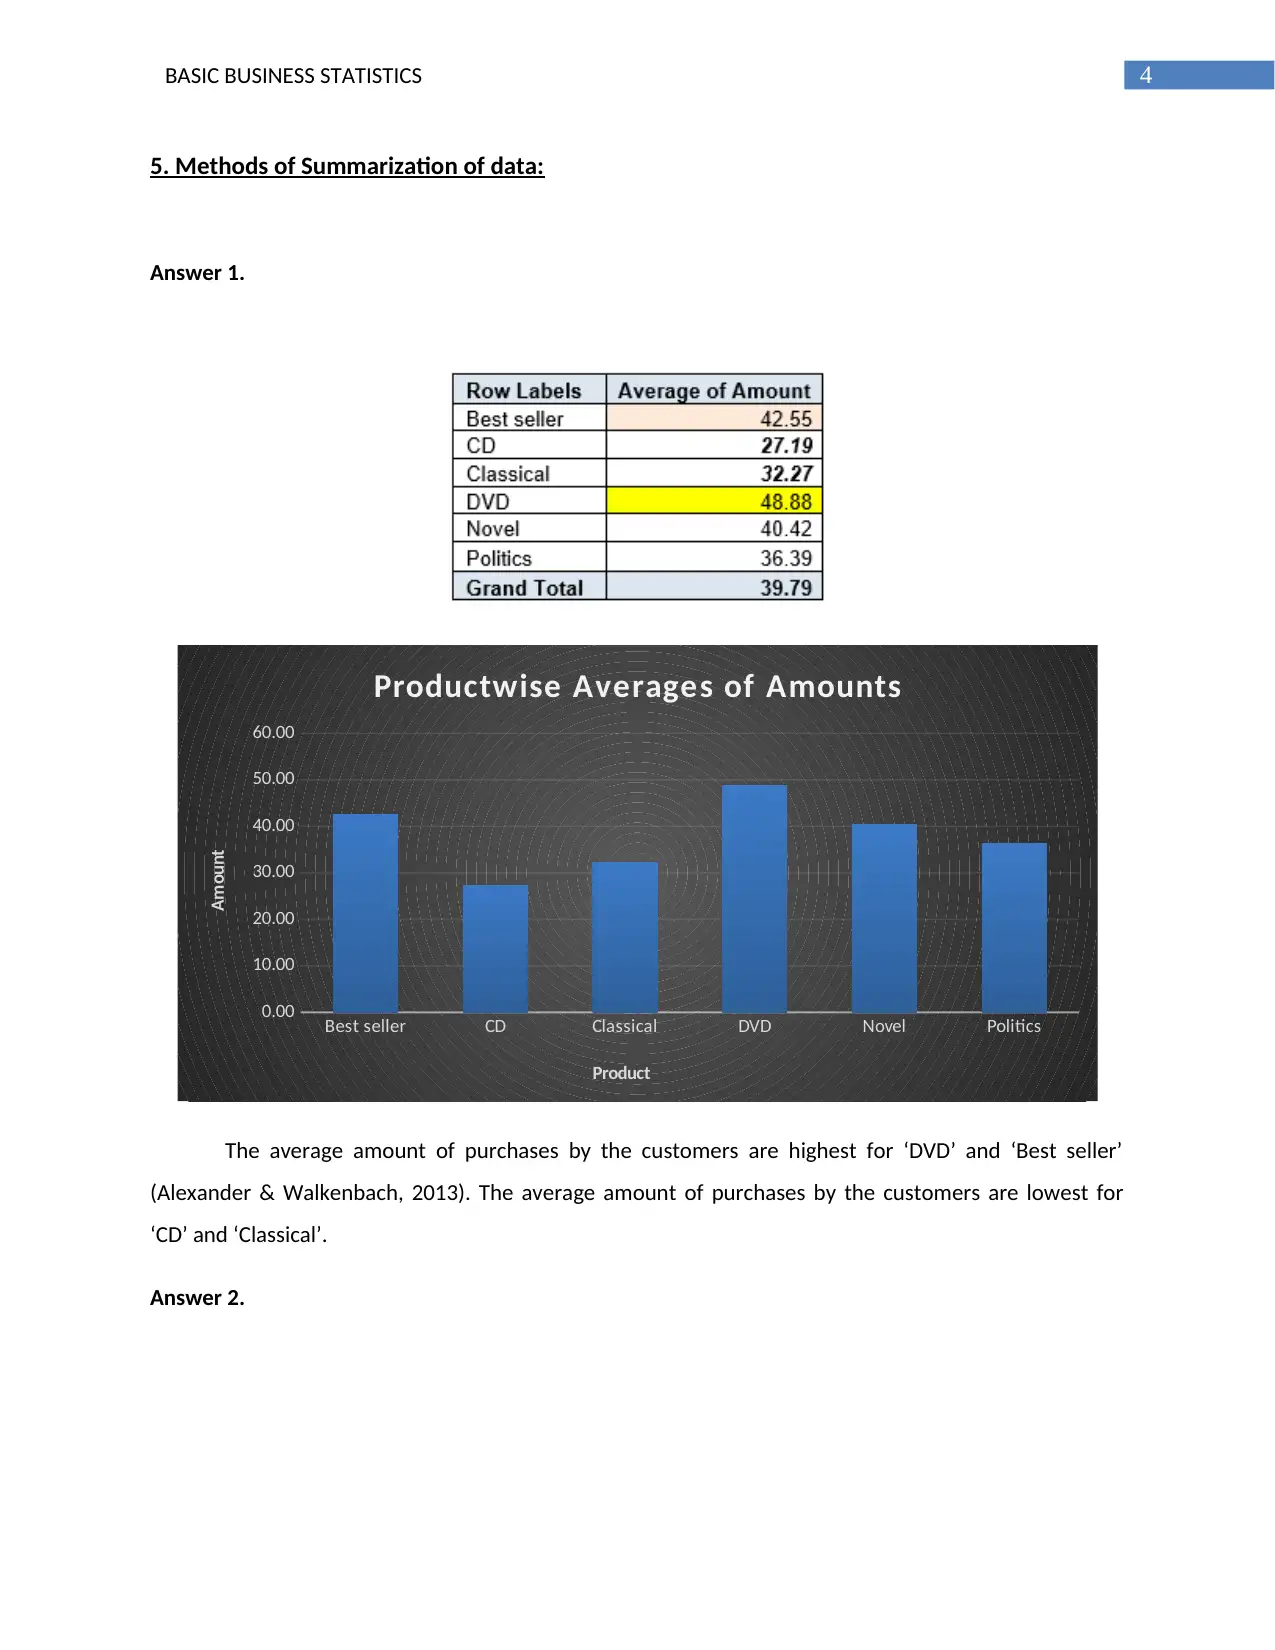
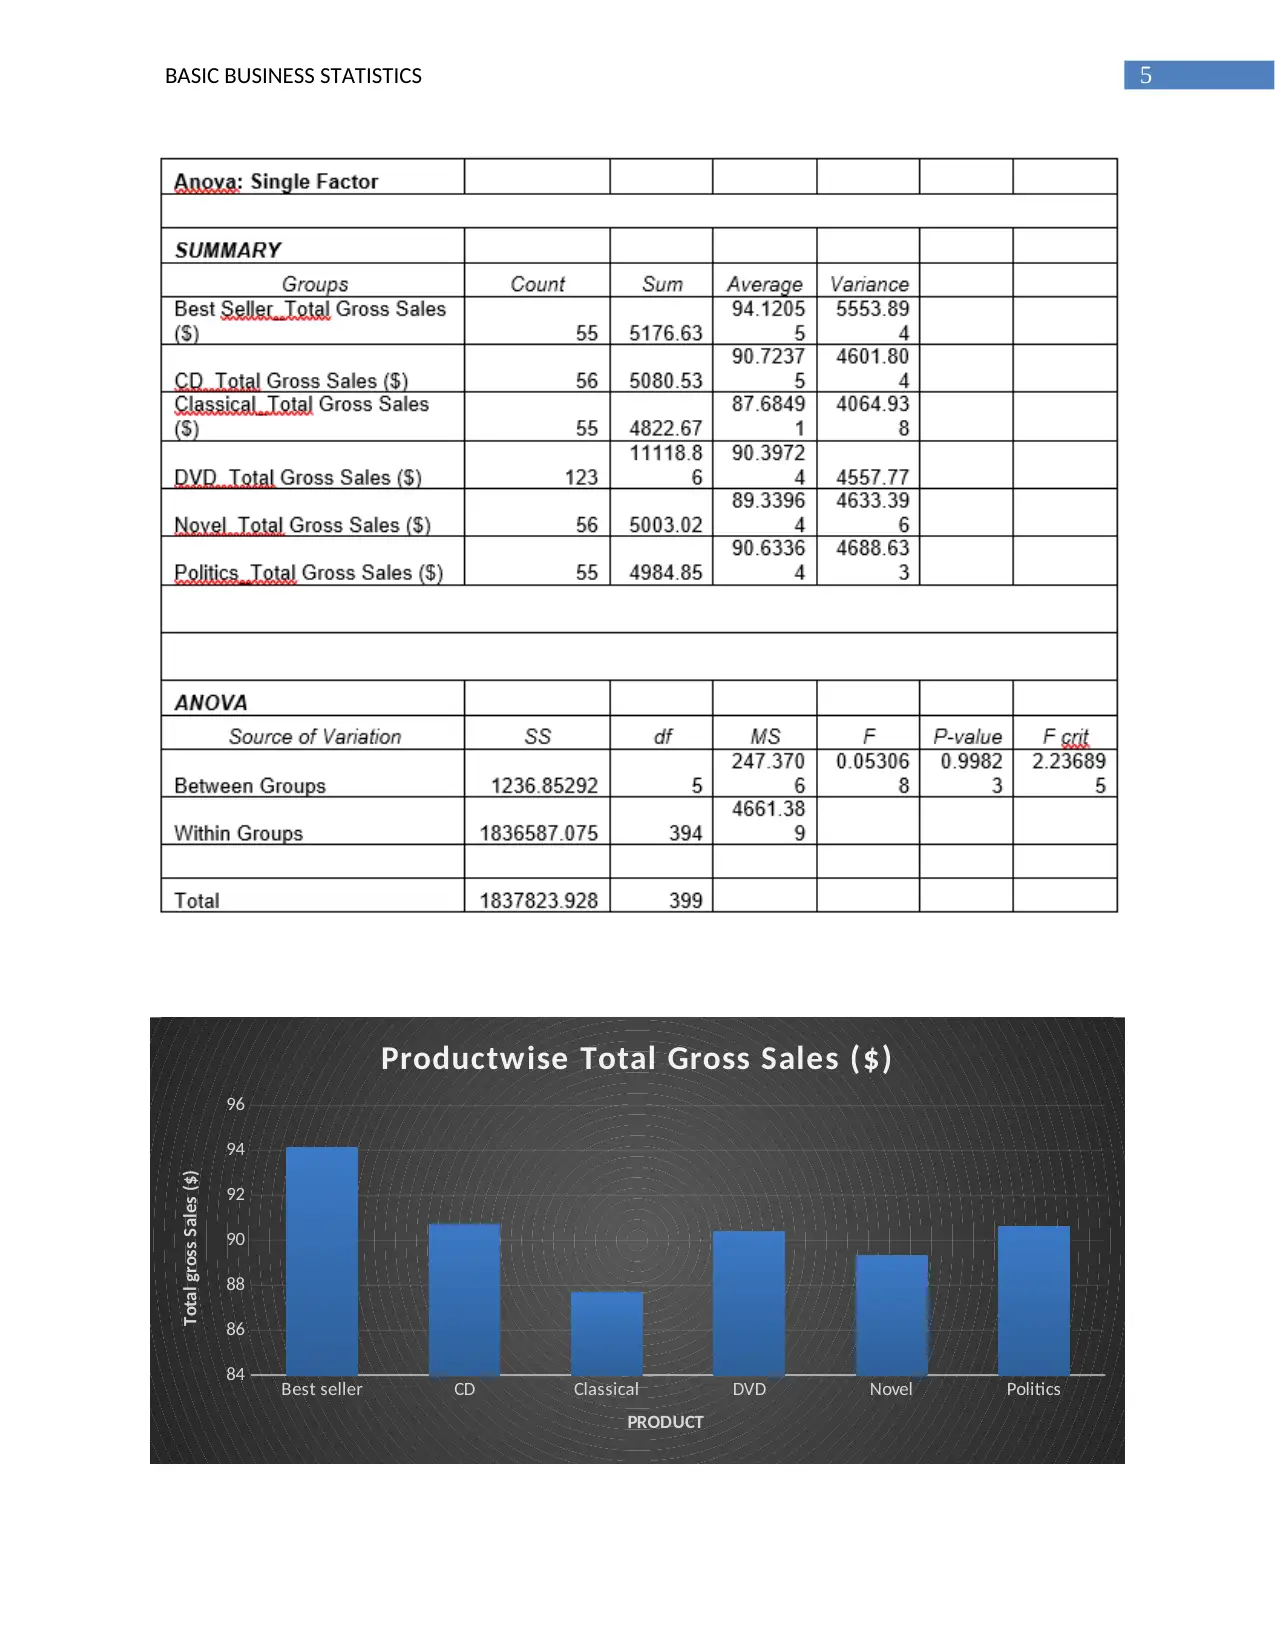
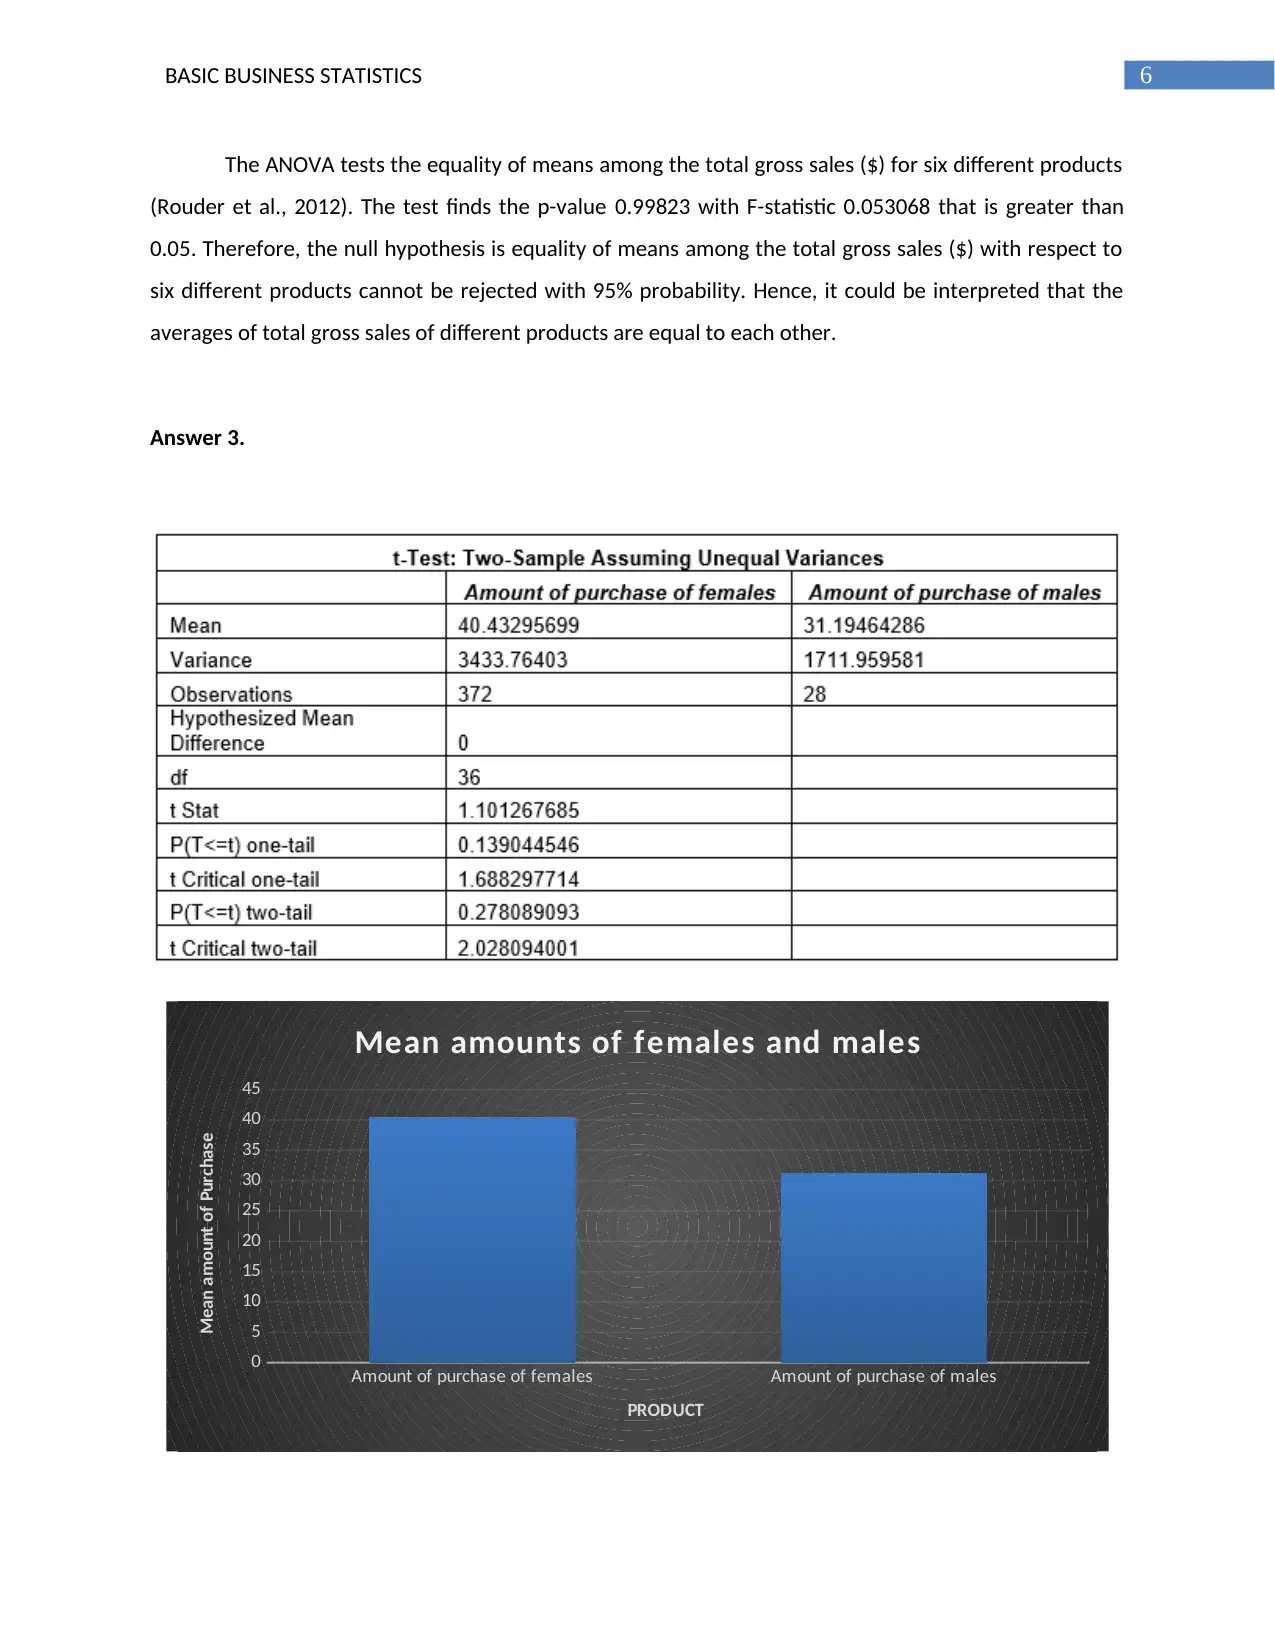
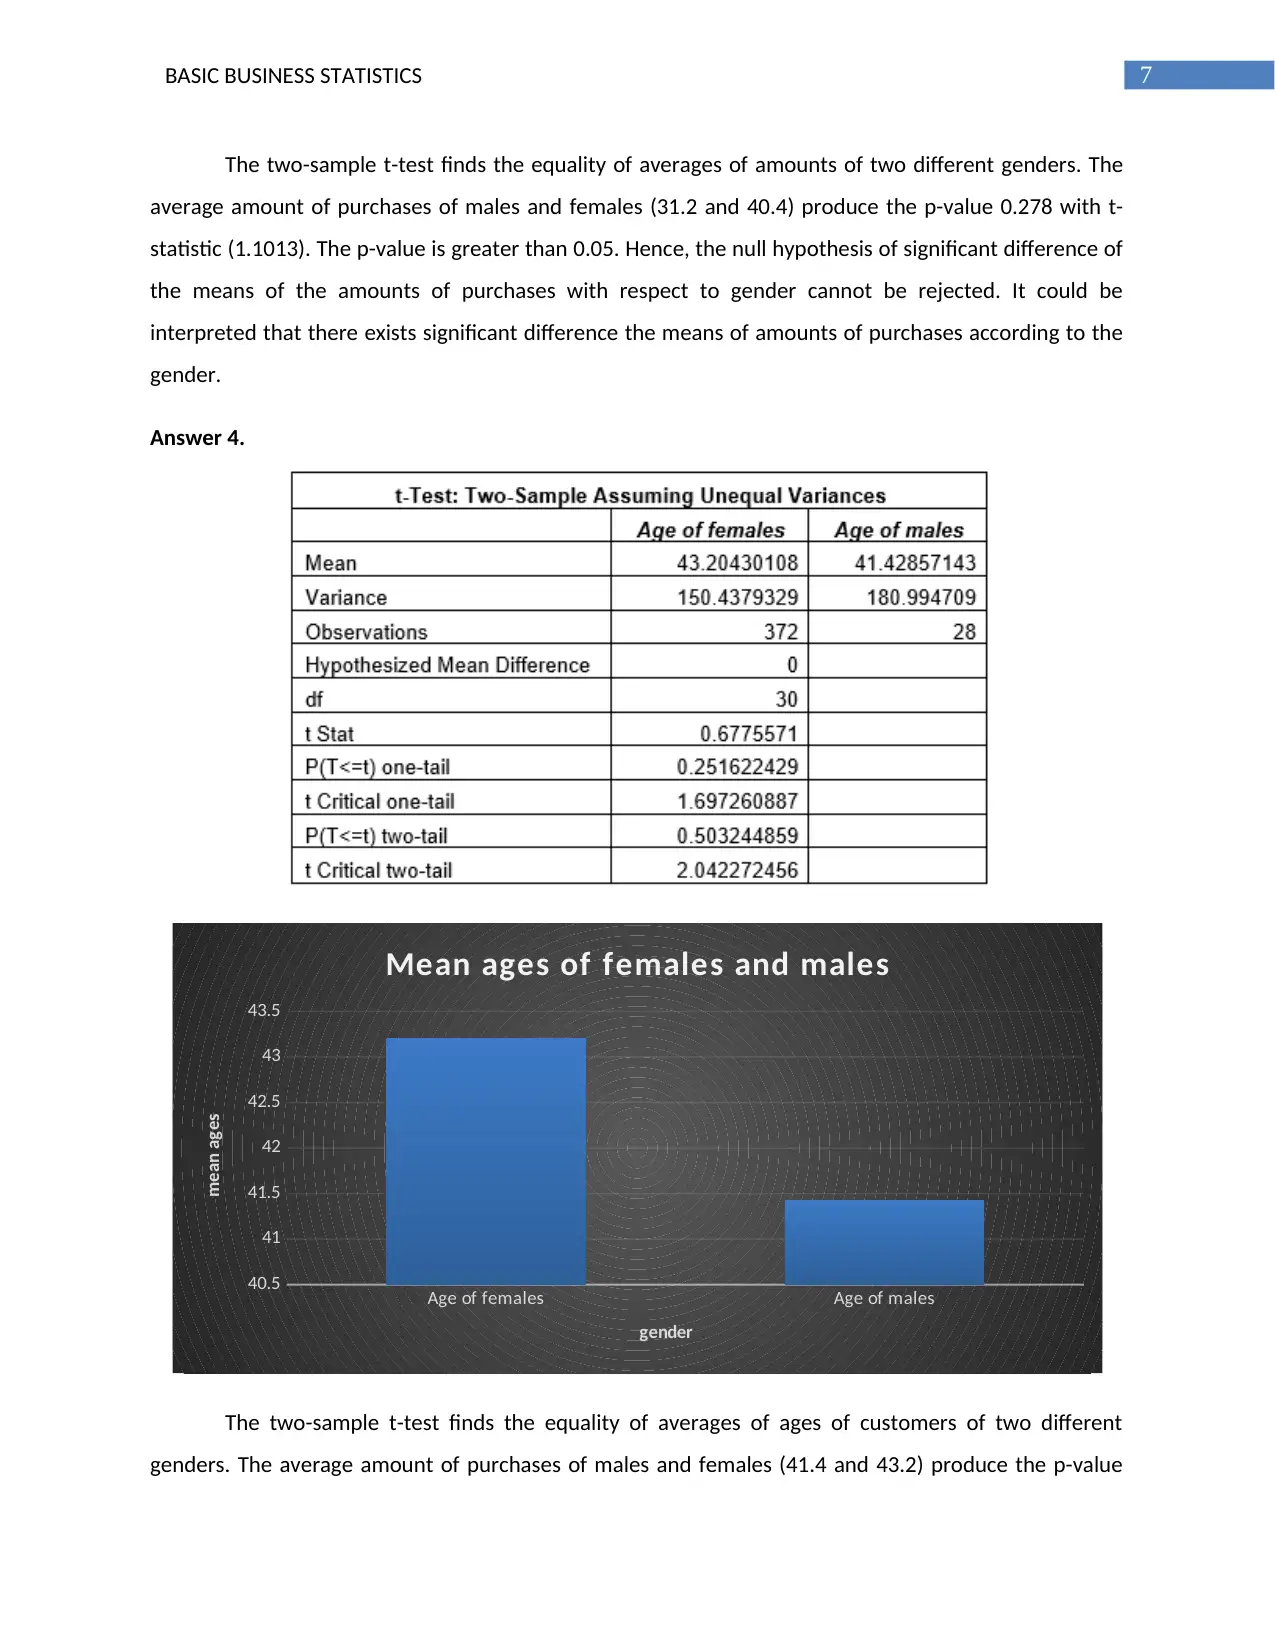
This assignment is a data analysis report based on business statistics, utilizing data from a 'Global corporation' selling electronic products and books. It identifies key business problems such as determining best and worst-selling product categories, analyzing differences in gross sales among product categories, and examining purchase amounts and age differences based on gender. The analysis employs descriptive statistics, including measures of location and variation, and uses methods like ANOVA and t-tests to summarize data. The findings reveal insights into product performance and customer demographics, leading to recommendations for enhancing business by focusing on high-demand products like DVDs and bestsellers. Desklib offers a wealth of similar solved assignments and past papers for students.

Running Head: BASIC BUSINESS STATISTICS
Basic Business Statistics
Name of the student:
Name of the university:
Course ID:
Basic Business Statistics
Name of the student:
Name of the university:
Course ID:
Paraphrase This Document
Need a fresh take? Get an instant paraphrase of this document with our AI Paraphraser

1BASIC BUSINESS STATISTICS
Table of Contents
1. Introduction:............................................................................................................................................2
2. Problem definition and Business intelligence:.........................................................................................2
3. Types of data used and Measurement scales:.........................................................................................2
4. Descriptive Statistics:...............................................................................................................................3
4.1. Measures of Location:......................................................................................................................3
4.2. Measures of Variation:.....................................................................................................................3
5. Methods of Summarization of data:........................................................................................................4
Answer 1..................................................................................................................................................4
Answer 2..................................................................................................................................................4
Answer 3..................................................................................................................................................6
Answer 4..................................................................................................................................................7
6. Results and Recommendations:..............................................................................................................8
References:..................................................................................................................................................9

2BASIC BUSINESS STATISTICS
1. Introduction:
The data analysis report is based on business statistics, theory, concepts, tools and terminology
for analyzing data. The provided secondary data is ABZ-Customer and sales data retrieved from a ‘Global
corporation’. The undertaken business sells different categories of electronic products such as CD, DVD
and books like Classical, Novel, Politics and bestsellers. The report highlights different business problems
and generates the way-outs for better business opportunities.
2. Problem definition and Business intelligence:
The statistical theory and application discusses the main research questions meaningful to the
report. The research questions define the major challenges in the business. The reduction of these
challenges causes more profitability and increment in sales. The major business problems are-
To find the best and worst selling product categories.
To find the differences of total gross sales among product categories.
To find the differences of the purchase amount with respect to gender.
To find the differences of the age with respect to age.
3. Types of data used and Measurement scales:
The data set involves two types of data-sheet. The first data set includes the attributes of the
customers collected from an online survey. The second data set consists of some financial data. Most of
the variables in first data-sheet are categorical (nominal) in nature. All the variables in second data-
sheet are numerical. The analysis is absolutely quantitative. The numerical data is presented with
interval scale.
⊘ This is a preview!⊘
Do you want full access?
Subscribe today to unlock all pages.

Trusted by 1+ million students worldwide

3BASIC BUSINESS STATISTICS
4. Descriptive Statistics:
4.1. Measures of Location:
The descriptive statistics show the different measures of location (Measures of central tendency and
shape) of various financial data (Bickel & Lehmann, 2012).
Measures of central tendency: Mean, Median and Mode.
Measures of shape: Kurtosis and Skewness.
4.2. Measures of Variation:
The descriptive statistics indicate the different measures of variation (Measures of dispersion) also.
Measures of Variation: Standard deviation, Variance, Range.
Paraphrase This Document
Need a fresh take? Get an instant paraphrase of this document with our AI Paraphraser

4BASIC BUSINESS STATISTICS
5. Methods of Summarization of data:
Answer 1.
Best seller CD Classical DVD Novel Politics
0.00
10.00
20.00
30.00
40.00
50.00
60.00
Productwise Averages of Amounts
Product
Amount
The average amount of purchases by the customers are highest for ‘DVD’ and ‘Best seller’
(Alexander & Walkenbach, 2013). The average amount of purchases by the customers are lowest for
‘CD’ and ‘Classical’.
Answer 2.

5BASIC BUSINESS STATISTICS
Best seller CD Classical DVD Novel Politics
84
86
88
90
92
94
96
Productwise Total Gross Sales ($)
PRODUCT
Total gross Sales ($)
Best seller CD Classical DVD Novel Politics
84
86
88
90
92
94
96
Productwise Total Gross Sales ($)
PRODUCT
Total gross Sales ($)
⊘ This is a preview!⊘
Do you want full access?
Subscribe today to unlock all pages.

Trusted by 1+ million students worldwide

6BASIC BUSINESS STATISTICS
The ANOVA tests the equality of means among the total gross sales ($) for six different products
(Rouder et al., 2012). The test finds the p-value 0.99823 with F-statistic 0.053068 that is greater than
0.05. Therefore, the null hypothesis is equality of means among the total gross sales ($) with respect to
six different products cannot be rejected with 95% probability. Hence, it could be interpreted that the
averages of total gross sales of different products are equal to each other.
Answer 3.
Amount of purchase of females Amount of purchase of males
0
5
10
15
20
25
30
35
40
45
Mean amounts of females and males
PRODUCT
Mean amount of Purchase
Paraphrase This Document
Need a fresh take? Get an instant paraphrase of this document with our AI Paraphraser

7BASIC BUSINESS STATISTICS
The two-sample t-test finds the equality of averages of amounts of two different genders. The
average amount of purchases of males and females (31.2 and 40.4) produce the p-value 0.278 with t-
statistic (1.1013). The p-value is greater than 0.05. Hence, the null hypothesis of significant difference of
the means of the amounts of purchases with respect to gender cannot be rejected. It could be
interpreted that there exists significant difference the means of amounts of purchases according to the
gender.
Answer 4.
Age of females Age of males
40.5
41
41.5
42
42.5
43
43.5
Mean ages of females and males
gender
mean ages
The two-sample t-test finds the equality of averages of ages of customers of two different
genders. The average amount of purchases of males and females (41.4 and 43.2) produce the p-value

8BASIC BUSINESS STATISTICS
0.503 with t-statistic (0.678). The p-value is greater than 0.05. Hence, the null hypothesis of significant
difference of the means of the ages of customers with respect to gender cannot be rejected (De Winter,
2013). It could be interpreted that there exists significant difference of means of ages according to the
gender.
6. Results and Recommendations:
The analysis indicates the insignificant difference of the total gross profit of various products and
commodities. The analysis also indicates the significant difference of total amount of purchase and age
with respect to types of gender that are males and females. However, among electronic commodities
(CD and DVD), DVD is high demanding where as among books (novel, classical, Politics and best sellers),
‘Best sellers’ are high demanding.
Therefore, to enhance the business the company must sell DVD and best seller rather than CD or
classical books. The customer must prefer the stock of the company and the business would grow more
due to high profitability.
⊘ This is a preview!⊘
Do you want full access?
Subscribe today to unlock all pages.

Trusted by 1+ million students worldwide

9BASIC BUSINESS STATISTICS
References:
Alexander, M., & Walkenbach, J. (2013). Excel dashboards and reports (Vol. 17). John Wiley & Sons.
Bickel, P. J., & Lehmann, E. L. (2012). Descriptive statistics for nonparametric models II. Location.
In Selected Works of EL Lehmann (pp. 473-497). Springer, Boston, MA.
De Winter, J. C. (2013). Using the Student's t-test with extremely small sample sizes. Practical
Assessment, Research & Evaluation, 18(10).
Rouder, J. N., Morey, R. D., Speckman, P. L., & Province, J. M. (2012). Default Bayes factors for ANOVA
designs. Journal of Mathematical Psychology, 56(5), 356-374.
1 out of 10
Related Documents

Your All-in-One AI-Powered Toolkit for Academic Success.
+13062052269
info@desklib.com
Available 24*7 on WhatsApp / Email
Unlock your academic potential
Copyright © 2020–2025 A2Z Services. All Rights Reserved. Developed and managed by ZUCOL.