Business Statistics Homework: Data Analysis and Hypothesis Testing

Verified

Added on  2021/02/22

|6
|795
|102
Homework Assignment
AI Summary
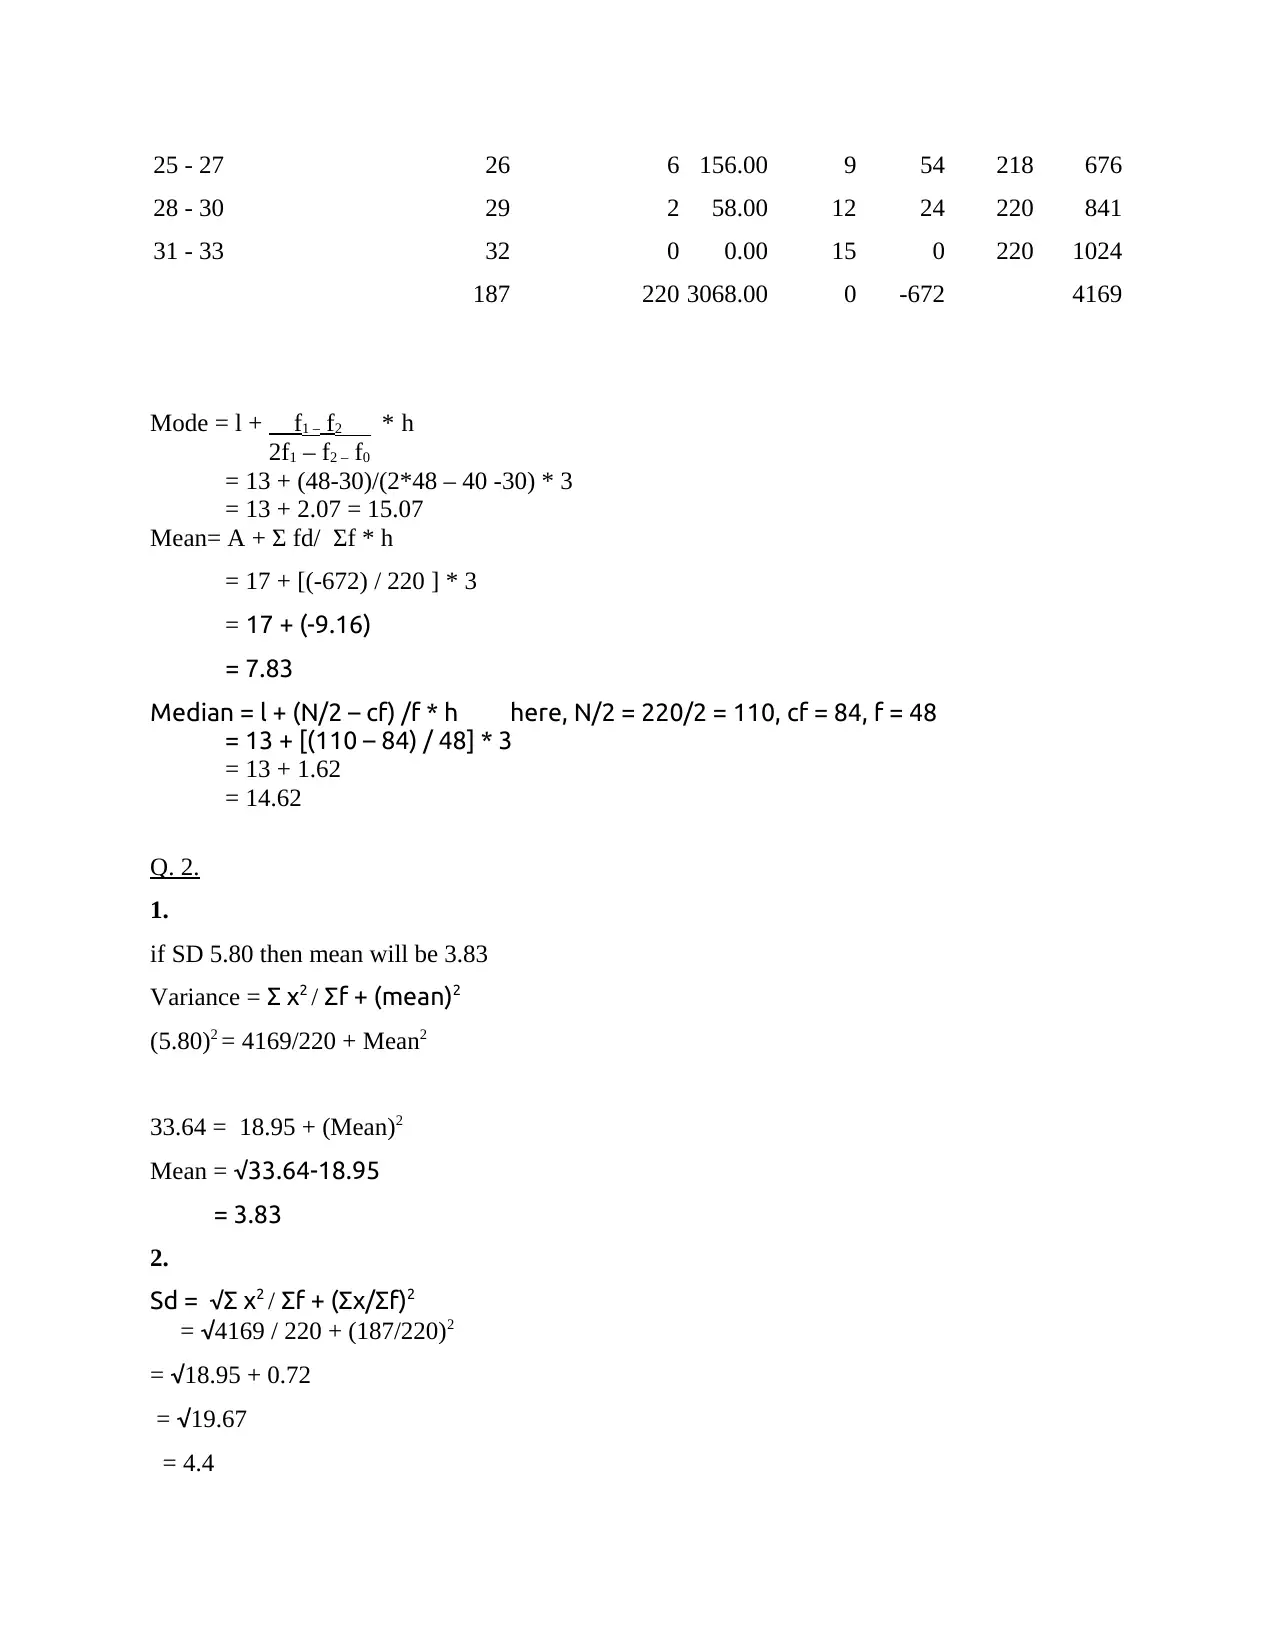
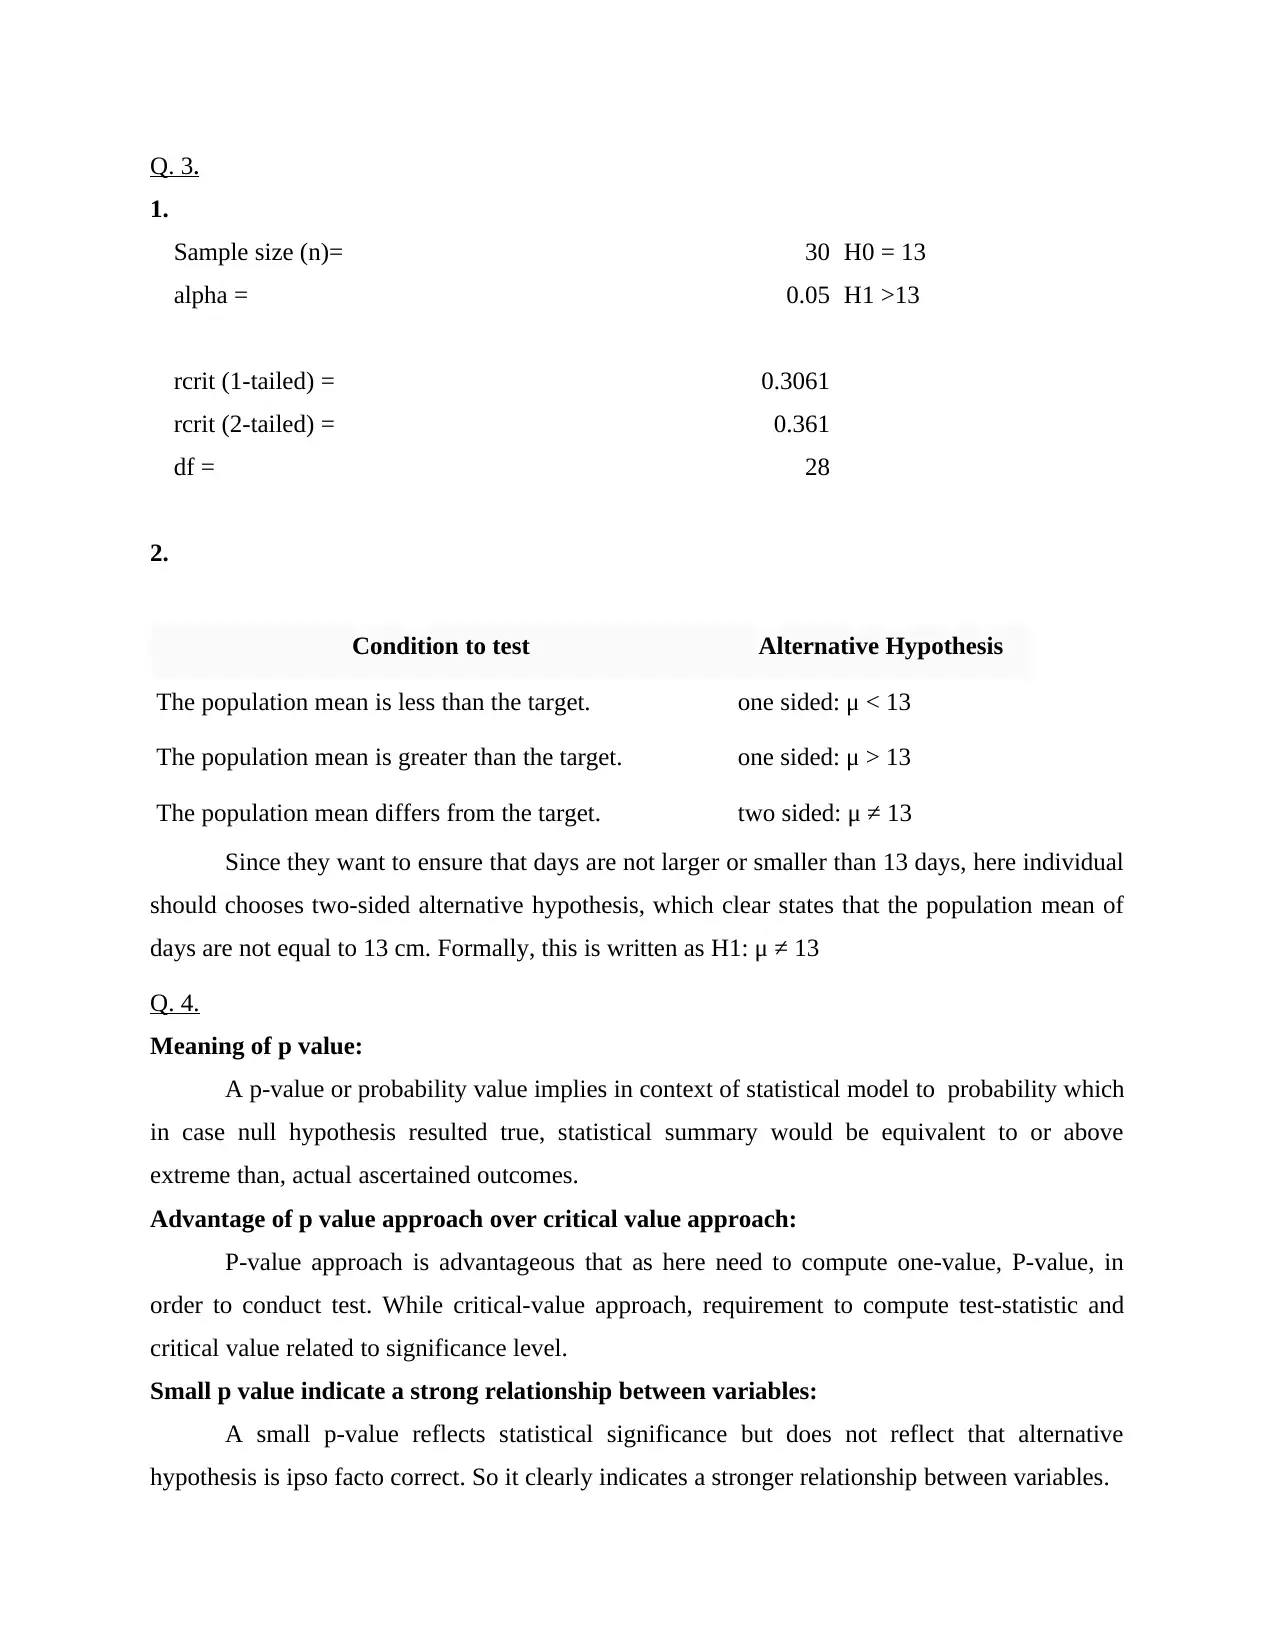
This homework assignment in business statistics covers several key concepts, including frequency distributions, measures of central tendency (mean, median, and mode), and measures of dispersion (standard deviation and variance). The assignment starts with the creation of a frequency distribution table and a histogram. It then proceeds to calculate the mean, median, and mode for the given data set. Further calculations include the standard deviation and variance. The assignment also delves into hypothesis testing, including defining the null and alternative hypotheses, understanding p-values, and interpreting the results. The solution demonstrates the application of statistical concepts to analyze data and draw meaningful conclusions. The student has provided detailed calculations and explanations for each step.
tabler-icon-diamond-filled.svg

Contribute Materials

Your contribution can guide someone’s learning journey. Share your documents today.
Document Page
Business
Statistics
tabler-icon-diamond-filled.svg

Secure Best Marks with AI Grader

Need help grading? Try our AI Grader for instant feedback on your assignments.
Document Page
Table of Contents
TASK...............................................................................................................................................3
1....................................................................................................................................................3
2....................................................................................................................................................4
3....................................................................................................................................................4
2....................................................................................................................................................4
3....................................................................................................................................................5
4....................................................................................................................................................5
Document Page
TASK
Q. 1.
1.
Range Frequency
0 - 3 10
4 - 6 18
7 - 9 26
10 - 12 30
13 - 15 48
16 - 18 40
19 - 21 22
22 - 24 18
25 - 27 6
28 - 30 2
31 - 33 0
Document Page
2.
Histogram shown in point (1) shows that range over 12 to 15 has highest frequency 48
while in over 30 range there is no data.
3.
Range X Frequency FX d= x-d F*D CF X2
0 - 3 2 10 20.00 -15 -150 10 4
4 - 6 5 18 90.00 -12 -216 28 25
7 - 9 8 26 208.00 -9 -234 54 64
10 - 12 11 30 330.00 -6 -180 84 121
13 - 15 14 48 672.00 -3 -144 132 196
16 - 18 17 40 680.00 0 0 172 289
19 - 21 20 22 440.00 3 66 194 400
22 - 24 23 18 414.00 6 108 212 529
0 4 7
0
10
20
30
40
50
60
10
18
26
30
48
40
22
18
6
2 0
tabler-icon-diamond-filled.svg

Secure Best Marks with AI Grader

Need help grading? Try our AI Grader for instant feedback on your assignments.
Document Page
25 - 27 26 6 156.00 9 54 218 676
28 - 30 29 2 58.00 12 24 220 841
31 - 33 32 0 0.00 15 0 220 1024
187 220 3068.00 0 -672 4169
Mode = l + f1 – f2 * h
2f1 – f2 – f0
= 13 + (48-30)/(2*48 – 40 -30) * 3
= 13 + 2.07 = 15.07
Mean= A + Σ fd/ Σf * h
= 17 + [(-672) / 220 ] * 3
= 17 + (-9.16)
= 7.83
Median = l + (N/2 – cf) /f * h here, N/2 = 220/2 = 110, cf = 84, f = 48
= 13 + [(110 – 84) / 48] * 3
= 13 + 1.62
= 14.62
Q. 2.
1.
if SD 5.80 then mean will be 3.83
Variance = Σ x2 / Σf + (mean)2
(5.80)2 = 4169/220 + Mean2
33.64 = 18.95 + (Mean)2
Mean = √33.64-18.95
= 3.83
2.
Sd = √Σ x2 / Σf + (Σx/Σf)2
= 4169 / 220 + (187/220)2
= 18.95 + 0.72
= 19.67
= 4.4
Document Page
Q. 3.
1.
Sample size (n)= 30 H0 = 13
alpha = 0.05 H1 >13
rcrit (1-tailed) = 0.3061
rcrit (2-tailed) = 0.361
df = 28
2.
Condition to test Alternative Hypothesis
The population mean is less than the target. one sided: μ < 13
The population mean is greater than the target. one sided: μ > 13
The population mean differs from the target. two sided: μ ≠ 13
Since they want to ensure that days are not larger or smaller than 13 days, here individual
should chooses two-sided alternative hypothesis, which clear states that the population mean of
days are not equal to 13 cm. Formally, this is written as H1: μ ≠ 13
Q. 4.
Meaning of p value:
A p-value or probability value implies in context of statistical model to probability which
in case null hypothesis resulted true, statistical summary would be equivalent to or above
extreme than, actual ascertained outcomes.
Advantage of p value approach over critical value approach:
P-value approach is advantageous that as here need to compute one-value, P-value, in
order to conduct test. While critical-value approach, requirement to compute test-statistic and
critical value related to significance level.
Small p value indicate a strong relationship between variables:
A small p-value reflects statistical significance but does not reflect that alternative
hypothesis is ipso facto correct. So it clearly indicates a stronger relationship between variables.
chevron_up_icon
1 out of 6
circle_padding
hide_on_mobile
zoom_out_icon
logo.png

Your All-in-One AI-Powered Toolkit for Academic Success.

Available 24*7 on WhatsApp / Email

[object Object]