Statistics for Business: Analyzing Quiz Data, Regression & Confidence

Verified

Added on  2020/05/16

|10
|1555
|155
Homework Assignment
AI Summary
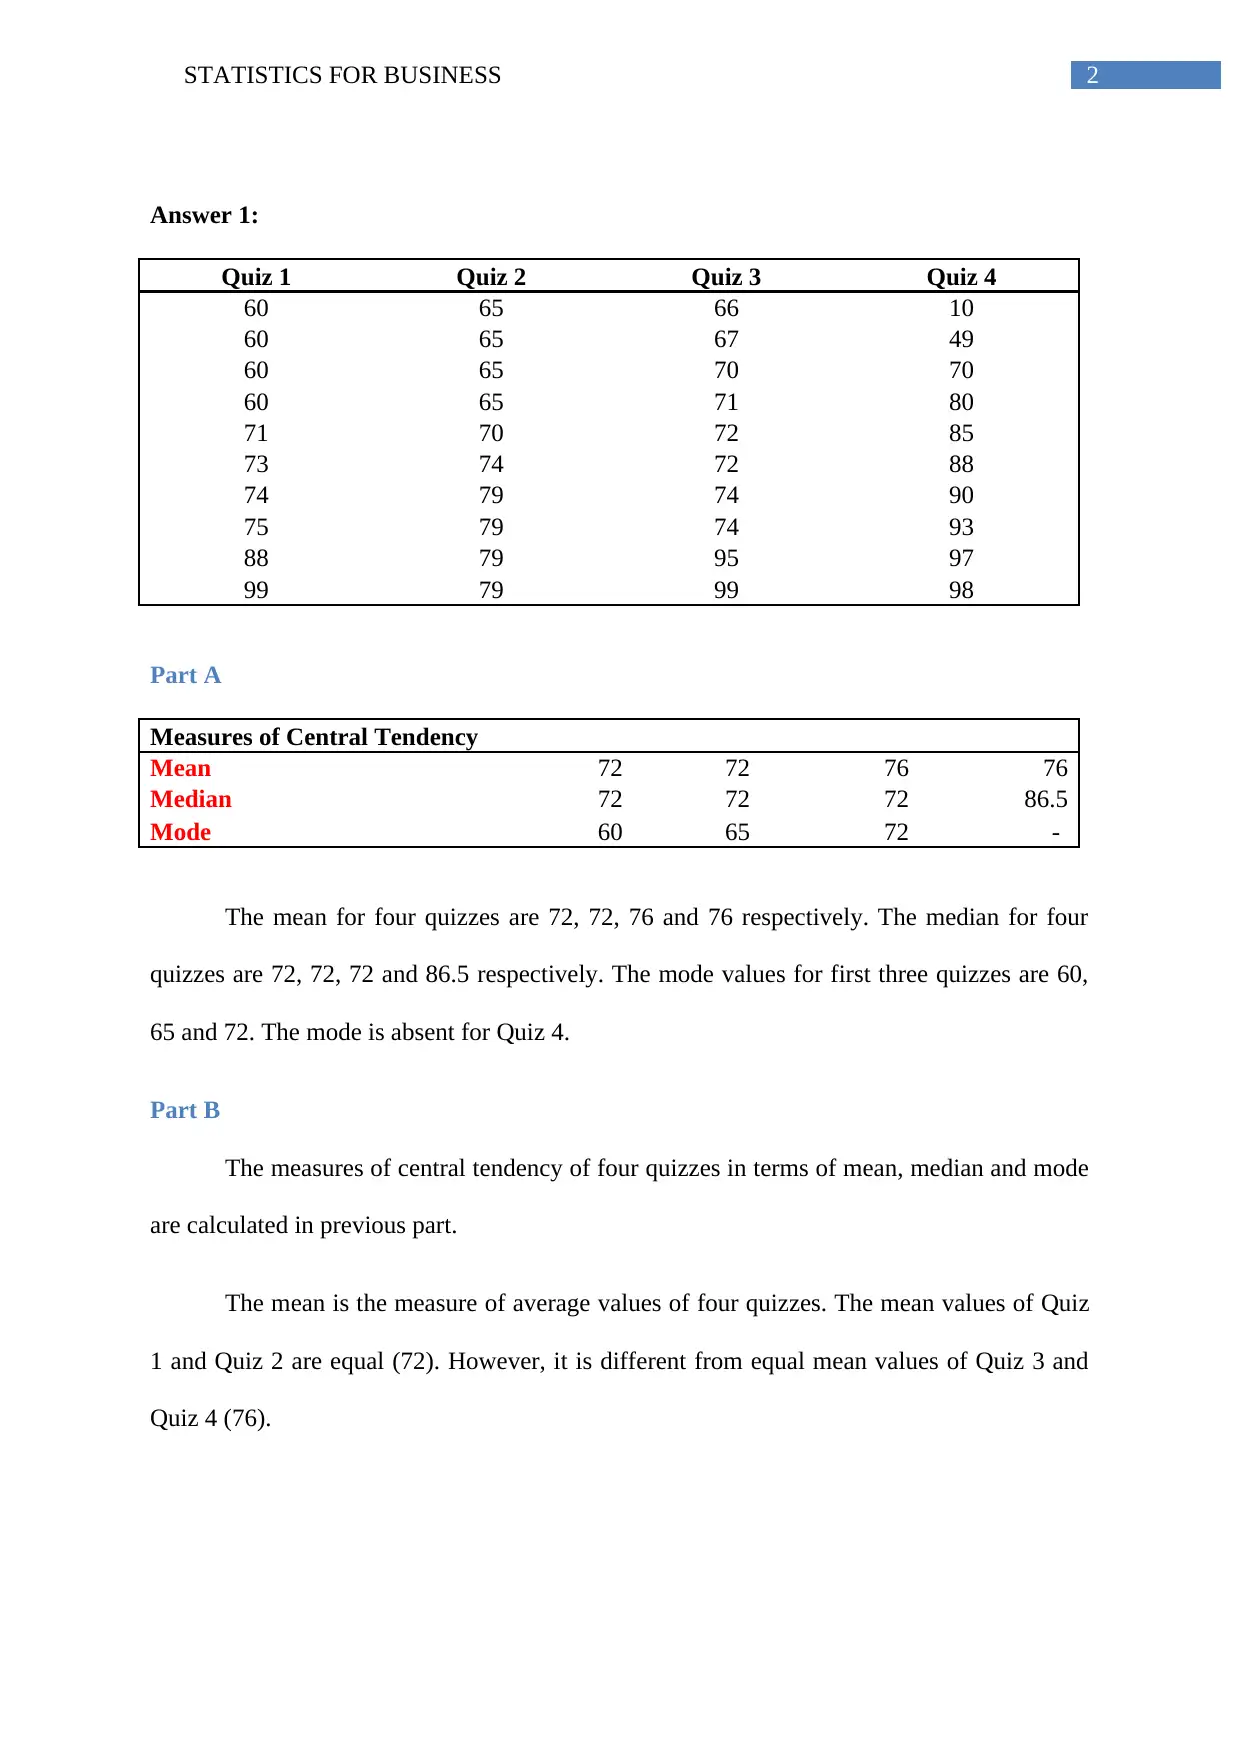
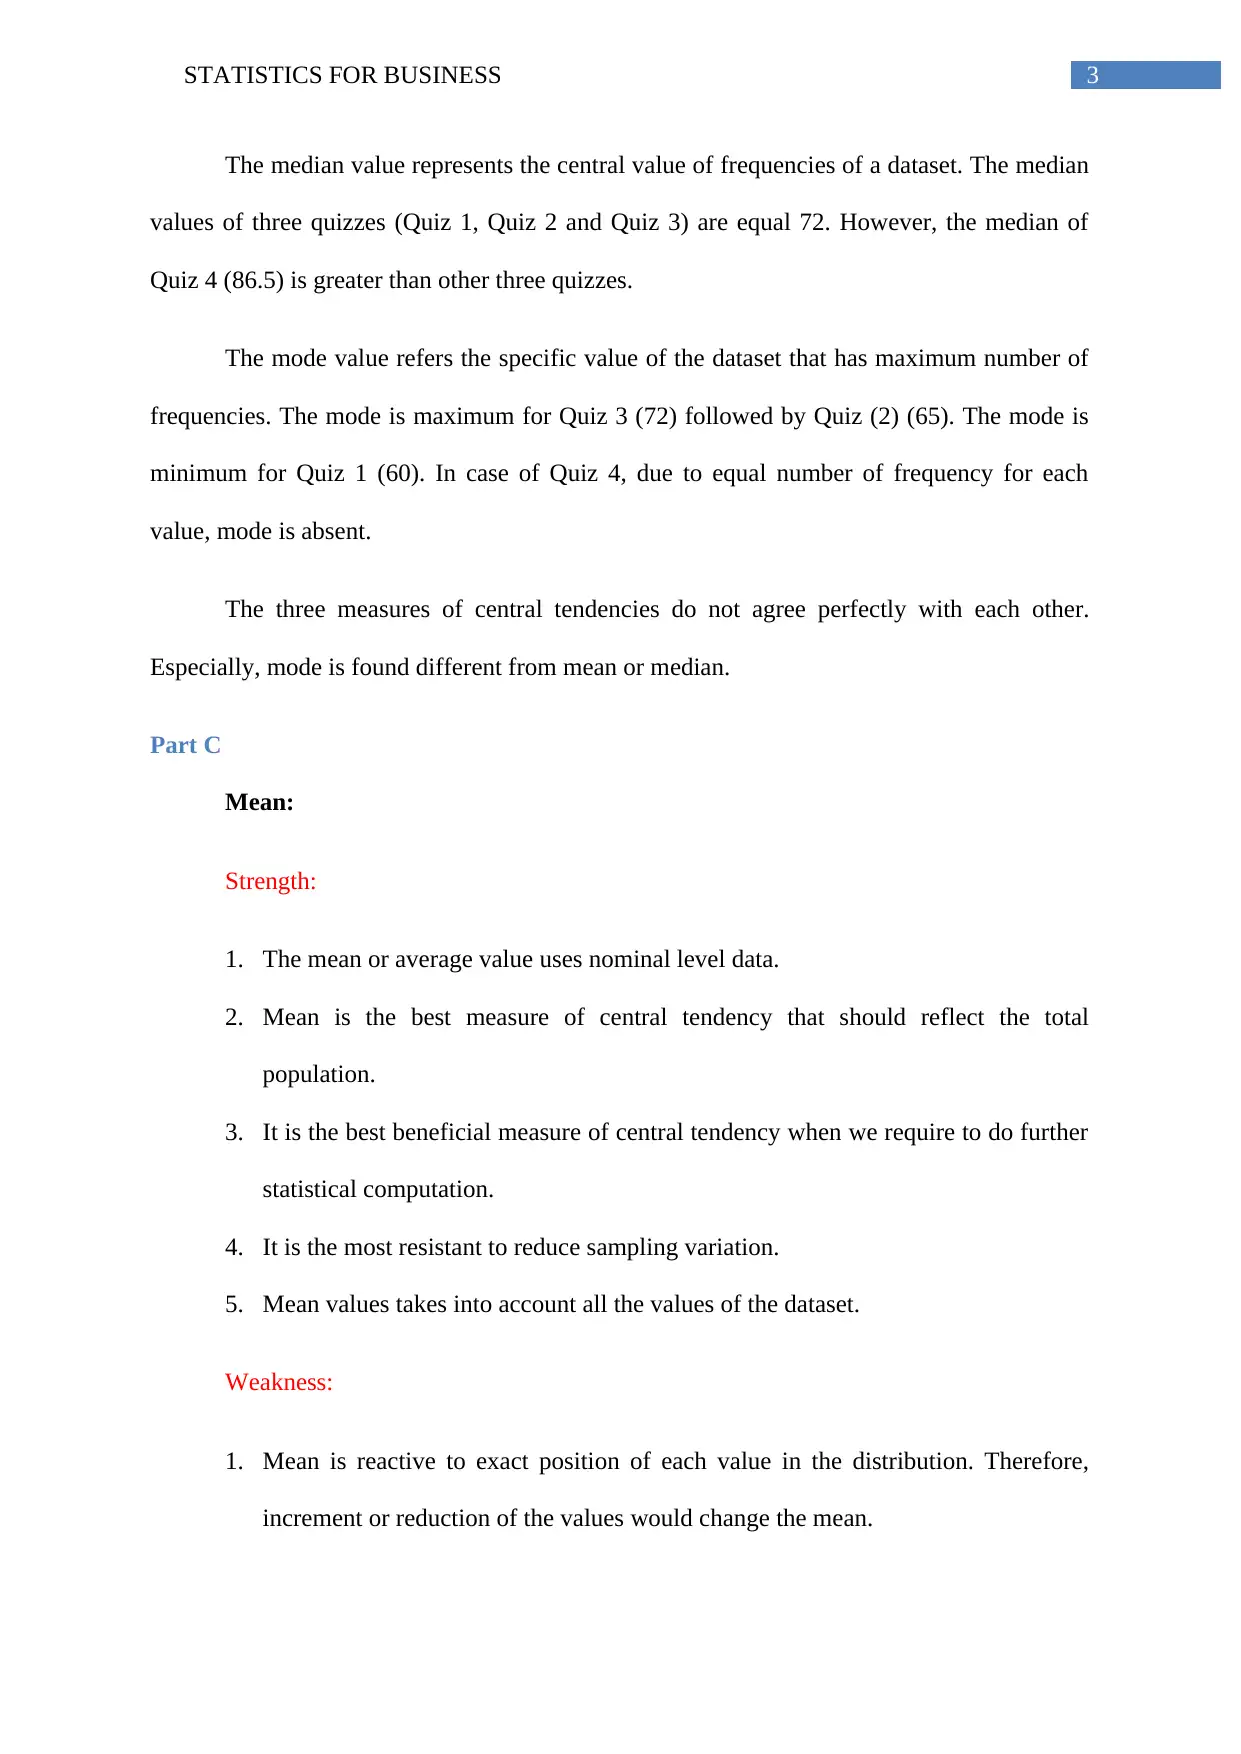
This assignment presents a comprehensive analysis of statistical concepts applied to business scenarios. It begins with an examination of quiz data, calculating and comparing measures of central tendency (mean, median, and mode) across four quizzes. The analysis includes discussions on the strengths and weaknesses of each measure, along with skewness calculations to determine the distribution of scores. The assignment then delves into confidence intervals, calculating a 90% confidence interval for the proportion of almonds in a sample of mixed nuts and determining the necessary sample size. Finally, it explores linear regression, assessing the relationship between price and perceived sound quality of stereo speakers, including interpreting the p-value, R-squared value, and the regression model's slope. The solution provides a detailed understanding of statistical methods and their practical application in business contexts.
Document Page
Running head: STATISTICS FOR BUSINESS
Statistics for Business
Name of the Student:
Name of the University:
Author’s note:
tabler-icon-diamond-filled.svg

Secure Best Marks with AI Grader

Need help grading? Try our AI Grader for instant feedback on your assignments.
Document Page
1STATISTICS FOR BUSINESS
Table of Contents
Answer 1:...................................................................................................................................2
Part A.....................................................................................................................................2
Part B......................................................................................................................................2
Part C......................................................................................................................................3
Part D.....................................................................................................................................5
Part E......................................................................................................................................5
Answer 2:...................................................................................................................................5
Part A.....................................................................................................................................6
Part B......................................................................................................................................6
Part C......................................................................................................................................6
Part D.....................................................................................................................................7
Answer 3:...................................................................................................................................7
Part A.....................................................................................................................................7
Part B......................................................................................................................................7
Part C......................................................................................................................................8
Document Page
2STATISTICS FOR BUSINESS
Answer 1:
Quiz 1 Quiz 2 Quiz 3 Quiz 4
60 65 66 10
60 65 67 49
60 65 70 70
60 65 71 80
71 70 72 85
73 74 72 88
74 79 74 90
75 79 74 93
88 79 95 97
99 79 99 98
Part A
Measures of Central Tendency
Mean 72 72 76 76
Median 72 72 72 86.5
Mode 60 65 72 -
The mean for four quizzes are 72, 72, 76 and 76 respectively. The median for four
quizzes are 72, 72, 72 and 86.5 respectively. The mode values for first three quizzes are 60,
65 and 72. The mode is absent for Quiz 4.
Part B
The measures of central tendency of four quizzes in terms of mean, median and mode
are calculated in previous part.
The mean is the measure of average values of four quizzes. The mean values of Quiz
1 and Quiz 2 are equal (72). However, it is different from equal mean values of Quiz 3 and
Quiz 4 (76).
Document Page
3STATISTICS FOR BUSINESS
The median value represents the central value of frequencies of a dataset. The median
values of three quizzes (Quiz 1, Quiz 2 and Quiz 3) are equal 72. However, the median of
Quiz 4 (86.5) is greater than other three quizzes.
The mode value refers the specific value of the dataset that has maximum number of
frequencies. The mode is maximum for Quiz 3 (72) followed by Quiz (2) (65). The mode is
minimum for Quiz 1 (60). In case of Quiz 4, due to equal number of frequency for each
value, mode is absent.
The three measures of central tendencies do not agree perfectly with each other.
Especially, mode is found different from mean or median.
Part C
Mean:
Strength:
1. The mean or average value uses nominal level data.
2. Mean is the best measure of central tendency that should reflect the total
population.
3. It is the best beneficial measure of central tendency when we require to do further
statistical computation.
4. It is the most resistant to reduce sampling variation.
5. Mean values takes into account all the values of the dataset.
Weakness:
1. Mean is reactive to exact position of each value in the distribution. Therefore,
increment or reduction of the values would change the mean.
tabler-icon-diamond-filled.svg

Secure Best Marks with AI Grader

Need help grading? Try our AI Grader for instant feedback on your assignments.
Document Page
4STATISTICS FOR BUSINESS
2. Outliers or extreme values influence mean values. It is more responsive to the
presence or absence of extreme values in the distribution.
Median:
Strength:
1. The median value uses ordinal level data.
2. Outliers or extreme scores do not influence it. As median is concerned with
central point of the distribution, it is less sensitive to the extreme scores than
mean.
3. If distributions are positively or negatively skewed, median is the best measure, as
it does not pay focus to the extreme values.
Weakness:
1. Median responds to number of scores lie above or below. However, it fails to
decide how far away the scores may be from median.
2. Median is not representative of all the values of the dataset.
Mode:
Strength:
1. The mode value uses interval level data.
2. Mode is easy to obtain from frequency distribution of the dataset.
3. Mode is only measure that can be utilised for the dataset that have the character of
a nominal scale.
Weakness:
1. Mode is not stable from sample to sample.
Document Page
5STATISTICS FOR BUSINESS
2. There may be one (Unimodal) or two (Bimodal) mode or modes of a particular
dataset. Hence, the dataset perfectly do not provide particular information.
Part D
Quiz 1 Quiz 2 Quiz 3 Quiz 4
Skewness 1.01306 6.17E-17 1.5713 -1.86603
If the distribution is symmetric, then mean = median. If the distribution is positively
skewed, then mean is greater than median. For, negatively skewed distribution, mean is lesser
than median.
Quiz 3 has positively skewed (1.5713) distribution and Quiz 4 has negatively skewed
(-1.86603) distribution. The distribution is also supported by mean and median values. The
distribution is symmetric for Quiz 2 (6.17E-17). In this case, mean is also equal to median.
The Skewness shows Quiz 1 is positively distributed with skewness value 1.01306. However,
mean and median values of Quiz 1 are equal.
Part E
The measures of central tendency (mean, median and mode) refer that performance is
best in case of Quiz 4 than other three quizzes according to mean (76) and median (86.5). The
performances of other three quizzes (Quiz 1, Quiz 2 and Quiz 3) are almost similar. Quiz 3
comparatively has better performance than Quiz 1 and Quiz 2 for the mean (76). Quiz 1 and
Quiz 2 has equal means (72) and modes (72). However, mode of Quiz 2 (65) is greater than
mode of Quiz 1 (60).
Answer 2:
Sample size of Mixed nuts (n) = 100
Almonds = 19
Proportion (p) = 0.19
Document Page
6STATISTICS FOR BUSINESS
(1-p) = 0.81
mean [p*(1-p)] = 0.1539
Standard deviation [p*(1-p)/n] = 0.001539
Square root [p*(1-p)/n] = 0.03923
Standard Error (SE) of p = 0.03923
Confidence interval = 90%
Level of significance = 10%
Z-value = 1.644854
Z*SE (p) = 0.064528
Part A
Upper confidence limit = 0.254528
Lower confidence limit = 0.125472
The upper 90% confidence interval for the proportion of almonds is 0.254528 and
lower 90% confidence interval for the proportion of almonds is 0.125472.
Part B
In a sample of 100 Planter’s Mixed Nuts, 19 were found to be almonds. The locations
of these almonds are not fixed. They are randomly distributed among the Mixed Nuts. Hence,
normality may be assumed in this case for finding the proportional distribution of almonds.
Part C
Calculation of sample size formula is:
n= p( 1 p ) Z2
e2
Proportion (p) = 0.19
standard error (e) = 0.03
Confidence interval = 90%
Level of significance = 10%
Z-value = 1.644854
Z-square = 2.705543
required sample size (n) = 462.6479
tabler-icon-diamond-filled.svg

Paraphrase This Document

Need a fresh take? Get an instant paraphrase of this document with our AI Paraphraser
Document Page
7STATISTICS FOR BUSINESS
The calculated sample size for obtaining 90% confidence interval and error of ±(0.03)
is 462.6479 ( 463 ¿.
Part D
The quality manager surly would understand the necessity of sampling. Without
standards and procedures, a business organisation would face productivity loss, quality losses
and delays in schedules. The data management involves standards and methods that consists
the common quality control techniques. The quality manager is responsible for documenting
customer expectations and quality management objectives. Sampling technique is used for
ensuring the customer endorses of all quality aims involved in the Quality Management Plan.
Random sampling is the simplest process to collect data for quality control technique. After
application of sampling, a sampling manager could perform an active role to ensure the
quality objectives of customers articulating the essential professional standards and
regulations.
Answer 3:
Part A
The linear regression model of perceived sound quality as a function for 27 stereo
speakers is executed. “Price” is chosen as independent variable in this simple linear
regression model whereas “Quality of sound” as dependent variable. The p-value is for
“Price” is found as 0.6019 which is greater than 0.05. Therefore, we cannot reject the null
hypothesis of significant effect of independent factor on dependent variable. The null
hypothesis cannot be rejected at 5% level of significance.
Document Page
8STATISTICS FOR BUSINESS
Part B
The value of R-square is 0.01104. Therefore, it could be concluded that linear
association assuming “Price” as independent variable is insignificant. The sound quality can
explain only 1.104% variability of “Price”. The linear relationship between these two
variables is rejected.
Part C
The linear regression model is –
Sound quality = 88.4902 - 0.00239*Price
Here, the slope of the model (-0.00239) is negative. The negative relationship
between these models indicates that for higher Prices, lower Sound quality is perceived.
Similarly, for lower Prices, higher Sound quality is perceived.
Document Page
9STATISTICS FOR BUSINESS
chevron_up_icon
1 out of 10
circle_padding
hide_on_mobile
zoom_out_icon
logo.png

Your All-in-One AI-Powered Toolkit for Academic Success.

Available 24*7 on WhatsApp / Email

[object Object]