King's Own Institute BUS105 Business Statistics Assignment
VerifiedAdded on 2023/03/17
|8
|1861
|83
Homework Assignment
AI Summary
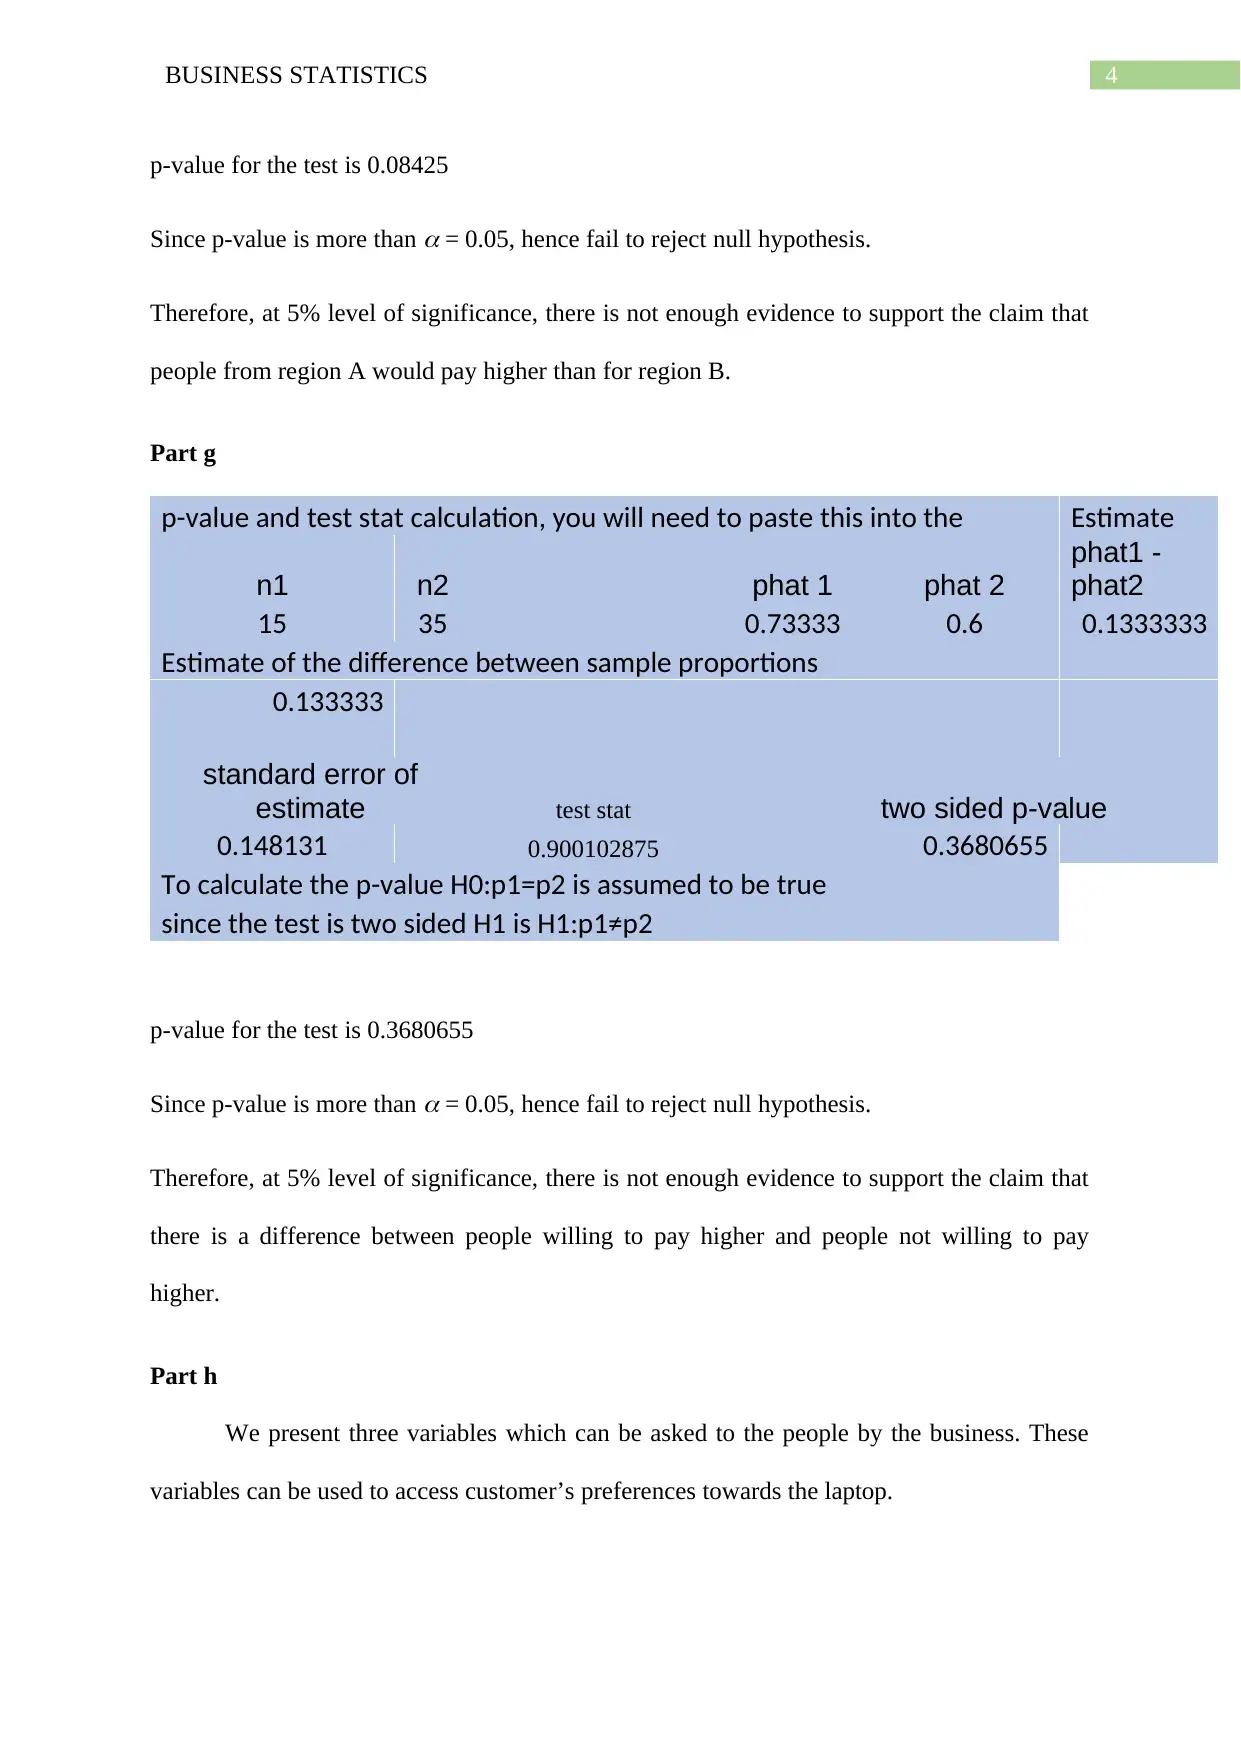
This business statistics assignment analyzes market research data on laptop preferences, examining how much potential buyers would pay for different versions of a laptop across two regions. The analysis includes descriptive statistics (averages, standard deviations), a regression analysis of price relationships, and hypothesis testing to compare willingness to pay between regions. The assignment investigates the relationship between paying more for version 1 and version 2. It also explores confidence intervals, p-values, and the impact of lurking variables on the observed relationships. The solution also discusses how to formulate research questions, methodologies, and data analysis approaches for a business report. The assignment also covers the identification of various variable types, like independent and dependent variables and their impact on the study. Finally, it delves into the process of creating a business report based on the statistical analysis conducted.

Running head: BUSINESS STATISTICS
Business Statistics
Name of the Student
Name of the University
Author Note
Business Statistics
Name of the Student
Name of the University
Author Note
Paraphrase This Document
Need a fresh take? Get an instant paraphrase of this document with our AI Paraphraser

1BUSINESS STATISTICS
Part a
Values Region A Region B Grand Total
Average of how much would they pay for version 1? 1017.8 1056.2 1037
StdDev of how much would they pay for version 1? 128.5388848
118.521504
1
124.510110
7
Count of how much would they pay for version 1? 50 50 100
From the above table it can be said that people from region B would on an average
pay higher than region A. However, the standard deviation of the pay for version 1 is lower
for region B than region A. Further, the count of sample surveyed from region A and B are
equal.
Part b
$700
$800
$900
$1,000
$1,100
$1,200
$1,300
$1,400$600
$700
$800
$900
$1,000
$1,100
$1,200
$1,300
$1,400
f(x) = 1.0077594547393 x − 45.2171171629914
R² = 0.79933134111922
how much would they pay for version 1
how much would they pay for version 2
The above figure shows the relation between how much the people would pay for
version 1 to version 2. The relation can be expressed as:
Pay for version 2 = 1.0078*pay for version 1 – 45.217

2BUSINESS STATISTICS
Thus for $1 increase in pay for version 1 there would be an increase in pay for
version 2 by 1.0078.
Part c
Column Labels
Row Labels n y
Grand
Total
A
Count of would they pay more for version 1? 19 31 50
Count of would they pay more for version 1 % 38.00%
62.00
% 100.00%
B
Count of would they pay more for version 1? 14 36 50
Count of would they pay more for version 1 % 28.00%
72.00
% 100.00%
Total Count of would they pay more for version 1? 33 67 100
Total Count of would they pay more for version 1
% 33.00%
67.00
% 100.00%
From the above table it is found that 67% of people would pay more for version 1. On
the other hand, 33% of the people would not pay more for version 1.
It is also found that 62% of the people from region A would pay more for version 1.
72% of the people from region B would pay higher for version 1.
Part d
Would they pay more for version 1 (y) = 67% = ( ^p) = 0.67
The sample size = (n) = 100
Formula to calculate 95% Confidence Interval = ^p+ z0.95 √ ^p (1− ^p)
n
The upper limit = 0.67+1.96∗
√ 0.67 ( 1−0.67 )
100 =0.674334
⊘ This is a preview!⊘
Do you want full access?
Subscribe today to unlock all pages.

Trusted by 1+ million students worldwide

3BUSINESS STATISTICS
The lower limit = 0.67−1.96∗
√ 0.67 ( 1−0.67 )
100 =0.665666
Part e
To test the claim that if people would pay more than $1000 for version 1
Null Hypothesis: H0 : μ≤ 1000
Alternate Hypothesis: H1 : μ> 1000
Average of how much would they pay for version 1(x) = 1037
Standard deviation of how much would they pay for version 1(
) = 124.51
Count (n) = 100
Test Statistics = z= x −μ
σ / √ n = 1037−1000
124.51
√ 100
=2.97
Thus p = 0.0015
Since p-value is less than 0.01, there is enough evidence to support the claim that people
would more than $1000 for version 1.
Part f
Estimate
xbar1-xbar2
-65.2667
standard error of estimate xbar1-xbar2
36.5484
t test stat df two sided pvalue
-1.78576 30 0.08425
To calculate the p-value H0:μ1=μ2 is assumed to be
true
since the test is two sided H1 is H1:μ1≠μ2
Paraphrase This Document
Need a fresh take? Get an instant paraphrase of this document with our AI Paraphraser

4BUSINESS STATISTICS
p-value for the test is 0.08425
Since p-value is more than
= 0.05, hence fail to reject null hypothesis.
Therefore, at 5% level of significance, there is not enough evidence to support the claim that
people from region A would pay higher than for region B.
Part g
p-value and test stat calculation, you will need to paste this into the Estimate
n1 n2 phat 1 phat 2
phat1 -
phat2
15 35 0.73333 0.6 0.1333333
Estimate of the difference between sample proportions
0.133333
standard error of
estimate test stat two sided p-value
0.148131 0.900102875 0.3680655
To calculate the p-value H0:p1=p2 is assumed to be true
since the test is two sided H1 is H1:p1≠p2
p-value for the test is 0.3680655
Since p-value is more than
= 0.05, hence fail to reject null hypothesis.
Therefore, at 5% level of significance, there is not enough evidence to support the claim that
there is a difference between people willing to pay higher and people not willing to pay
higher.
Part h
We present three variables which can be asked to the people by the business. These
variables can be used to access customer’s preferences towards the laptop.

5BUSINESS STATISTICS
We can add the variable “would you pay higher for DELL laptop.” When coming to
the choice of laptops people have their own preferences. Thus some people may prefer to go
in for a DELL laptop while others may choose LENOVO, still others may have other brands.
The choice of brand is a personal liking of the people. Hence, some people might be willing
to pay higher for a DELL Laptop, while others might not be willing to pay higher. The
response to the variable would be a categorical variable. The response to the above variable
would be either of “yes” or “no.”
The variable “Does screen size matters” can be used to test the preferences of the
laptops. Laptops which have a smaller screen size are highly portable. Whereas, laptops
which have a larger screen size are clumsy and difficult to carry around. Moreover, laptops
with a higher screen size might be heavier also. The response to the variable would be a
categorical variable. The response to the above variable would be either of “yes” or “no.”
The business can also add the variable “How much hard drive space do you need?”
hard drives are the memory space available to the laptop. Hard drives come in various sizes
500gb, 1TB and 2TB. The price of a laptop increases with the memory size of a laptop. Thus
higher the memory required by the customer, the higher the price of the laptop. To save
prices customer’s may purchase a laptop with 5oogb of disk space, but replenish the memory
requirement with a USB drive. The customer’s response to the variable would be a numerical
variable. The response can be either of “500gb”, “1TB” or “2TB.”
Part i
Variables are generally classified as – independent and dependent. In any study or
experiment, the independent variable is the variable whose values changes. The independent
variable is not influenced by any other variable. On the other hand, the dependent variable
⊘ This is a preview!⊘
Do you want full access?
Subscribe today to unlock all pages.

Trusted by 1+ million students worldwide

6BUSINESS STATISTICS
depends on the independent variable. It is generally interpreted as an increase in the value of
the independent variable the value of the dependent variable increase and vice a versa.
A “lurking variable” is neither the independent variable nor the dependent variable.
However, it can affect the relationship between the response and predictor variable. In
“section b” above we have analysed the relationship between “would you pay higher for
version 1” and “would you pay higher for version 2.” It was reported that there is a
relationship between the two variables. However, this relationship does not indicate that
there is a causal relationship between the two variables. There may other factors which might
be responsible for the relationship between the two variables. This third factor is known as a
lurking variable.
In the study between the two variables the lurking variable is not observed. These are
extraneous variables. Moreover, it can be found that the lurking variable can cause a change
in the observed values of both the dependent and the independent variables. These variables
can cause biasness in the observations. The relationship between the two variables is studied
through the use of regression analysis. The presence of lurking variables can confound the
relationship between the variables. The error in the relationship between the two variables
Paraphrase This Document
Need a fresh take? Get an instant paraphrase of this document with our AI Paraphraser

7BUSINESS STATISTICS
can be known from how closely the lurking variables is linked to the dependent variable. The
presence of lurking variable is usually studied with the help of residual analysis.
Part j
In the initial parts of the report we studied how to analyse different types of variables.
Next we studied what are the variables which might be useful for a new business in laptops.
Finally, we studied what is lurking variable.
In order to prepare a report using the above information the first step should be to
provide the introduction. In the introduction stage a brief over view of the laptop business
should be provided. Then we propose the research objective. Herein we can provide
information on the study that we wish to conduct – the factors which are essential for the
growth of a laptop business. The next stage is to provide the research questions. The research
questions investigate the factors which are necessary for the growth of the business. Based on
the research questions the methodology is formed. The methodology part proposes the
methods to be used for investigating the factors necessary for the growth of Laptop business.
In the initial sections of this assignment we studied how to analyses different variables. The
knowledge of the study would help us in planning strategies to evaluate the variables. The
next part of the report needs to be the data analysis part. The knowledge of the initial parts of
this paper helps us in evaluating the data. The knowledge of how two variables are related
helps us in gaining insight into the relation between the two variables. In addition, we can
also evaluate if a Lurking variable is present which might influence the two variables. Finally
a conclusion can be drawn on how the laptop business can be grown.
1 out of 8
Related Documents

Your All-in-One AI-Powered Toolkit for Academic Success.
+13062052269
info@desklib.com
Available 24*7 on WhatsApp / Email
Unlock your academic potential
Copyright © 2020–2025 A2Z Services. All Rights Reserved. Developed and managed by ZUCOL.