STT100 Statistics for Business: Median Age Case Study and Research

Verified

Added on  2022/08/26

|8
|572
|24
Case Study
AI Summary
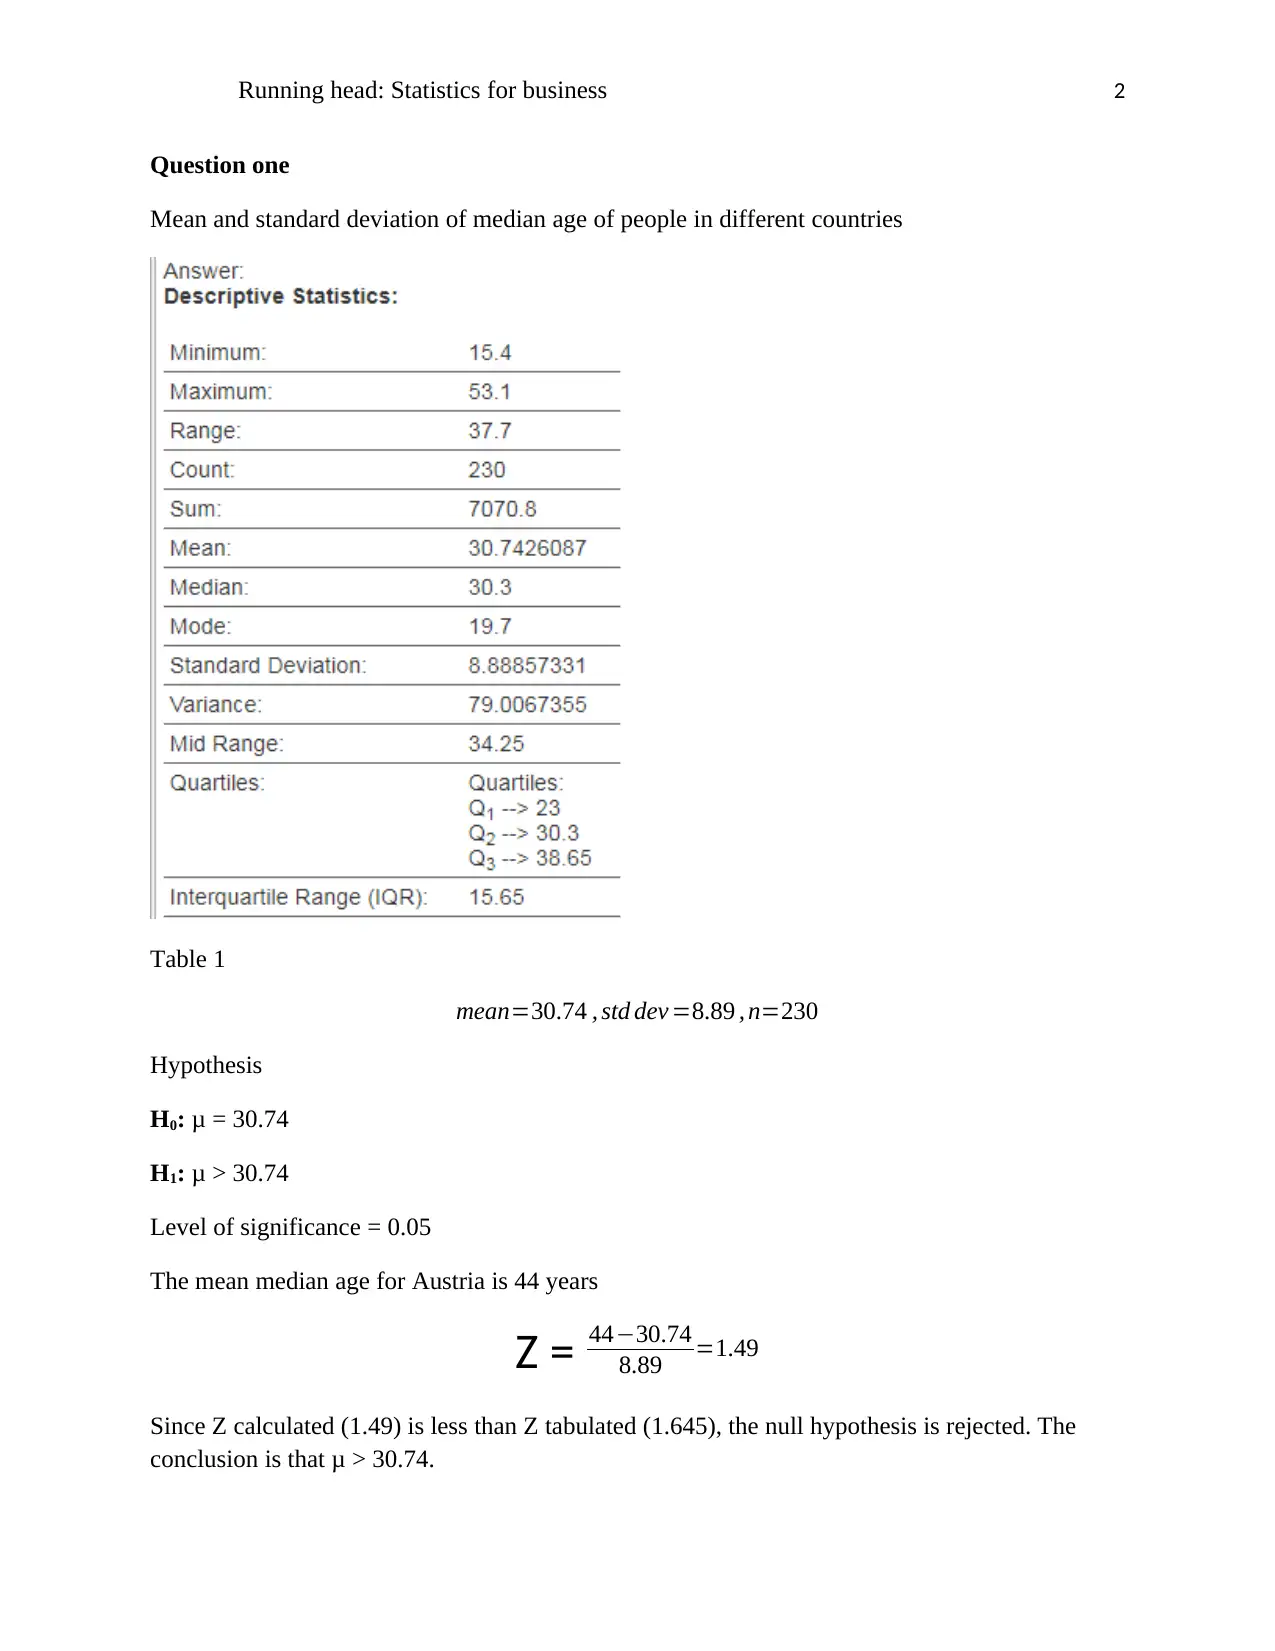
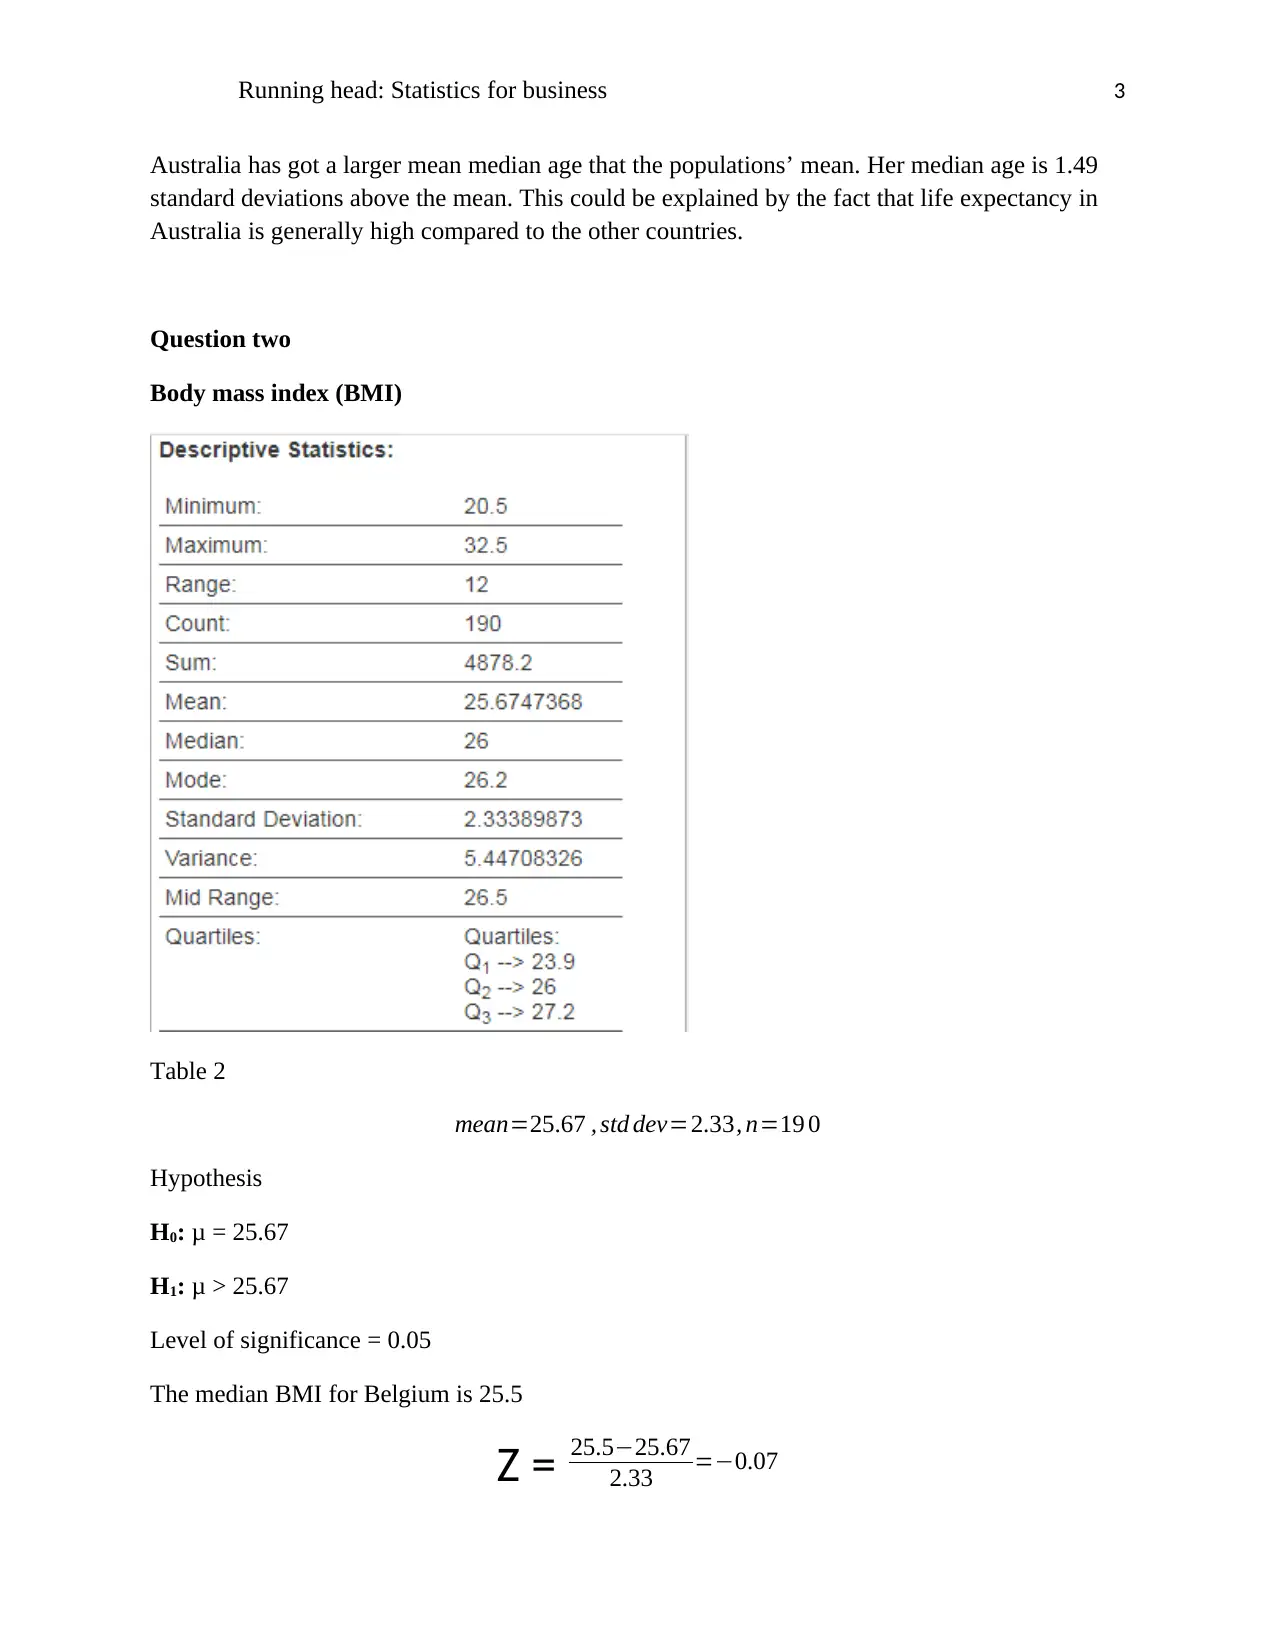
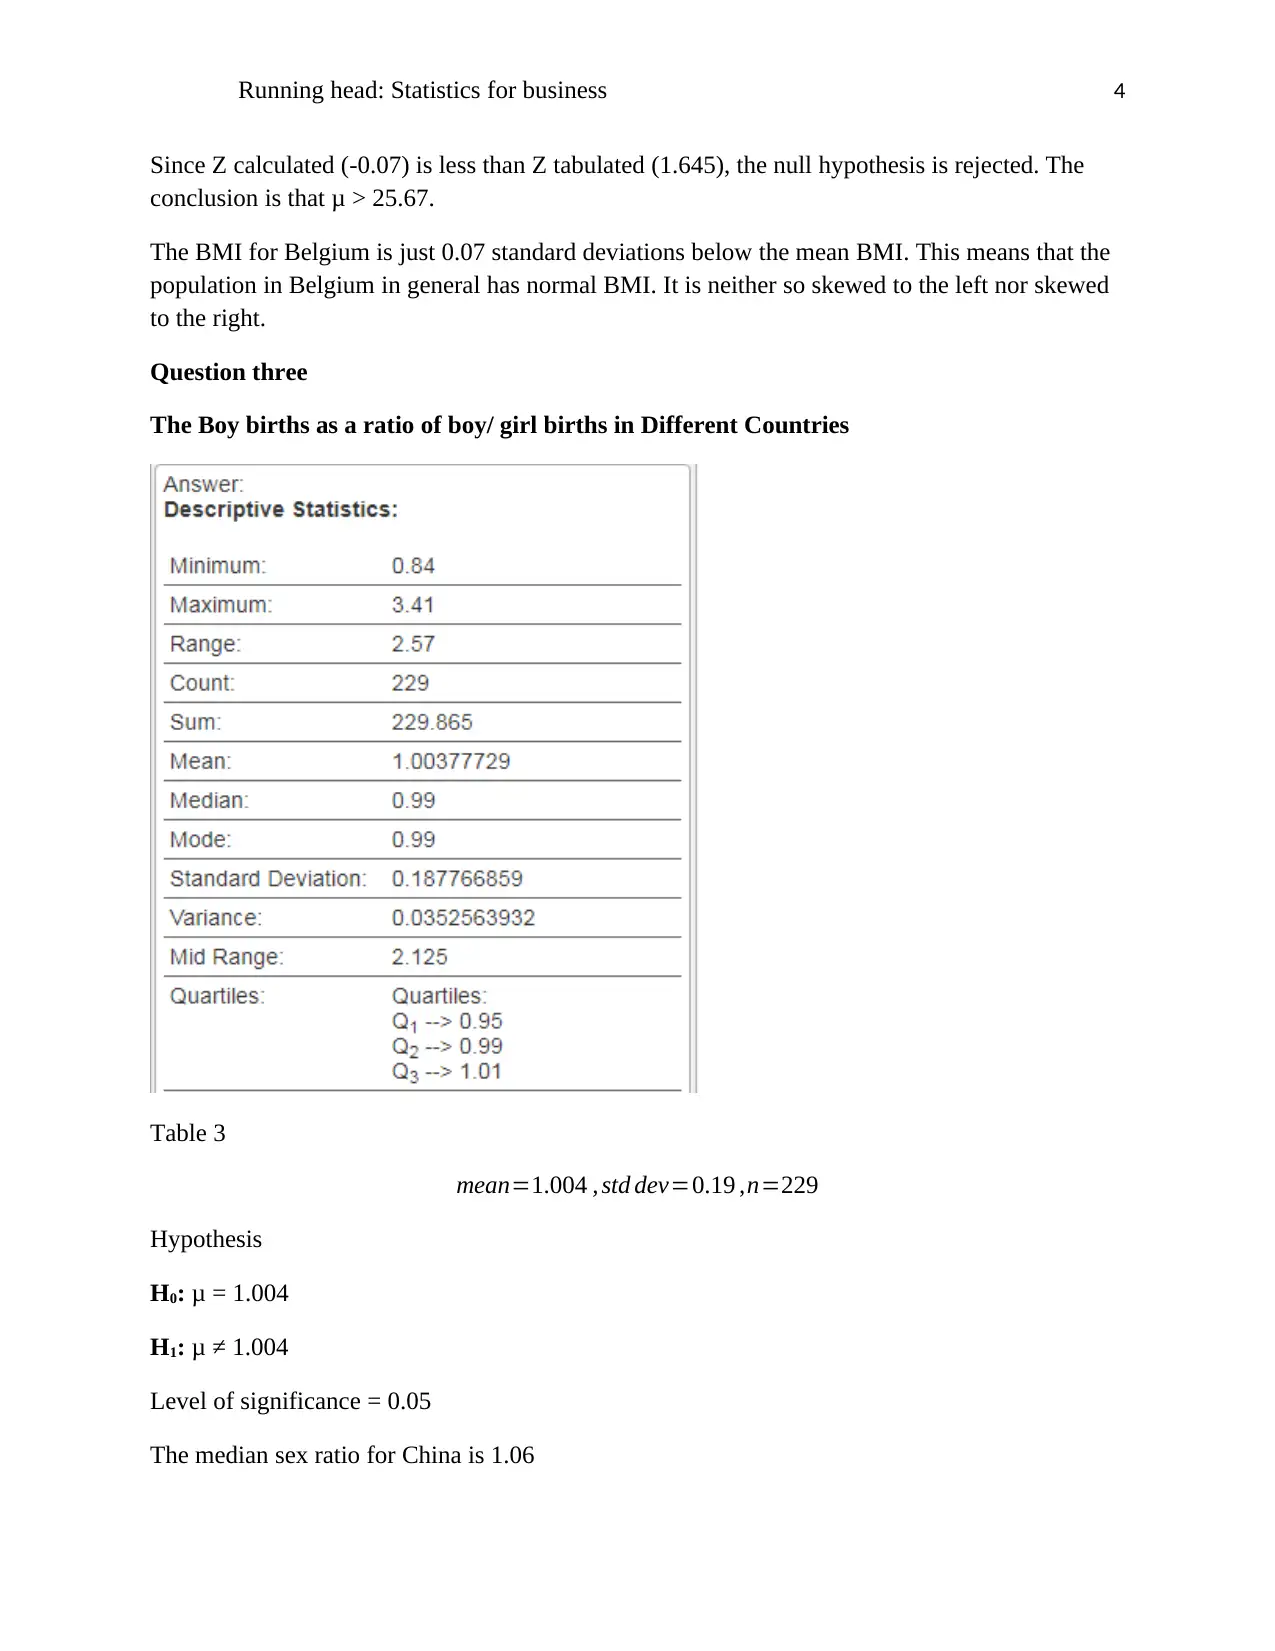
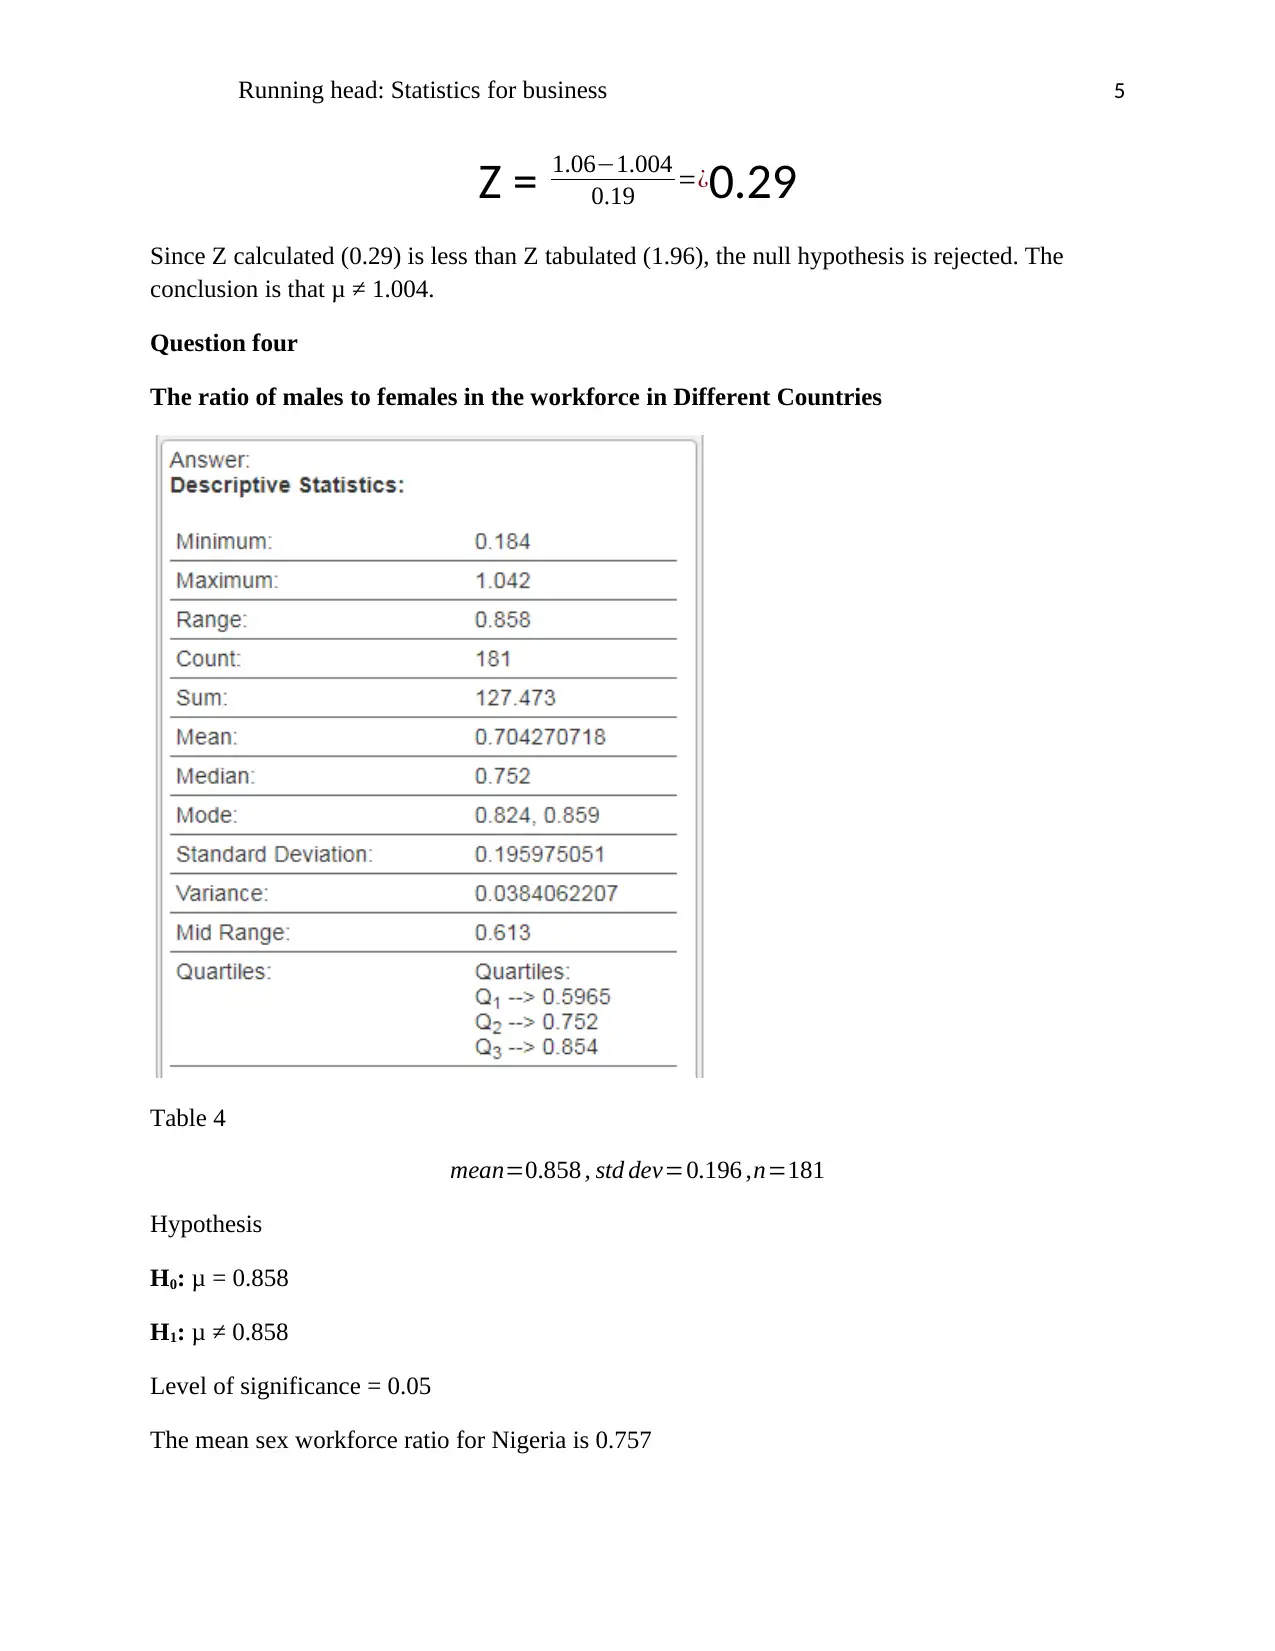
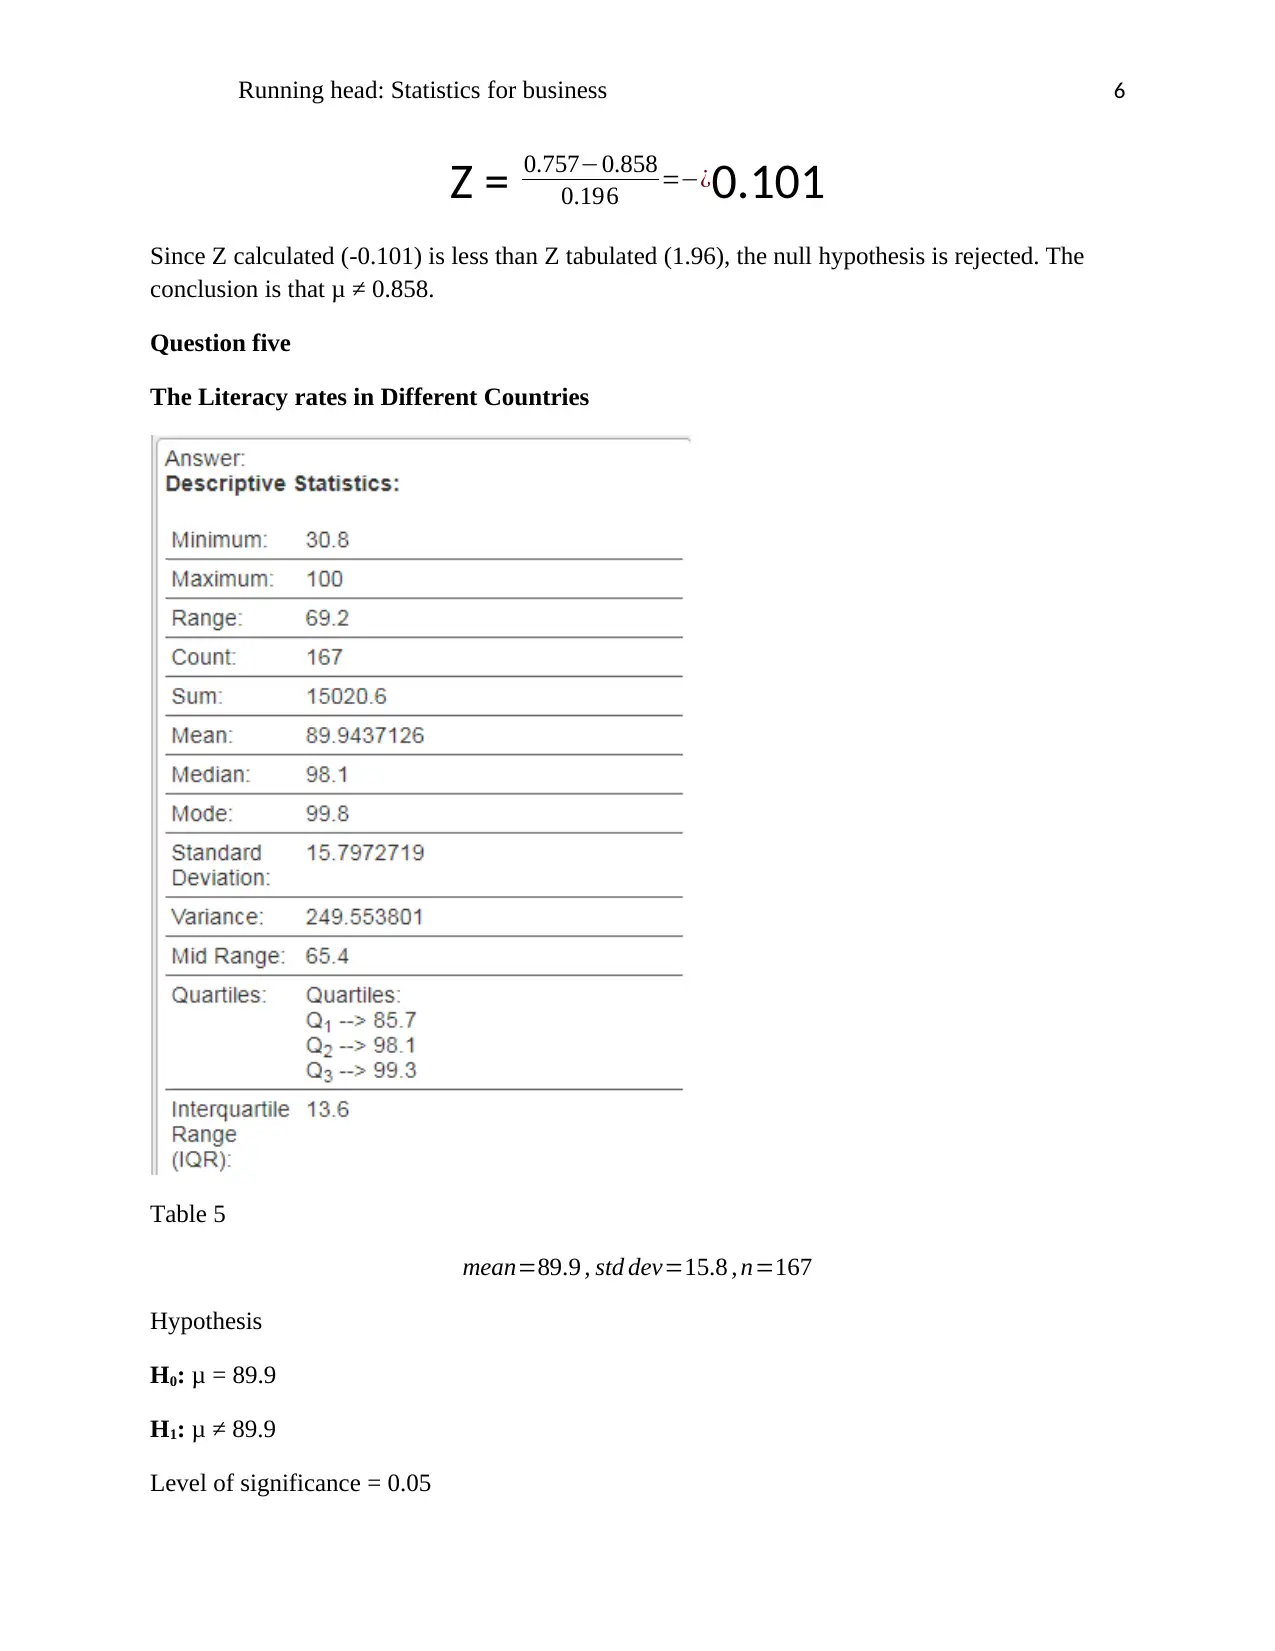
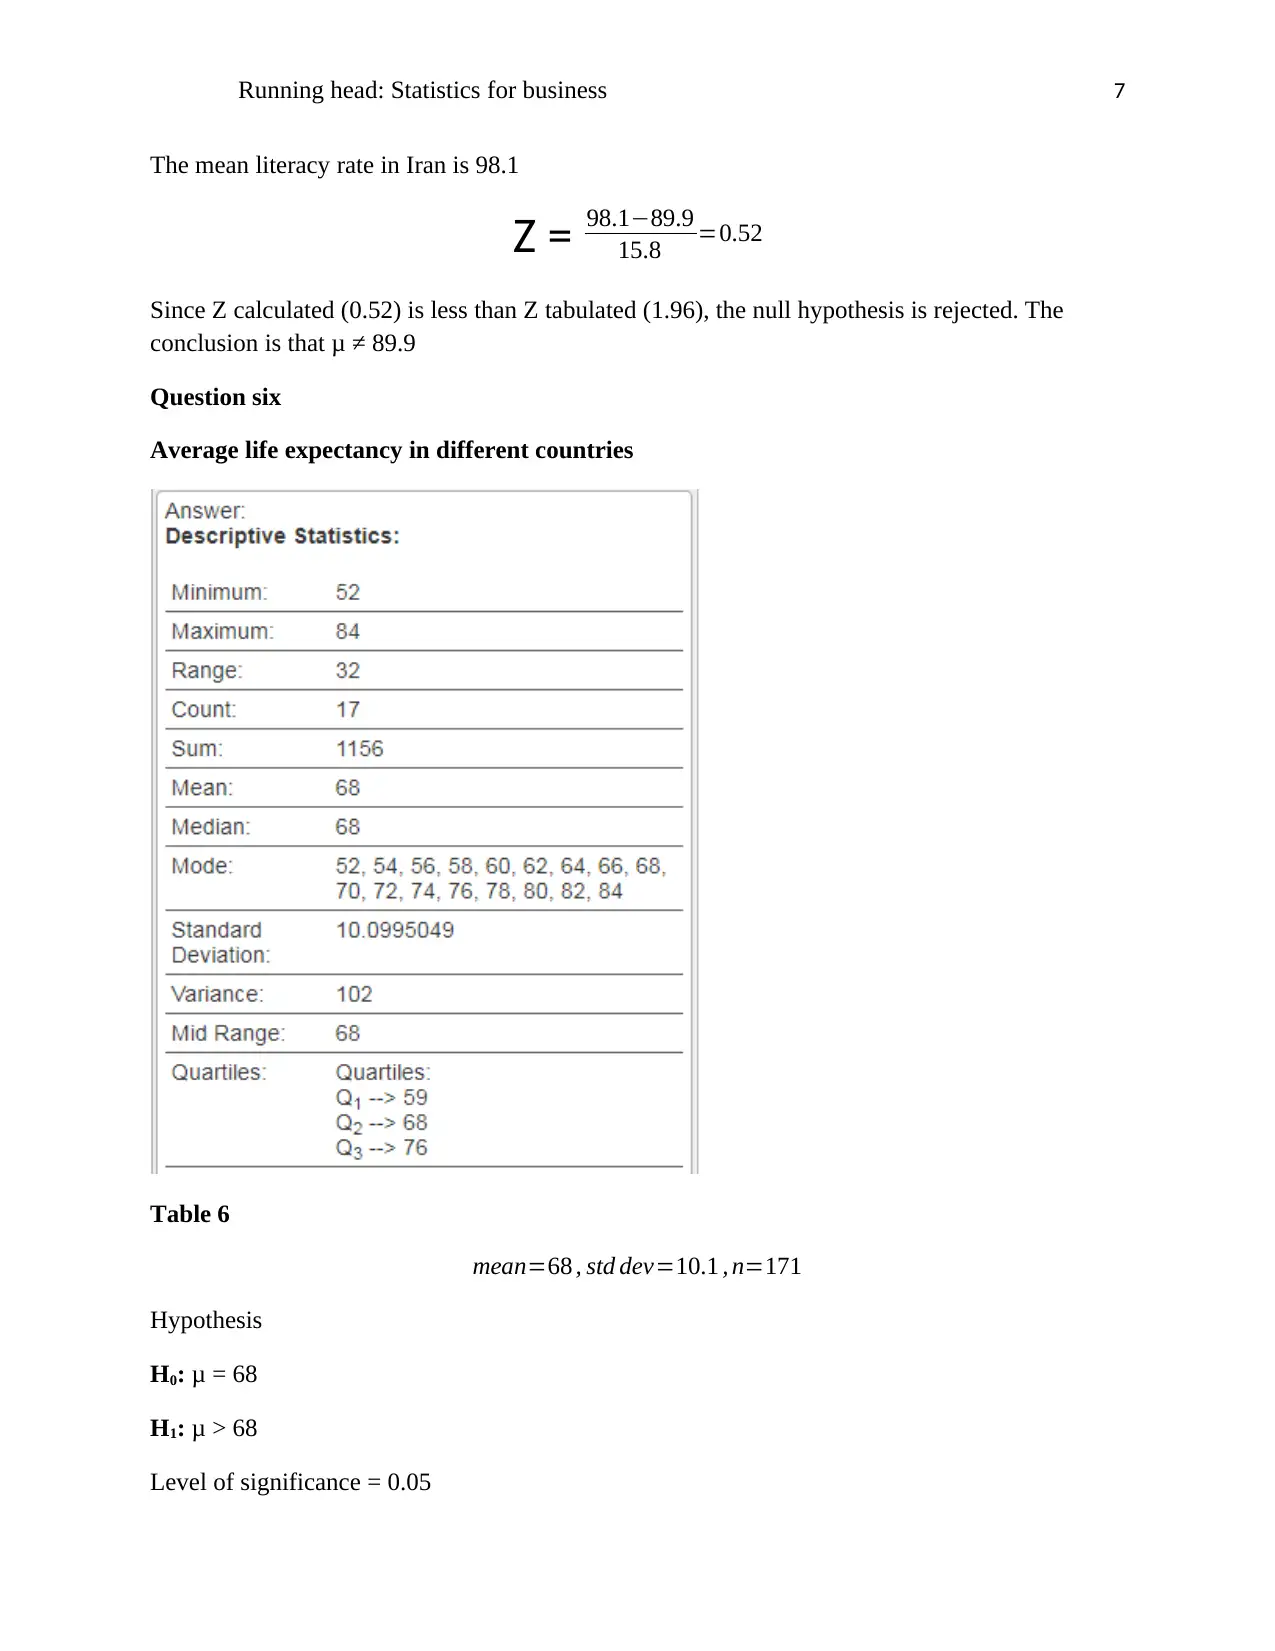
This case study analyzes the median age of populations in various countries, focusing on hypothesis testing and statistical analysis. The assignment calculates the mean and standard deviation of median ages using data from a provided source. The student selects a country with a significantly different median age and researches the factors contributing to this difference. The analysis involves formulating null and alternative hypotheses, calculating Z-scores, and drawing conclusions based on the level of significance. The study examines several datasets, including body mass index (BMI), sex ratios, workforce demographics, and literacy rates, to perform hypothesis testing and compare the results with the average values. Each analysis includes the hypothesis, level of significance, and conclusions based on the Z-score calculation. The assignment explores the relationship between statistical data and real-world factors like life expectancy and quality of life in different countries. The conclusion is drawn based on the comparison of calculated and tabulated Z values.
Document Page
Running head: Statistics for business 1
Statistics for business
Course code
Student
Tutor
tabler-icon-diamond-filled.svg

Paraphrase This Document

Need a fresh take? Get an instant paraphrase of this document with our AI Paraphraser
Document Page
Running head: Statistics for business 2
Question one
Mean and standard deviation of median age of people in different countries
Table 1
mean=30.74 , std dev =8.89 , n=230
Hypothesis
H0: μ = 30.74
H1: μ > 30.74
Level of significance = 0.05
The mean median age for Austria is 44 years
Z = 4430.74
8.89 =1.49
Since Z calculated (1.49) is less than Z tabulated (1.645), the null hypothesis is rejected. The
conclusion is that μ > 30.74.
Document Page
Running head: Statistics for business 3
Australia has got a larger mean median age that the populations’ mean. Her median age is 1.49
standard deviations above the mean. This could be explained by the fact that life expectancy in
Australia is generally high compared to the other countries.
Question two
Body mass index (BMI)
Table 2
mean=25.67 , std dev=2.33, n=19 0
Hypothesis
H0: μ = 25.67
H1: μ > 25.67
Level of significance = 0.05
The median BMI for Belgium is 25.5
Z = 25.525.67
2.33 =0.07
Document Page
Running head: Statistics for business 4
Since Z calculated (-0.07) is less than Z tabulated (1.645), the null hypothesis is rejected. The
conclusion is that μ > 25.67.
The BMI for Belgium is just 0.07 standard deviations below the mean BMI. This means that the
population in Belgium in general has normal BMI. It is neither so skewed to the left nor skewed
to the right.
Question three
The Boy births as a ratio of boy/ girl births in Different Countries
Table 3
mean=1.004 , std dev=0.19 ,n=229
Hypothesis
H0: μ = 1.004
H1: μ ≠ 1.004
Level of significance = 0.05
The median sex ratio for China is 1.06
tabler-icon-diamond-filled.svg

Paraphrase This Document

Need a fresh take? Get an instant paraphrase of this document with our AI Paraphraser
Document Page
Running head: Statistics for business 5
Z = 1.061.004
0.19 =¿0.29
Since Z calculated (0.29) is less than Z tabulated (1.96), the null hypothesis is rejected. The
conclusion is that μ ≠ 1.004.
Question four
The ratio of males to females in the workforce in Different Countries
Table 4
mean=0.858 , std dev=0.196 ,n=181
Hypothesis
H0: μ = 0.858
H1: μ ≠ 0.858
Level of significance = 0.05
The mean sex workforce ratio for Nigeria is 0.757
Document Page
Running head: Statistics for business 6
Z = 0.7570.858
0.196 =¿0.101
Since Z calculated (-0.101) is less than Z tabulated (1.96), the null hypothesis is rejected. The
conclusion is that μ ≠ 0.858.
Question five
The Literacy rates in Different Countries
Table 5
mean=89.9 , std dev=15.8 , n=167
Hypothesis
H0: μ = 89.9
H1: μ ≠ 89.9
Level of significance = 0.05
Document Page
Running head: Statistics for business 7
The mean literacy rate in Iran is 98.1
Z = 98.189.9
15.8 =0.52
Since Z calculated (0.52) is less than Z tabulated (1.96), the null hypothesis is rejected. The
conclusion is that μ ≠ 89.9
Question six
Average life expectancy in different countries
Table 6
mean=68 , std dev=10.1 , n=171
Hypothesis
H0: μ = 68
H1: μ > 68
Level of significance = 0.05
tabler-icon-diamond-filled.svg

Paraphrase This Document

Need a fresh take? Get an instant paraphrase of this document with our AI Paraphraser
Document Page
Running head: Statistics for business 8
The mean life expectancy in Portugal is 81.9 years
Z = 8 1.968
10.1 =1.38
Since Z calculated (-0.79) is less than Z tabulated (1.645), the null hypothesis is rejected. The
conclusion is that μ > 68
The mean life expectancy in Portugal has been found to be 81.9. This is 1.38 standard deviations
above the mean. This high life expectancy can be explained by better quality of life in Portugal.
Better quality of life can be measured by better healthcare and good economic growth which
raises per capita income of the country.
chevron_up_icon
1 out of 8
circle_padding
hide_on_mobile
zoom_out_icon
[object Object]