HI6007 Group Assignment: Analysis of Regression Model Statistics

Verified

Added on  2023/05/29

|5
|727
|480
Homework Assignment
AI Summary
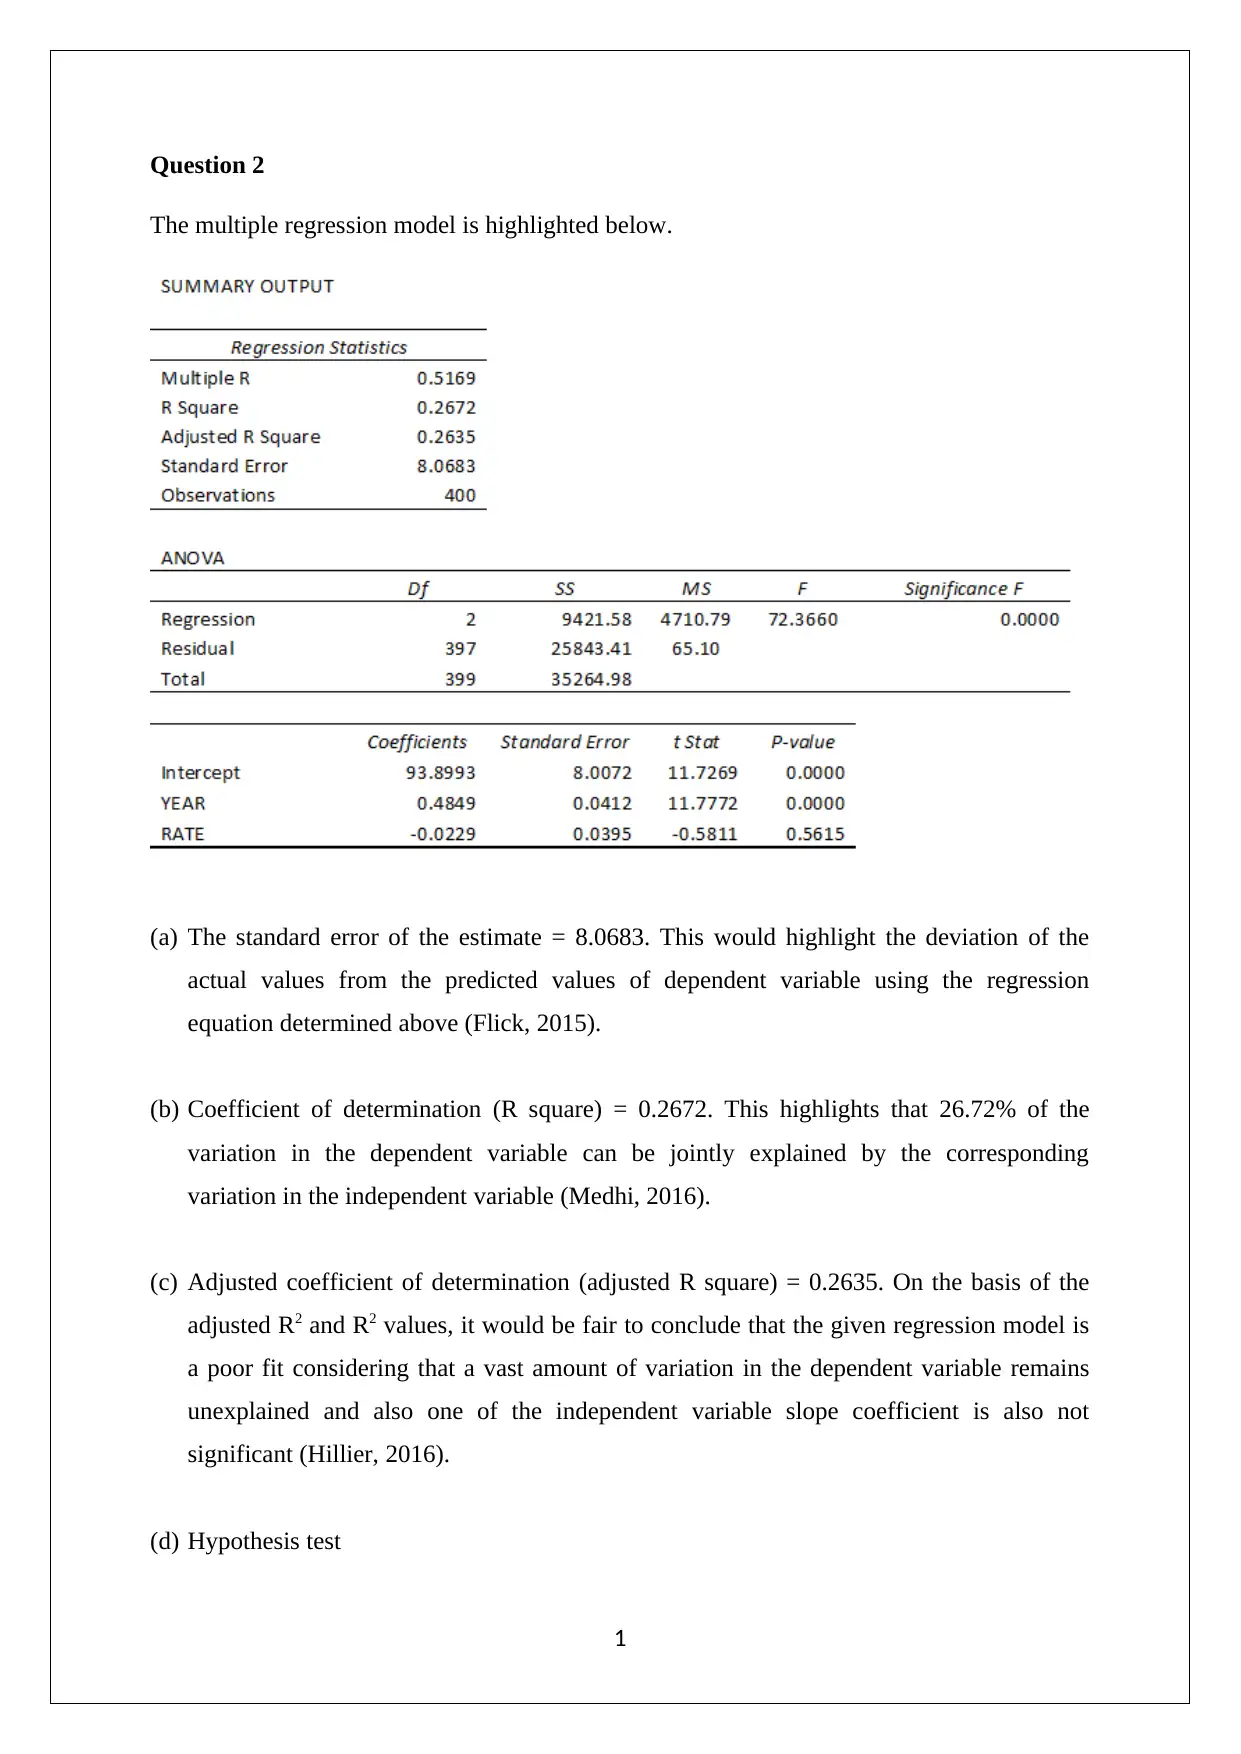
This assignment solution focuses on a multiple regression model, analyzing key statistical components such as the standard error of the estimate, the coefficient of determination (R-squared), and the adjusted coefficient of determination. The solution provides interpretations of these values, explaining the variance explained by the model. Furthermore, the assignment delves into hypothesis testing, including null and alternative hypotheses, test statistics (F-stat), and p-values to determine the significance of the model and individual slope coefficients. The interpretation of the slope coefficients for independent variables is also presented, along with conclusions regarding the linear relationships between variables. References to relevant statistical literature are included to support the analysis and findings.
tabler-icon-diamond-filled.svg

Contribute Materials

Your contribution can guide someone’s learning journey. Share your documents today.
Document Page
STATISTICS FOR BUSINESS DECISIONS
STUDENT ID:
[Pick the date]
tabler-icon-diamond-filled.svg

Secure Best Marks with AI Grader

Need help grading? Try our AI Grader for instant feedback on your assignments.
Document Page
Question 2
The multiple regression model is highlighted below.
(a) The standard error of the estimate = 8.0683. This would highlight the deviation of the
actual values from the predicted values of dependent variable using the regression
equation determined above (Flick, 2015).
(b) Coefficient of determination (R square) = 0.2672. This highlights that 26.72% of the
variation in the dependent variable can be jointly explained by the corresponding
variation in the independent variable (Medhi, 2016).
(c) Adjusted coefficient of determination (adjusted R square) = 0.2635. On the basis of the
adjusted R2 and R2 values, it would be fair to conclude that the given regression model is
a poor fit considering that a vast amount of variation in the dependent variable remains
unexplained and also one of the independent variable slope coefficient is also not
significant (Hillier, 2016).
(d) Hypothesis test
1
Document Page
Null hypothesis H0: β1 2 = 0 which implies that both slope coefficients can be assumed as
zero.
Alternative hypothesis Ha: Atleast one of the slope coefficients is non-zero.
On the basis of the table shown, the following relevant information may be retrieved.
The test statistics (F stat) =4710.79/65.10 = 72.3360
The p value (Significance F) = 0.00
Assuming significance level = 5%
It can be said from the above that p value is lower than significance level and hence,
sufficient evidence is available to reject the null hypothesis and to accept the alternative
hypothesis (Hair et. al., 2015). Therefore, it can be concluded that model is significant as
atleast one of the slope coefficients is significant.
(e) Interpretation of the coefficient
Slope coefficient (X1): It implies that as the height of the father would increase by 1 unit, the
corresponding height of son would increase by 0.48 units.
Slope coefficient (X2): It implies that as the height of the mother would increase by 1 unit,
the corresponding height of son would decrease by 0.02 units.
f) The relevant hypotheses are stated below.
H0: β1= 0
H1: β1≠ 0
It is apparent from the table given above that the slope coefficient of independent variable X1
is significant considering the fact that the relevant p value of the slope coefficient is 0.0000
and hence would be lower than the assumed level of significant (Eriksson and Kovalainen,
2015). Hence, H0 is rejected and H1 accepted.
Hence, it may be concluded that lengths of the sons and the fathers are linearly related.
2
Document Page
g) The relevant hypotheses are stated below.
H0: β2= 0
H1: β2≠ 0
It is apparent from the table given above that the slope coefficient of independent variable X2
is not significant considering the fact that the relevant p value of the slope coefficient is
0.5615 and hence would be higher than the assumed level of significant (Flick, 2015). Hence,
H0 is not rejected and H1 not accepted.
Hence, it may be concluded that lengths of the sons and the mothers is not linearly related.
3
tabler-icon-diamond-filled.svg

Secure Best Marks with AI Grader

Need help grading? Try our AI Grader for instant feedback on your assignments.
Document Page
References
Eriksson, P. and Kovalainen, A. (2015) Quantitative methods in business research. 3rd ed.
London: Sage Publications.
Flick, U. (2015) Introducing research methodology: A beginner's guide to doing a research
project. 4th ed. New York: Sage Publications.
Hair, J. F., Wolfinbarger, M., Money, A. H., Samouel, P., and Page, M. J. (2015) Essentials
of business research methods. 2nd ed. New York: Routledge.
Hillier, F. (2016) Introduction to Operations Research. 6th ed. New York: McGraw Hill
Publications.
Medhi, J. (2016) Statistical Methods: An Introductory Text. 4th ed. Sydney: New Age
International.
4
chevron_up_icon
1 out of 5
circle_padding
hide_on_mobile
zoom_out_icon
logo.png

Your All-in-One AI-Powered Toolkit for Academic Success.

Available 24*7 on WhatsApp / Email

[object Object]