Business Statistics Report: Product Sales Analysis

Verified

Added on  2023/01/23

|9
|1178
|29
Report
AI Summary
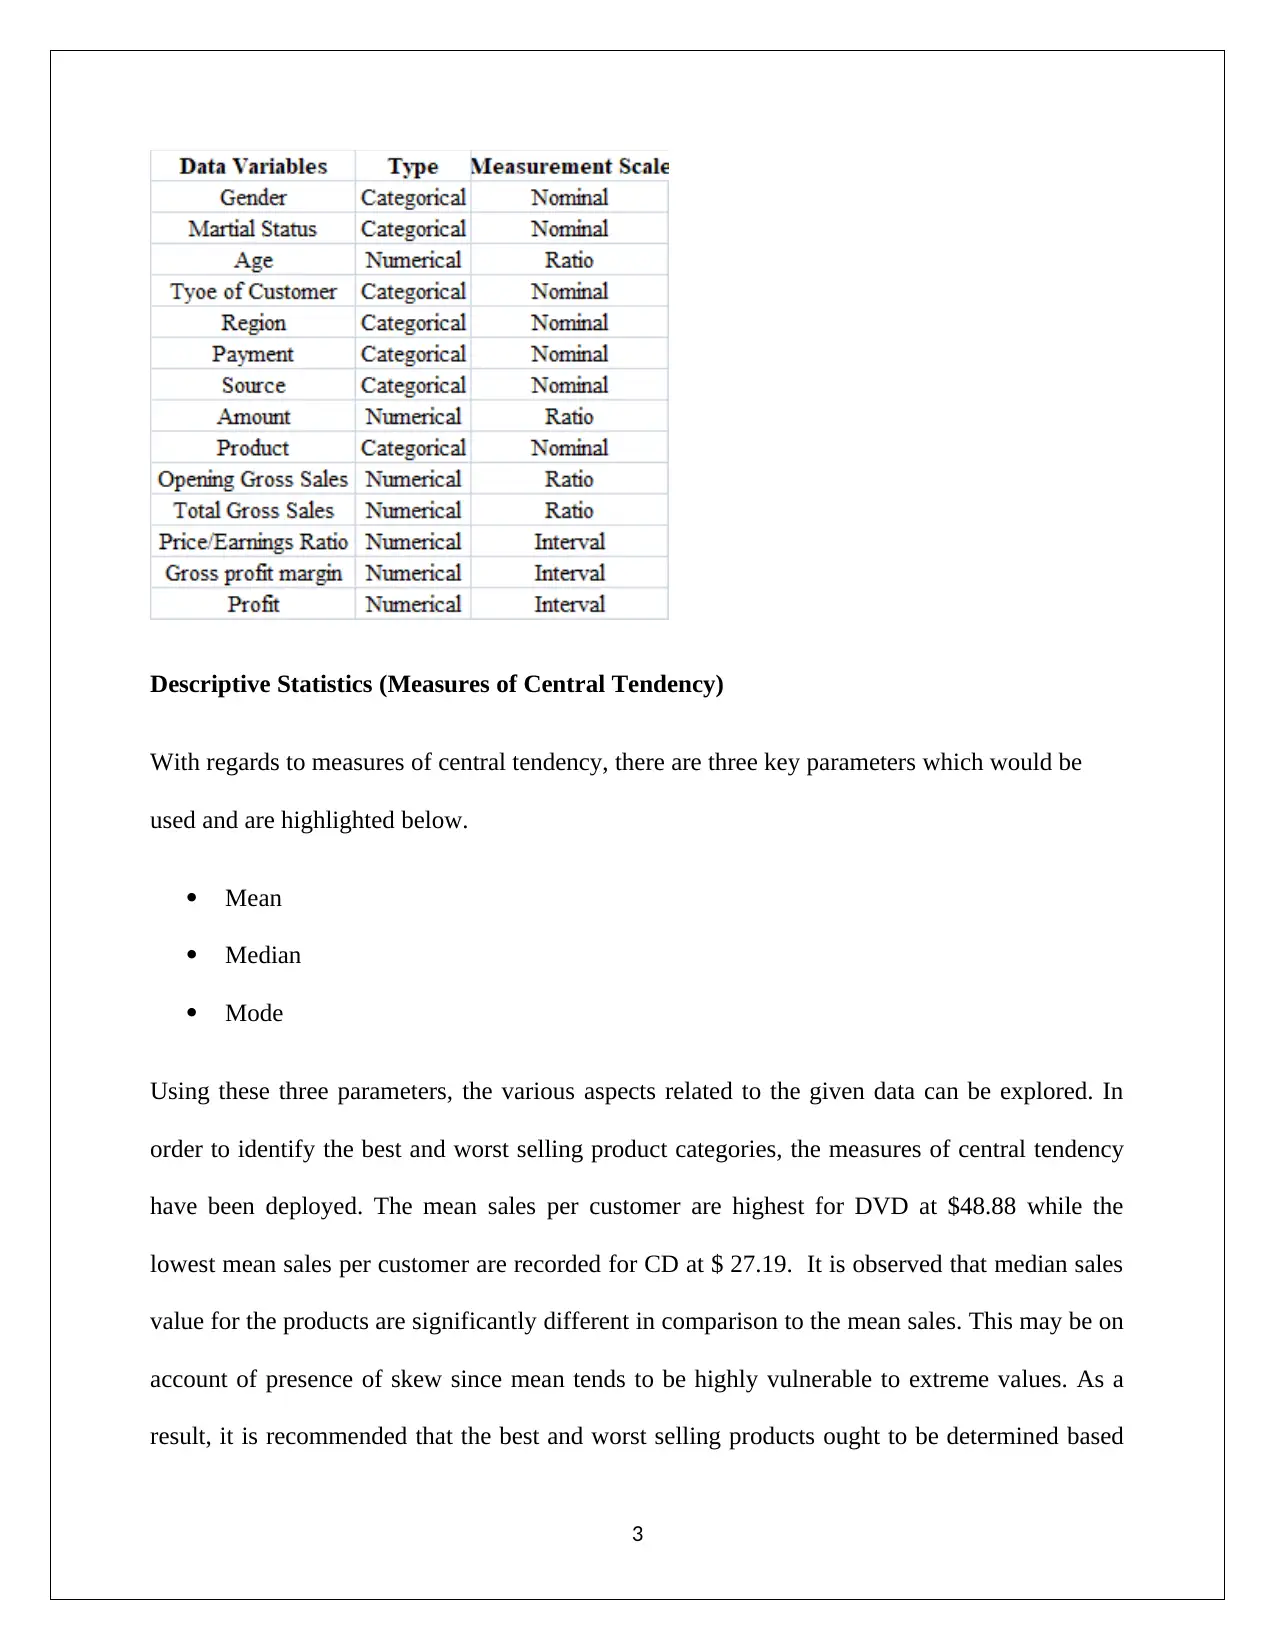
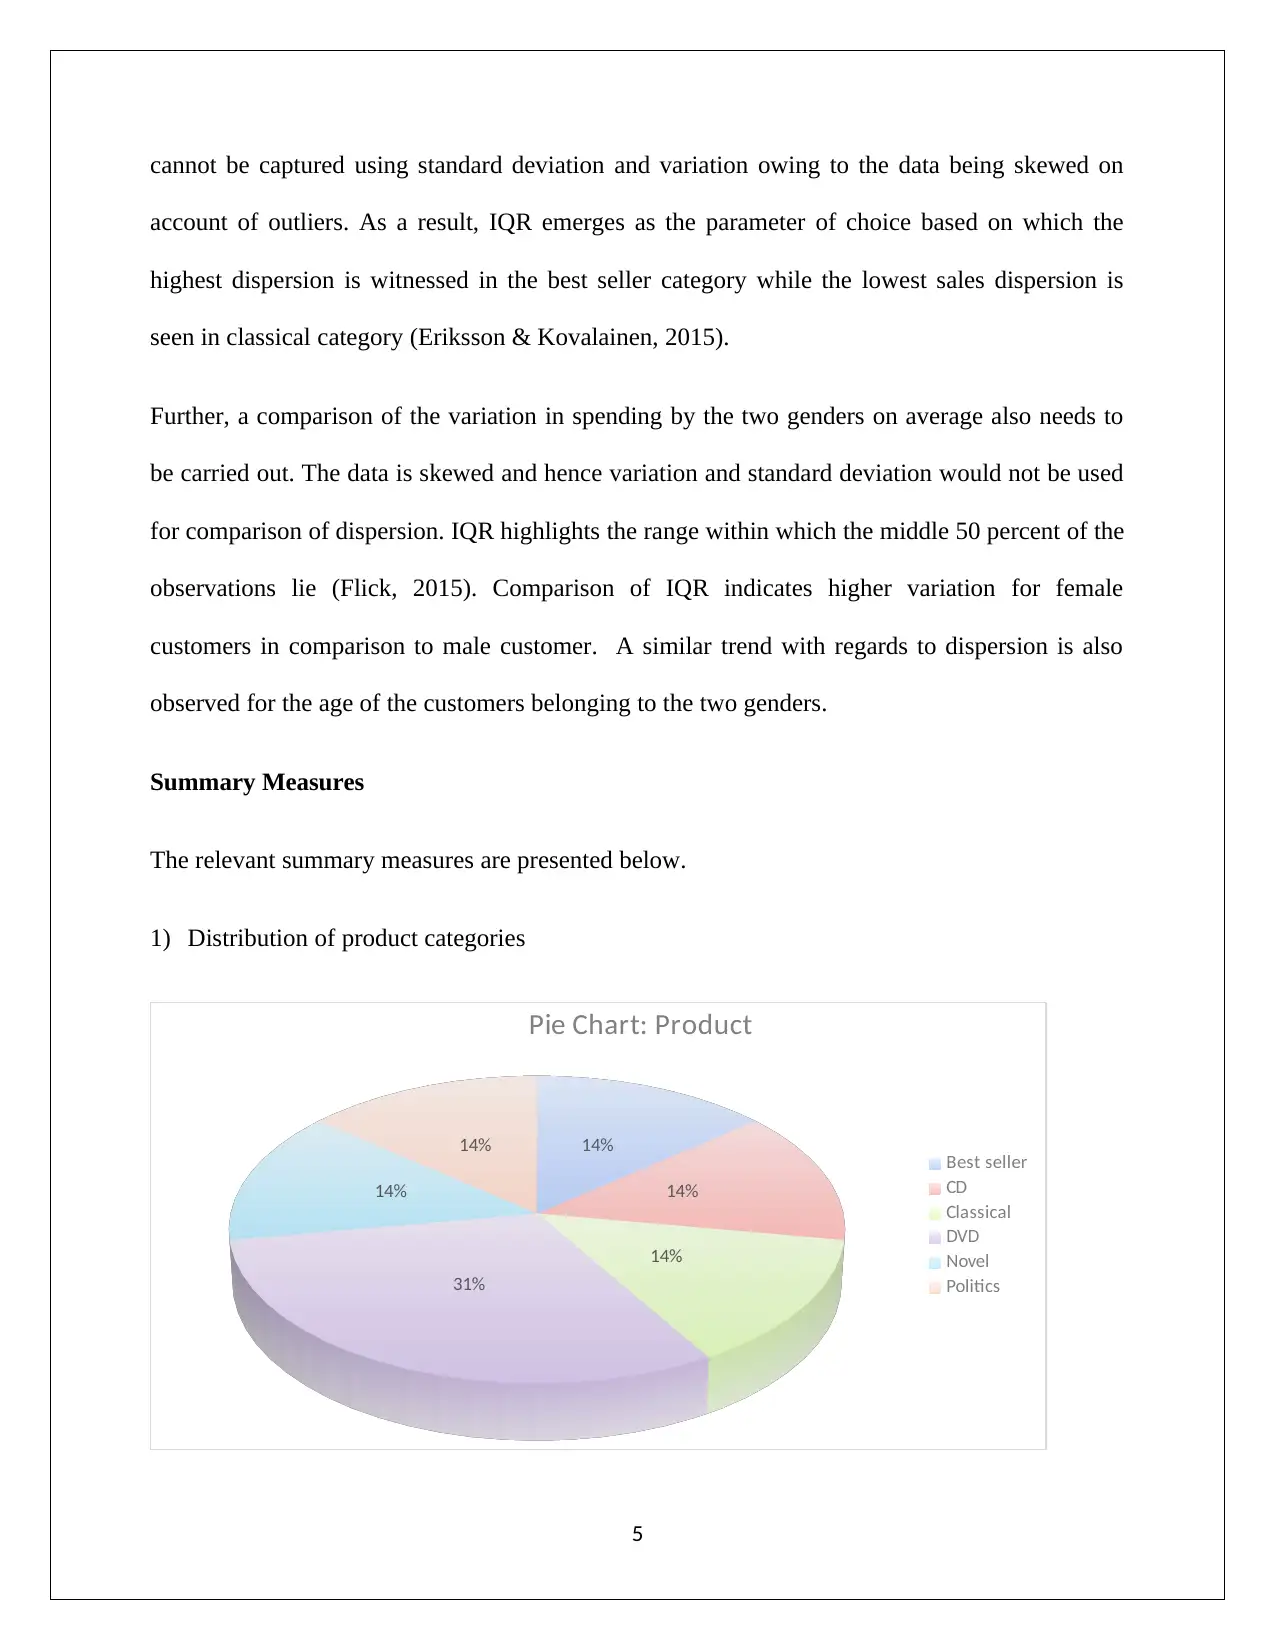
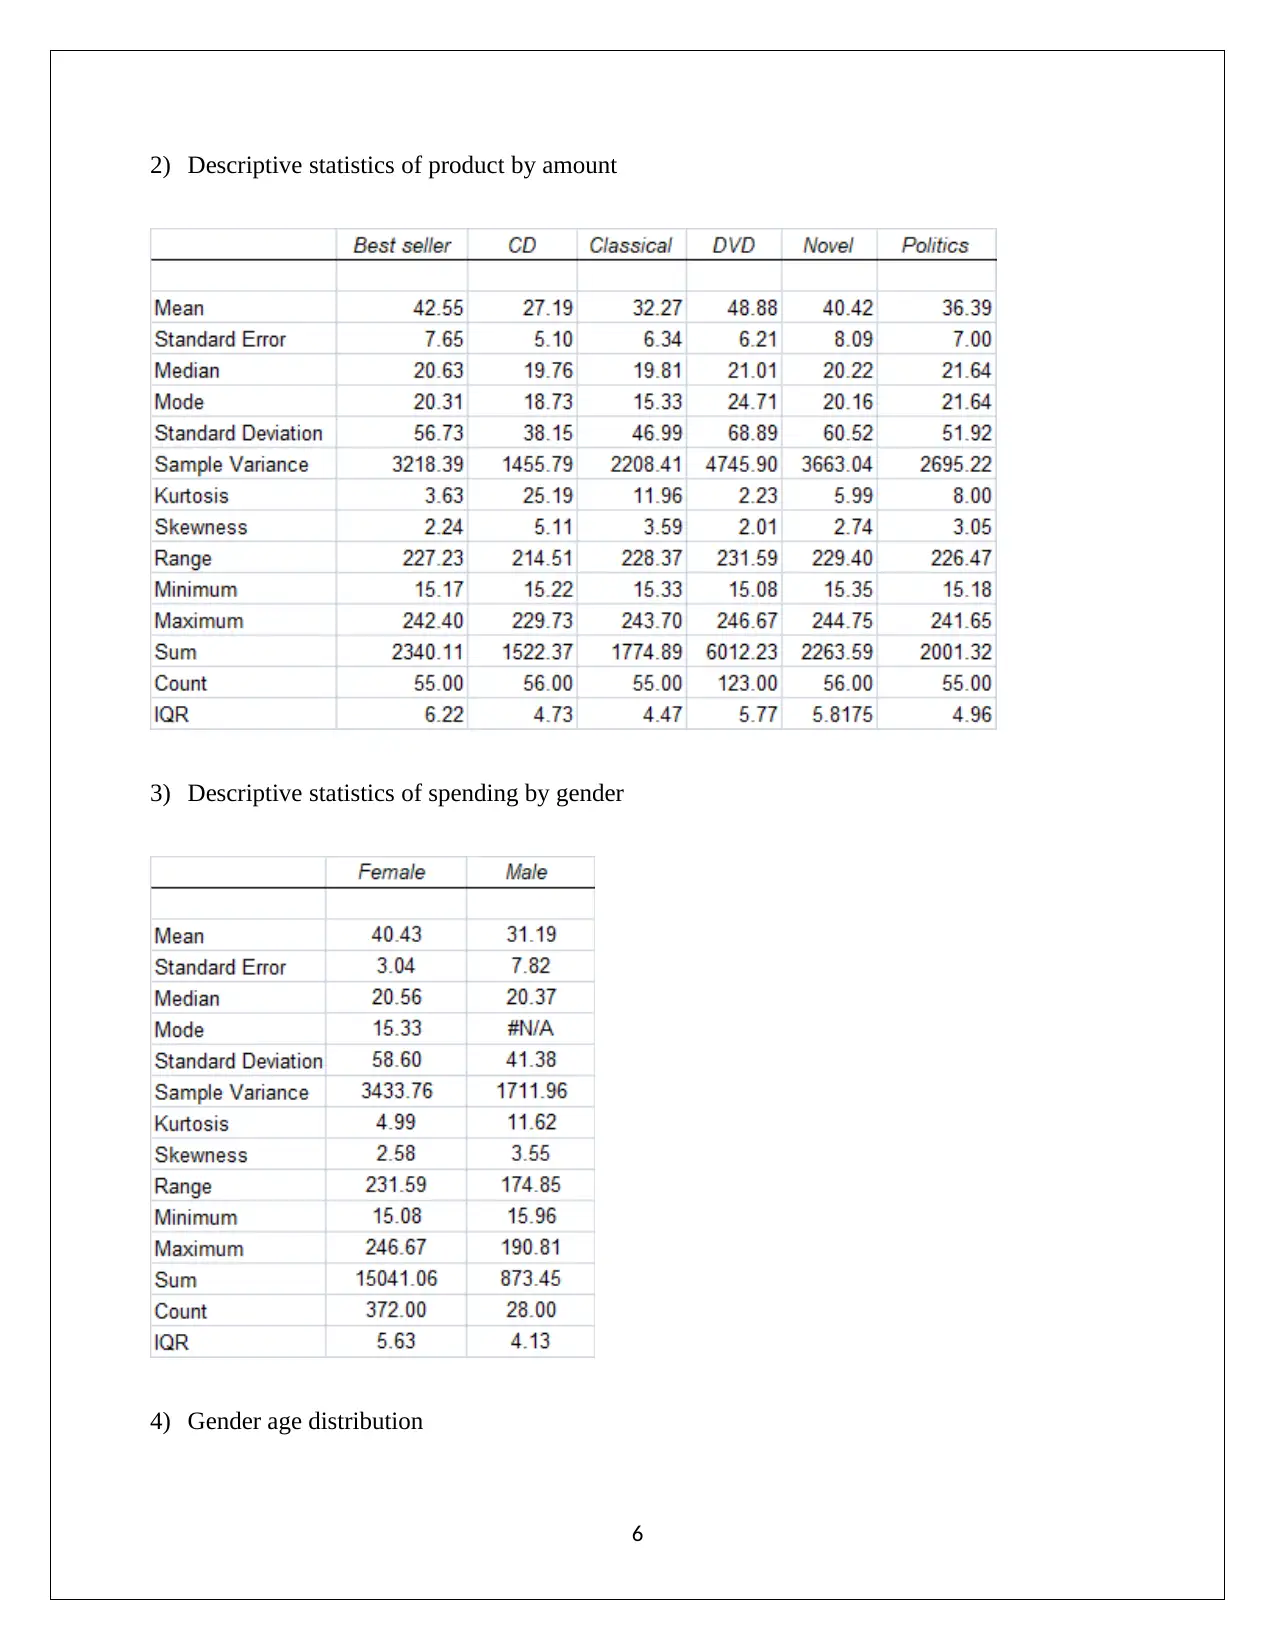
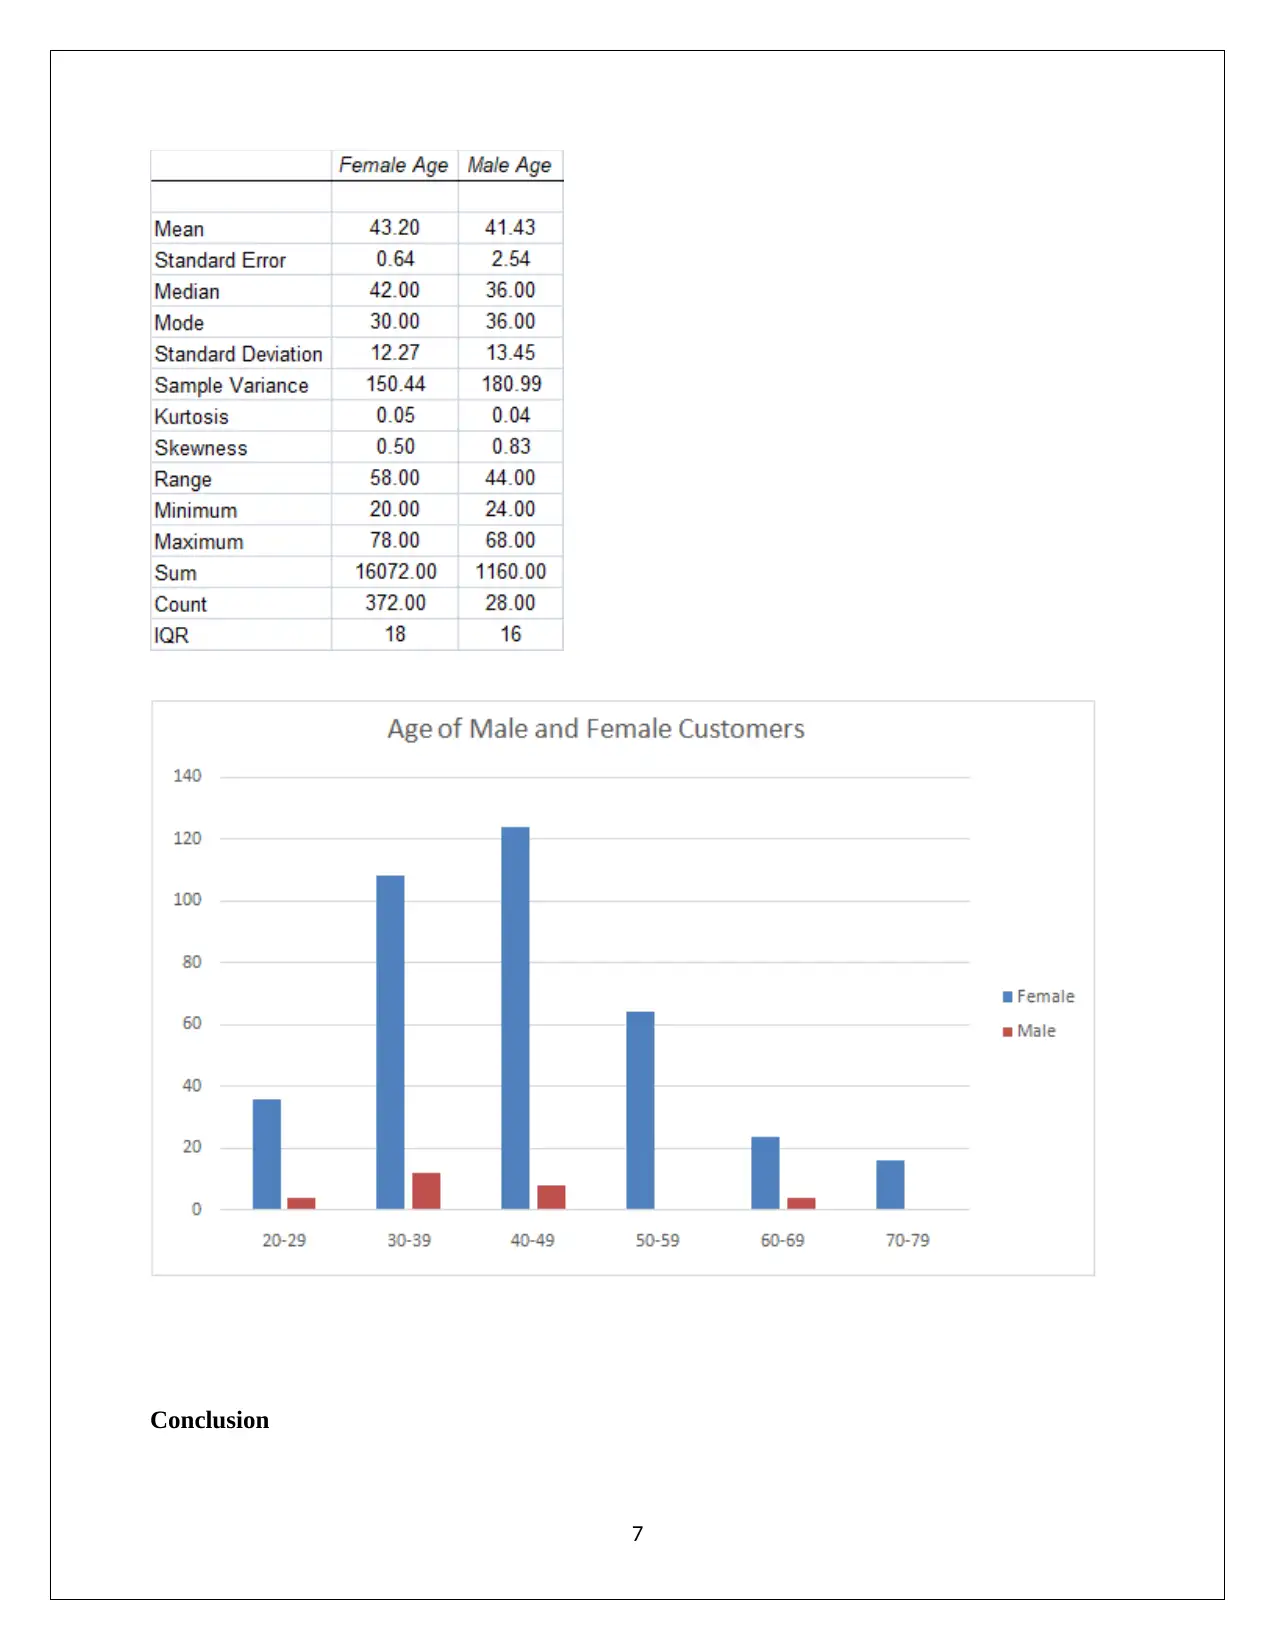
This report presents an analysis of sales data from a global corporation selling books, CDs, and DVDs. The primary objective is to identify the best and worst-selling product categories and understand the influence of customer attributes on sales. The analysis utilizes measures of central tendency (mean, median, mode) and measures of dispersion (range, standard deviation, variation, IQR) to evaluate sales performance across 400 days and different customer demographics. The report compares sales by product category, gender, and age, concluding that politics is the best-selling product, while CDs are the worst. The median is preferred over the mean due to data skewness, and IQR is used to measure dispersion. The report finds that female customers have higher median spending and a wider IQR in spending and age compared to male customers. Pie charts and descriptive statistics are used to present the findings, providing insights for inventory rationalization and marketing strategy adjustments.
Document Page
BUSINESS STATISTICS
STUDENT ID:
[Pick the date]
tabler-icon-diamond-filled.svg

Paraphrase This Document

Need a fresh take? Get an instant paraphrase of this document with our AI Paraphraser
Document Page
Introduction
Data has been provided which pertains to a global corporation which is dealing in the sale of
multiple products such as books, CD, DVD. One component of the data comprises of sales
details on 400 days while the other component of data deals with the customer attributes. The
key business problem is to utilize the sales data in order to identify the best and worst selling
product categories. Also, the influence of the difference customer attributes on sales need to be
understood based on the given data.
Problem Definition and Business Intelligence Required
The corporation wants to analyse the data to identify key trends with regards to sale of different
products which would allow the corporation to rationalize the inventory going forward.
Additionally, it also intends to understand the influence of key customer attributes on the product
sale. This could enable the company to alter the marketing strategy so as to maximize sales. With
regards to analyzing the given data, the measures of central tendency and measures of variable
have been used. For instance, to highlight the impact of gender on sales trend, the average sales
of the two genders may be compared. Further, the sales performance of the different products has
also been compared over the 400 days using requisite measures of central tendency and
dispersion. Also, the age trends of customers across the gender have been analysed to enable
consumer profiling.
Data Variables and Data Types
The type of the data variables present along with the measurement scale used information is
presented below.
2
Document Page
Descriptive Statistics (Measures of Central Tendency)
With regards to measures of central tendency, there are three key parameters which would be
used and are highlighted below.
Mean
Median
Mode
Using these three parameters, the various aspects related to the given data can be explored. In
order to identify the best and worst selling product categories, the measures of central tendency
have been deployed. The mean sales per customer are highest for DVD at $48.88 while the
lowest mean sales per customer are recorded for CD at $ 27.19. It is observed that median sales
value for the products are significantly different in comparison to the mean sales. This may be on
account of presence of skew since mean tends to be highly vulnerable to extreme values. As a
result, it is recommended that the best and worst selling products ought to be determined based
3
Document Page
on the median sales which are not susceptible to being influenced by extreme values (Flick,
2015). The highest median sales per customer are observed for politics at $21.64 while the
lowest median sales per customer are recorded for CD at $ 19.76. The mode highlights the
highest frequency but same cannot be used for comparison (Hillier, 2016).
Additionally, a comparison between male and female sales is also facilitated through measures of
central tendency. Considering that mean sales for both gender is significantly different from
median sales, hence median sales figure would be used to compare whether average sales across
gender is significantly different or not. In this regards, the median sales of female customers at
$20.56 is marginally higher than the corresponding value for male customers at $20.37. Further,
a comparison of the average age of the customers by gender has been carried. Using the median
age as the underlying benchmark, it can be concluded that age of female customers is
significantly higher in comparison to males.
Descriptive Statistics (Measures of dispersion)
The various measures of dispersion that have been considered are indicated as follows (Hastie,
Tibshirani & Friedman, 2014).
Range
Standard Deviation
Variation
Interquartile range (IQR)
It is noteworthy that in the context of skewed data, IQR is preferable over standard deviation as
the latter tends to be adversely impacted by extreme values and thereby presents a distorted
outcome. With regards to the sale of the different product categories, the dispersion in the data
4
tabler-icon-diamond-filled.svg

Paraphrase This Document

Need a fresh take? Get an instant paraphrase of this document with our AI Paraphraser
Document Page
cannot be captured using standard deviation and variation owing to the data being skewed on
account of outliers. As a result, IQR emerges as the parameter of choice based on which the
highest dispersion is witnessed in the best seller category while the lowest sales dispersion is
seen in classical category (Eriksson & Kovalainen, 2015).
Further, a comparison of the variation in spending by the two genders on average also needs to
be carried out. The data is skewed and hence variation and standard deviation would not be used
for comparison of dispersion. IQR highlights the range within which the middle 50 percent of the
observations lie (Flick, 2015). Comparison of IQR indicates higher variation for female
customers in comparison to male customer. A similar trend with regards to dispersion is also
observed for the age of the customers belonging to the two genders.
Summary Measures
The relevant summary measures are presented below.
1) Distribution of product categories
14%
14%
14%
31%
14%
14%
Pie Chart: Product
Best seller
CD
Classical
DVD
Novel
Politics
5
Document Page
2) Descriptive statistics of product by amount
3) Descriptive statistics of spending by gender
4) Gender age distribution
6
Document Page
Conclusion
7
tabler-icon-diamond-filled.svg

Paraphrase This Document

Need a fresh take? Get an instant paraphrase of this document with our AI Paraphraser
Document Page
Based on the above analysis, it may be concluded that the selling product is politics while the
worst selling product is CD. Further, the mean spending does not seem to differ significantly by
gender. Also, with regards to age, the median age of female customers is found to be higher than
the male customers. The extent of skew in different data variables is quite high owing to which
median has been preferred as the measure of central tendency and IQR for dispersion. The IQR
in terms of spending and age has been found to be higher for female customers.
8
Document Page
References
Eriksson, P. & Kovalainen, A. (2015). Quantitative methods in business research (3rded.).
London: Sage Publications.
Flick, U. (2015). Introducing research methodology: A beginner's guide to doing a research
project (4thed.). New York: Sage Publications.
Hastie, T., Tibshirani, R. & Friedman, J. (2016). The Elements of Statistical Learning
(4thed.). New York: Springer Publications.
Hillier, F. (2016).Introduction to Operations Research.(6thed.). New York: McGraw Hill
Publications.
9
chevron_up_icon
1 out of 9
circle_padding
hide_on_mobile
zoom_out_icon
[object Object]