STA101: Statistics for Business - Sales and Advertising Report
VerifiedAdded on  2022/10/11
|7
|811
|15
Report
AI Summary
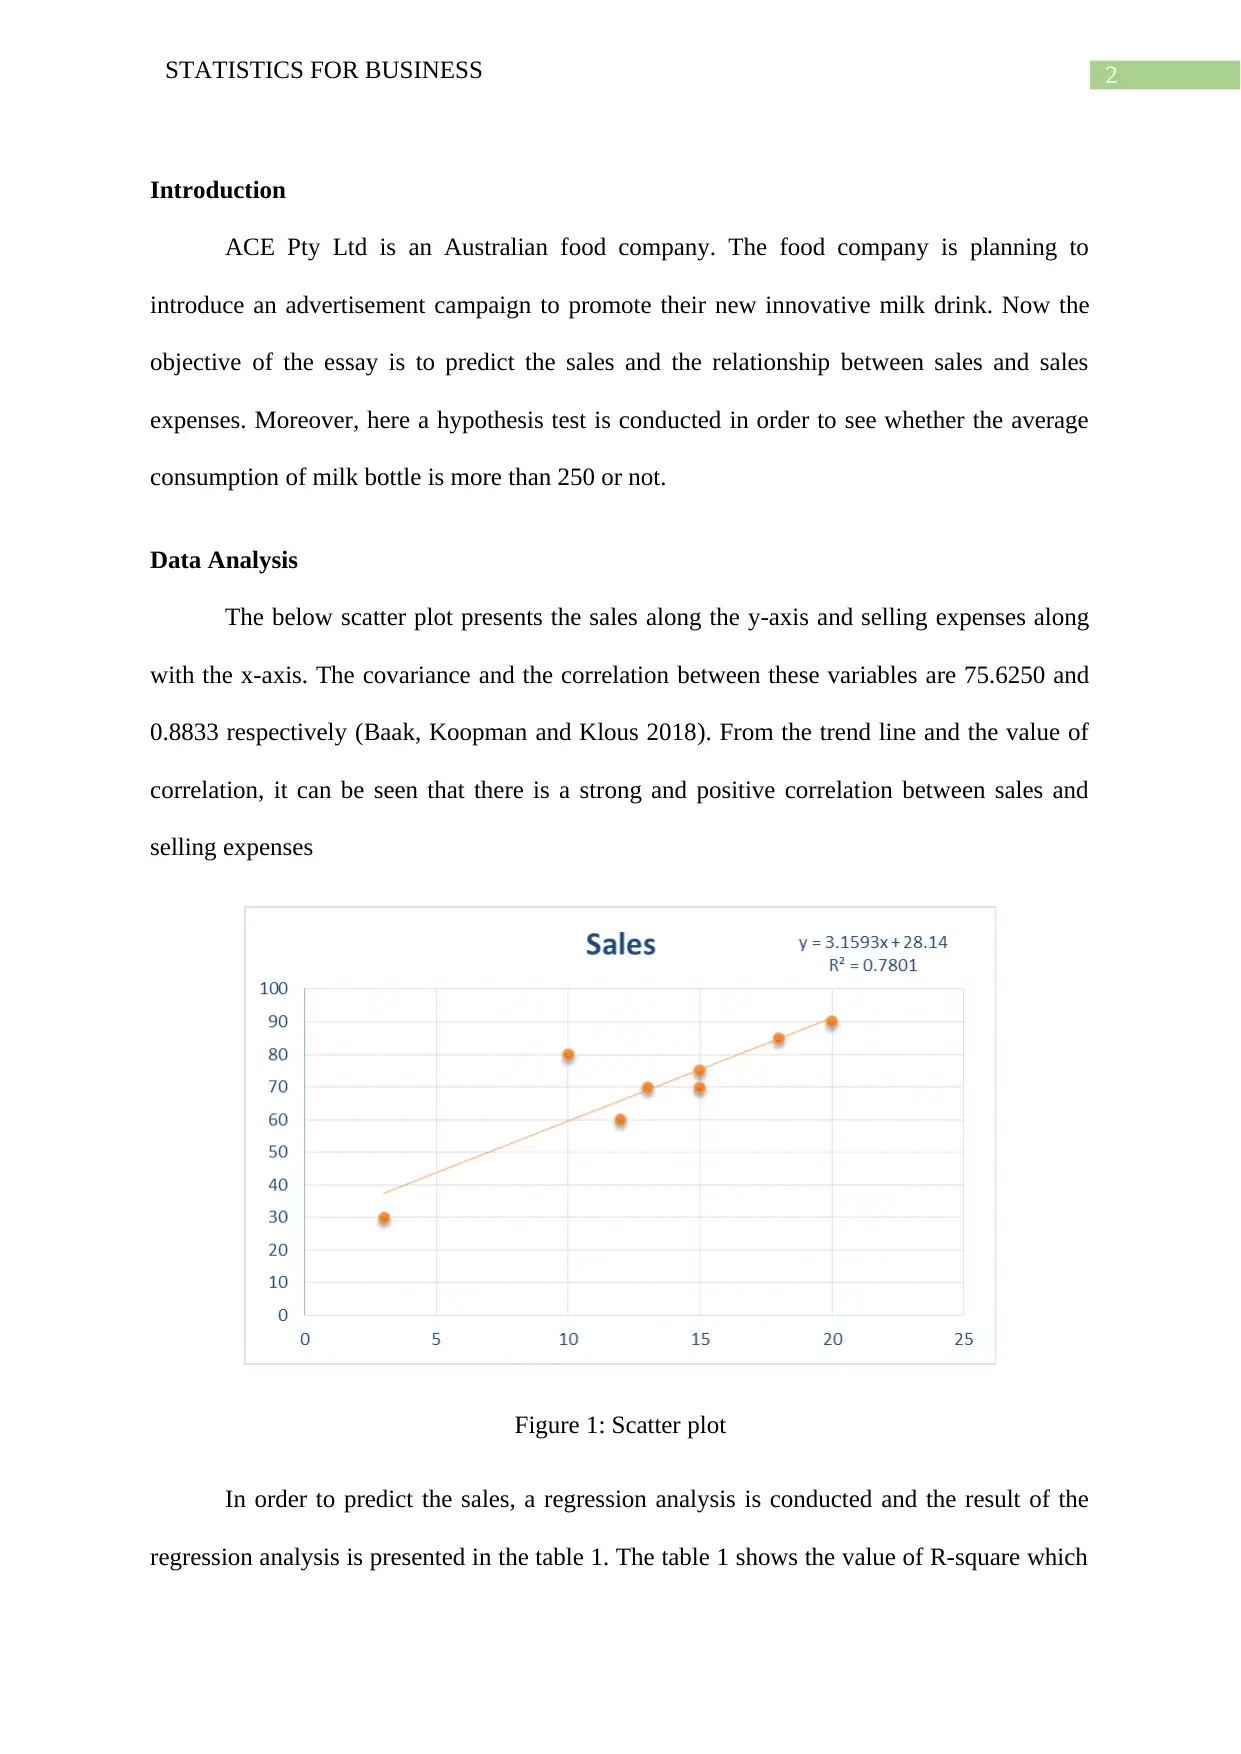
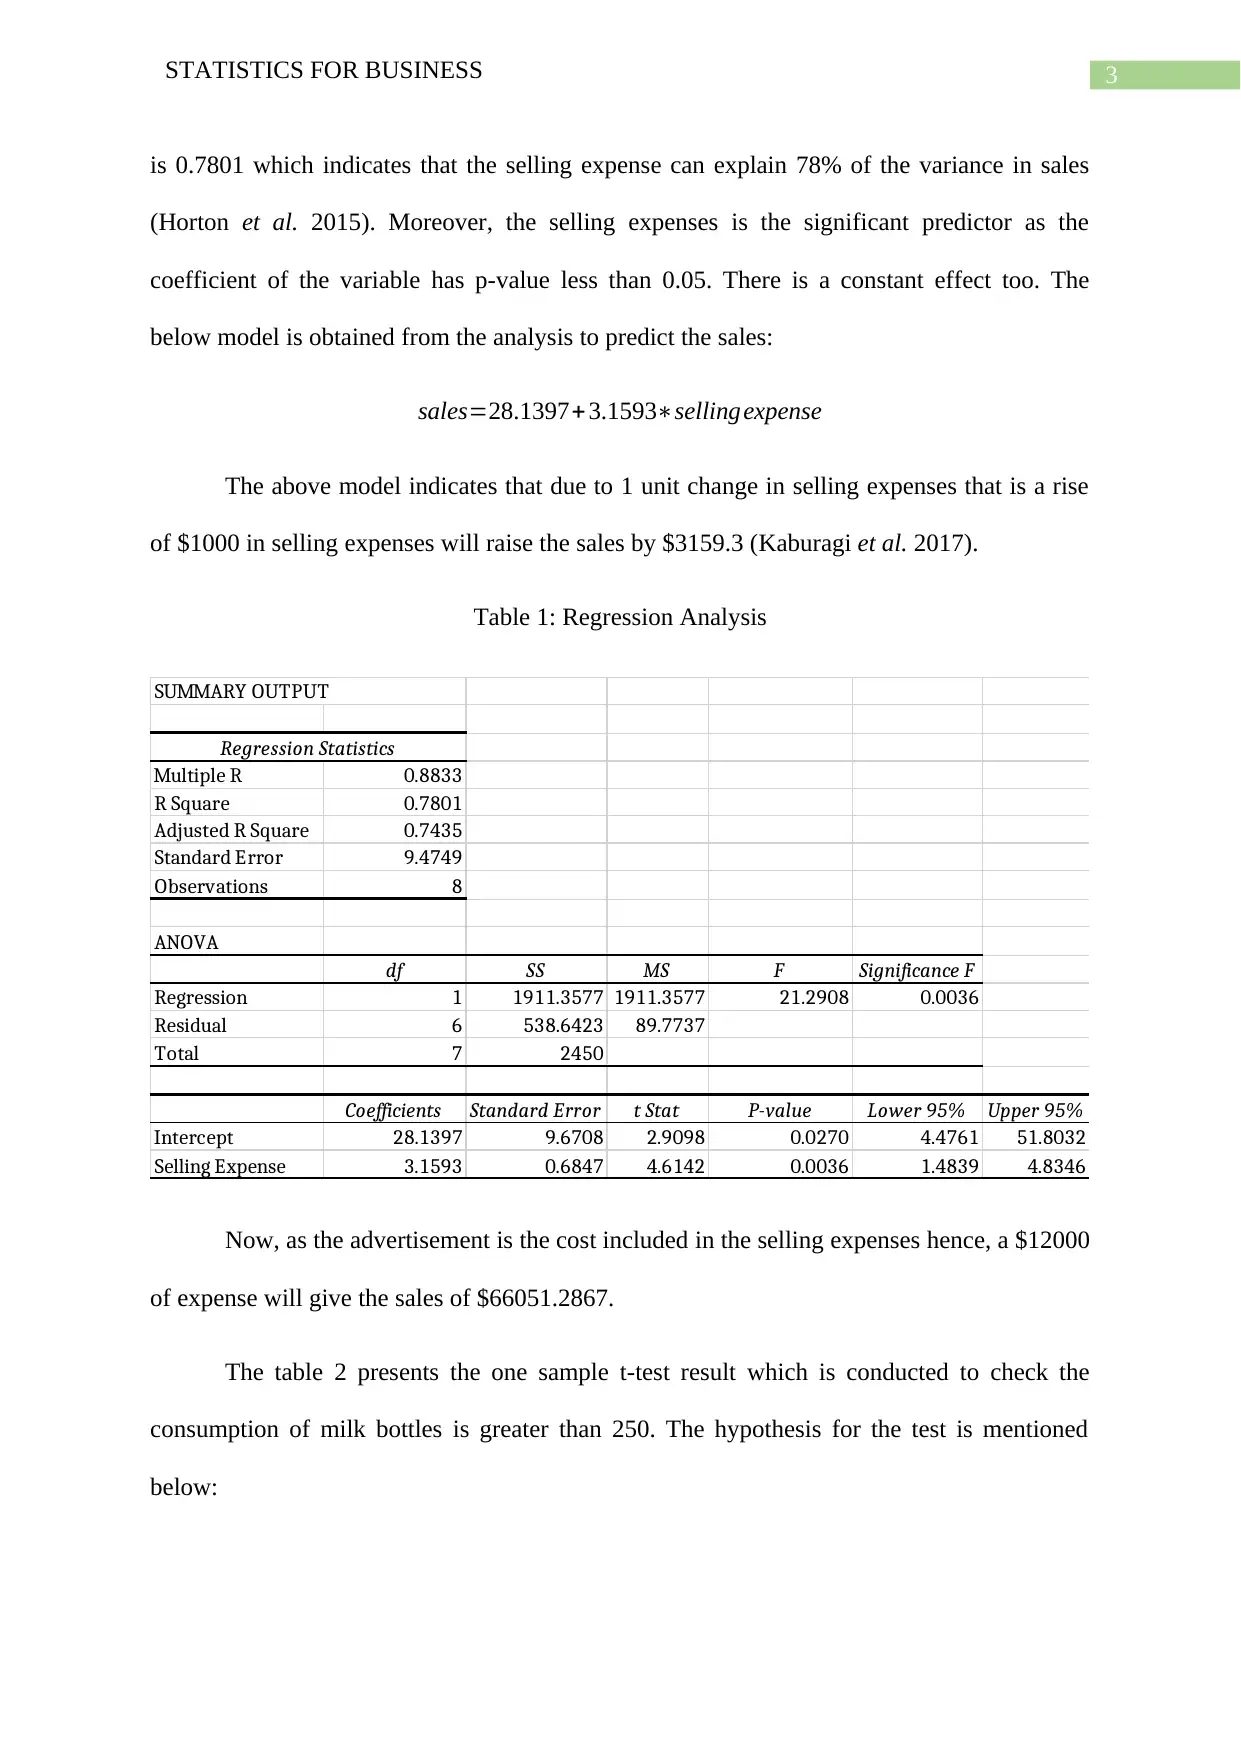
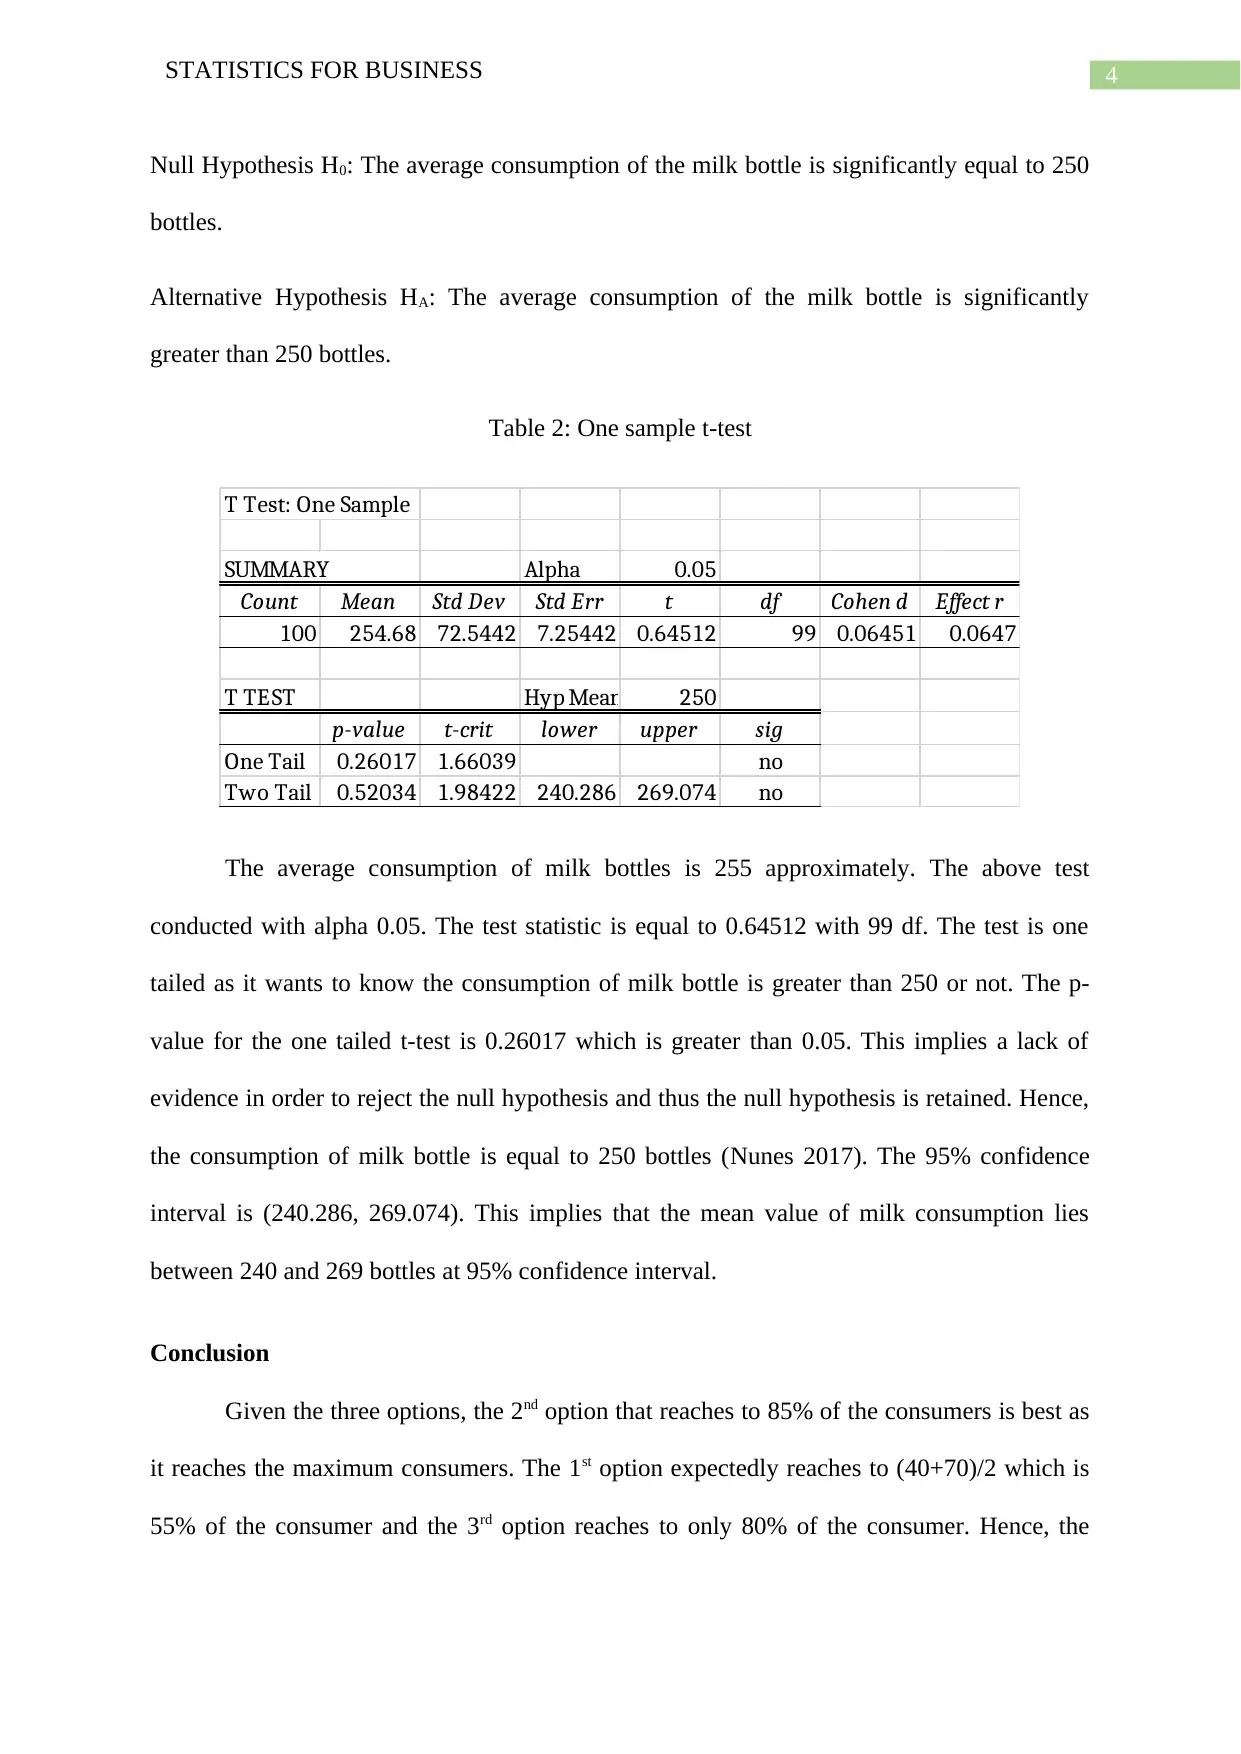
This report analyzes sales data for ACE Pty Ltd, an Australian food company planning an advertising campaign for a new milk drink. It utilizes a scatter plot to visualize the relationship between sales and selling expenses, calculating covariance and correlation. Regression analysis is conducted to predict sales based on selling expenses, revealing a strong positive correlation and the ability of selling expenses to explain a significant portion of sales variance. A one-sample t-test is performed to test the hypothesis that the average milk bottle consumption is greater than 250, leading to the conclusion that the average consumption is approximately 250 bottles. The report concludes by recommending the advertising option that reaches the maximum consumers.

Running head: STATISTICS FOR BUSINESS
Statistics for Business
Name of the Student:
Name of the University:
Author Note:
Statistics for Business
Name of the Student:
Name of the University:
Author Note:
Paraphrase This Document
Need a fresh take? Get an instant paraphrase of this document with our AI Paraphraser

1STATISTICS FOR BUSINESS
Table of Contents
Introduction................................................................................................................................2
Data Analysis.............................................................................................................................2
Conclusion..................................................................................................................................4
Reference....................................................................................................................................5

2STATISTICS FOR BUSINESS
Introduction
ACE Pty Ltd is an Australian food company. The food company is planning to
introduce an advertisement campaign to promote their new innovative milk drink. Now the
objective of the essay is to predict the sales and the relationship between sales and sales
expenses. Moreover, here a hypothesis test is conducted in order to see whether the average
consumption of milk bottle is more than 250 or not.
Data Analysis
The below scatter plot presents the sales along the y-axis and selling expenses along
with the x-axis. The covariance and the correlation between these variables are 75.6250 and
0.8833 respectively (Baak, Koopman and Klous 2018). From the trend line and the value of
correlation, it can be seen that there is a strong and positive correlation between sales and
selling expenses
Figure 1: Scatter plot
In order to predict the sales, a regression analysis is conducted and the result of the
regression analysis is presented in the table 1. The table 1 shows the value of R-square which
⊘ This is a preview!⊘
Do you want full access?
Subscribe today to unlock all pages.

Trusted by 1+ million students worldwide

3STATISTICS FOR BUSINESS
is 0.7801 which indicates that the selling expense can explain 78% of the variance in sales
(Horton et al. 2015). Moreover, the selling expenses is the significant predictor as the
coefficient of the variable has p-value less than 0.05. There is a constant effect too. The
below model is obtained from the analysis to predict the sales:
sales=28.1397+3.1593∗sellingexpense
The above model indicates that due to 1 unit change in selling expenses that is a rise
of $1000 in selling expenses will raise the sales by $3159.3 (Kaburagi et al. 2017).
Table 1: Regression Analysis
SUMMARY OUTPUT
Regression Statistics
Multiple R 0.8833
R Square 0.7801
Adjusted R Square 0.7435
Standard Error 9.4749
Observations 8
ANOVA
df SS MS F Significance F
Regression 1 1911.3577 1911.3577 21.2908 0.0036
Residual 6 538.6423 89.7737
Total 7 2450
Coefficients Standard Error t Stat P-value Lower 95% Upper 95%
Intercept 28.1397 9.6708 2.9098 0.0270 4.4761 51.8032
Selling Expense 3.1593 0.6847 4.6142 0.0036 1.4839 4.8346
Now, as the advertisement is the cost included in the selling expenses hence, a $12000
of expense will give the sales of $66051.2867.
The table 2 presents the one sample t-test result which is conducted to check the
consumption of milk bottles is greater than 250. The hypothesis for the test is mentioned
below:
Paraphrase This Document
Need a fresh take? Get an instant paraphrase of this document with our AI Paraphraser

4STATISTICS FOR BUSINESS
Null Hypothesis H0: The average consumption of the milk bottle is significantly equal to 250
bottles.
Alternative Hypothesis HA: The average consumption of the milk bottle is significantly
greater than 250 bottles.
Table 2: One sample t-test
T Test: One Sample
SUMMARY Alpha 0.05
Count Mean Std Dev Std Err t df Cohen d Effect r
100 254.68 72.5442 7.25442 0.64512 99 0.06451 0.0647
T TEST Hyp Mean 250
p-value t-crit lower upper sig
One Tail 0.26017 1.66039 no
Two Tail 0.52034 1.98422 240.286 269.074 no
The average consumption of milk bottles is 255 approximately. The above test
conducted with alpha 0.05. The test statistic is equal to 0.64512 with 99 df. The test is one
tailed as it wants to know the consumption of milk bottle is greater than 250 or not. The p-
value for the one tailed t-test is 0.26017 which is greater than 0.05. This implies a lack of
evidence in order to reject the null hypothesis and thus the null hypothesis is retained. Hence,
the consumption of milk bottle is equal to 250 bottles (Nunes 2017). The 95% confidence
interval is (240.286, 269.074). This implies that the mean value of milk consumption lies
between 240 and 269 bottles at 95% confidence interval.
Conclusion
Given the three options, the 2nd option that reaches to 85% of the consumers is best as
it reaches the maximum consumers. The 1st option expectedly reaches to (40+70)/2 which is
55% of the consumer and the 3rd option reaches to only 80% of the consumer. Hence, the

5STATISTICS FOR BUSINESS
maximum consumers are reachable by following the 2nd option with that fixed amount of
cost. The milk bottle consumption is equal to 250 bottles per head in a year.
maximum consumers are reachable by following the 2nd option with that fixed amount of
cost. The milk bottle consumption is equal to 250 bottles per head in a year.
⊘ This is a preview!⊘
Do you want full access?
Subscribe today to unlock all pages.

Trusted by 1+ million students worldwide

6STATISTICS FOR BUSINESS
Reference
Baak, M., Koopman, R. and Klous, S., 2018. A new correlation coefficient between
categorical, ordinal and interval variables with Pearson characteristics. arXiv preprint
arXiv:1811.11440.
Horton, D.E., Johnson, N.C., Singh, D., Swain, D.L., Rajaratnam, B. and Diffenbaugh, N.S.,
2015. Contribution of changes in atmospheric circulation patterns to extreme temperature
trends. Nature, 522(7557), p.465.
Kaburagi, T., Takenaka, M., Kurihara, Y. and Matsumoto, T., 2017. A Linear Regression
Model for Estimating Anxiety Index Using Wide Area Frontal Lobe Brain Blood Volume.
International Journal of Psychological and Behavioral Sciences, 11(3), pp.115-118.
Nunes, A., 2017. Mutual funds and short sales (Doctoral dissertation).
1 out of 7
Related Documents

Your All-in-One AI-Powered Toolkit for Academic Success.
 +13062052269
info@desklib.com
Available 24*7 on WhatsApp / Email
Unlock your academic potential
Copyright © 2020–2025 A2Z Services. All Rights Reserved. Developed and managed by ZUCOL.