Business Statistics Report: Hypothesis Testing and Analysis
VerifiedAdded on 2022/08/22
|15
|1474
|14
Report
AI Summary
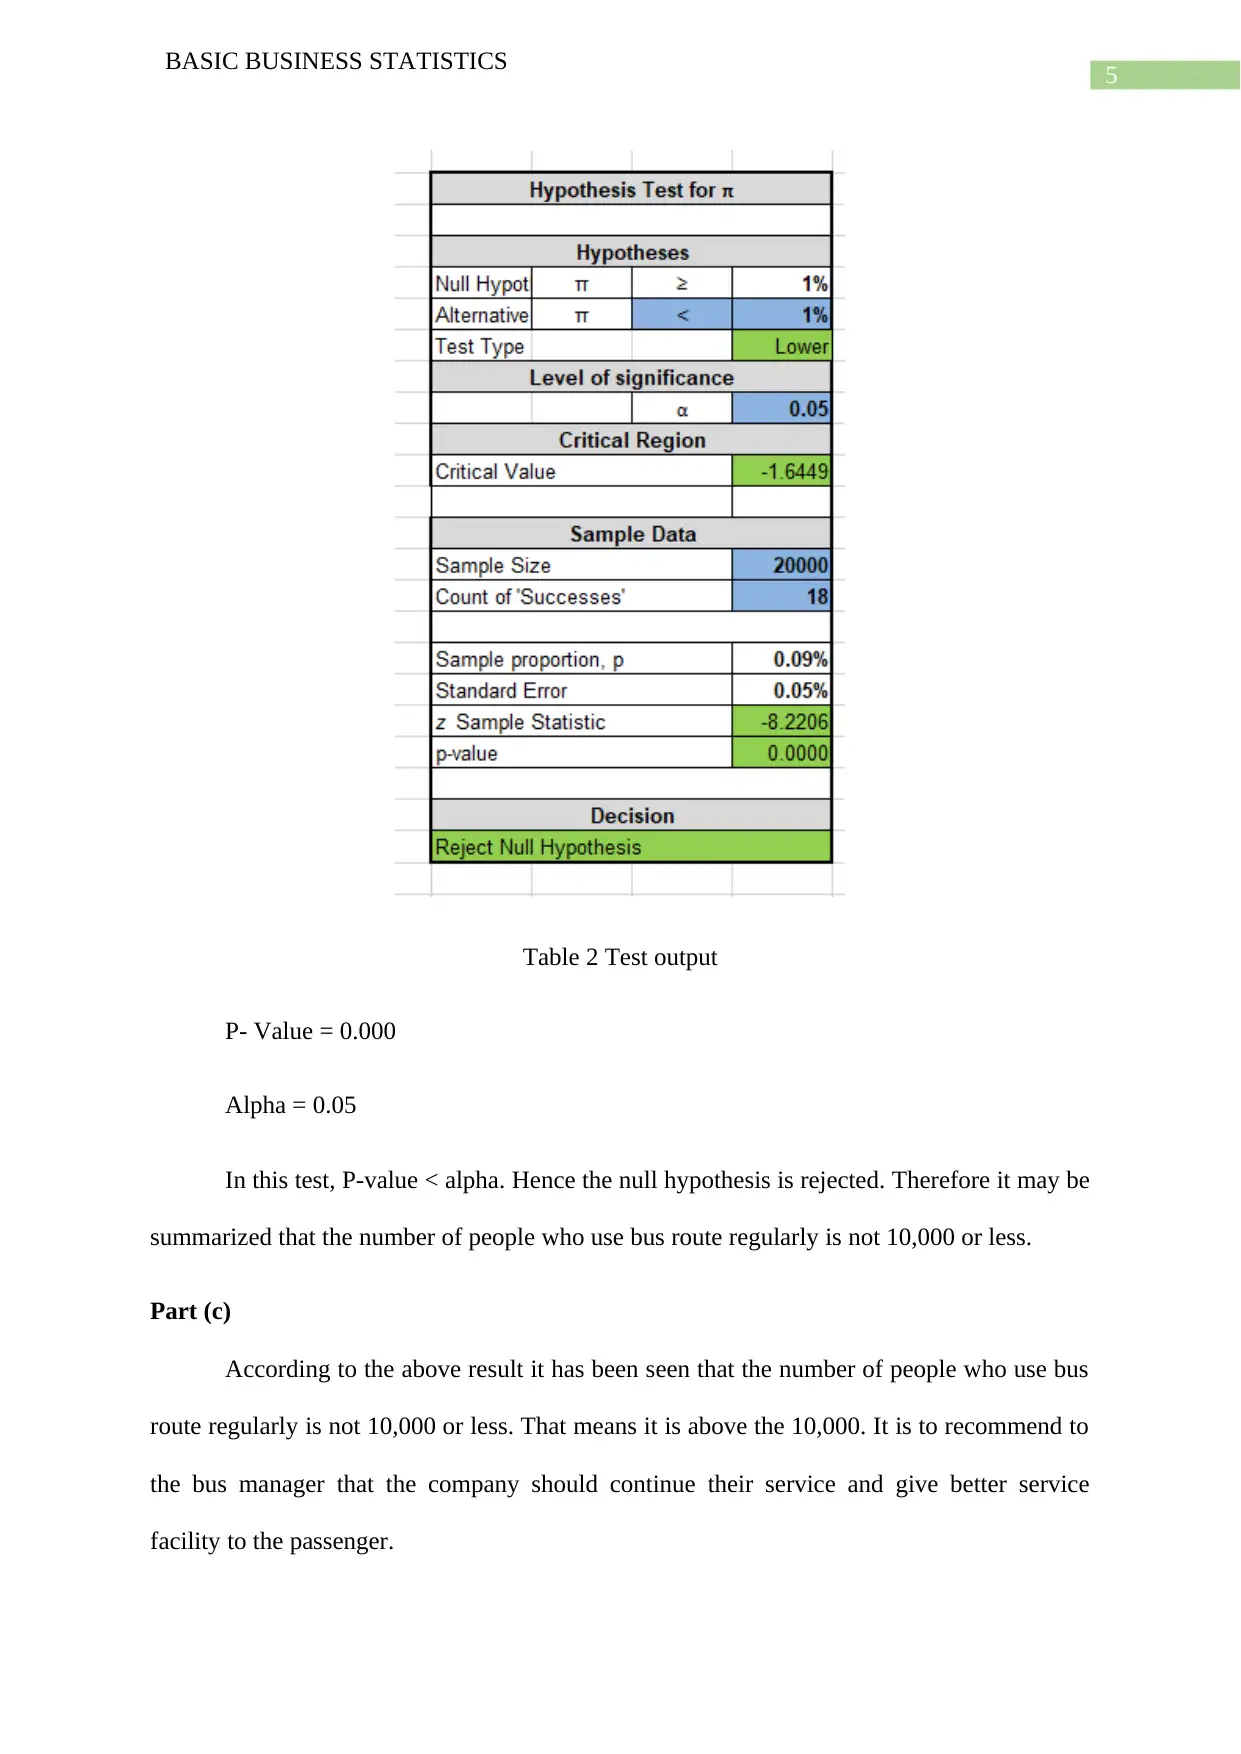
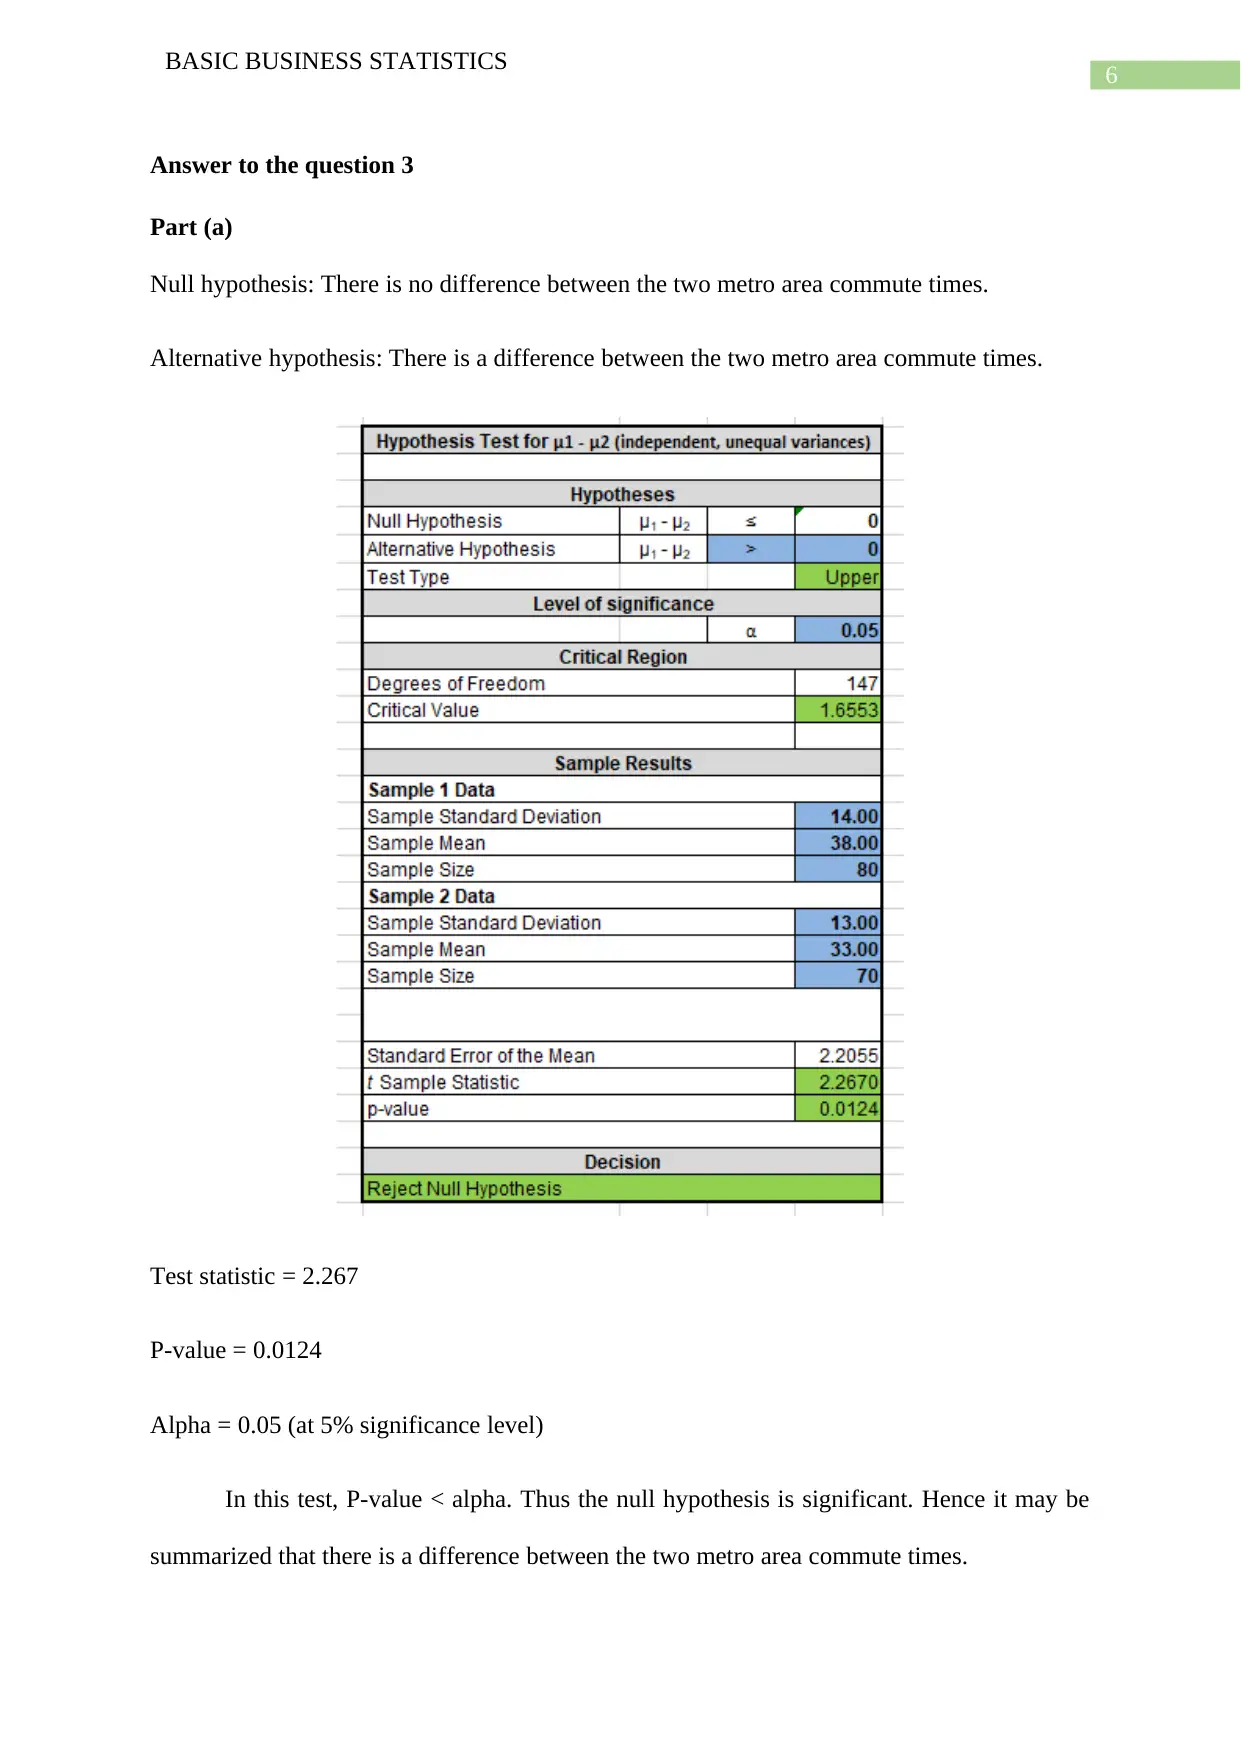
This report presents a comprehensive analysis of business statistics, encompassing hypothesis testing, confidence intervals, and the interpretation of p-values. The report addresses several statistical questions, including tests of association, confidence intervals for proportions, hypothesis tests related to bus route usage, and the comparison of commute times. It also delves into sampling and measurement issues, confidence intervals for means, and hypothesis tests on GRE averages. Furthermore, the report explores the relationship between different countries using hypothesis tests and confidence intervals, and it concludes with a discussion of policy trends. The report utilizes various statistical methods to analyze different datasets and draw meaningful conclusions, supported by relevant references.

Running head: BASIC BUSINESS STATISTICS
Basic business statistics
Name of the Student:
Name of the University:
Author note:
Basic business statistics
Name of the Student:
Name of the University:
Author note:
Paraphrase This Document
Need a fresh take? Get an instant paraphrase of this document with our AI Paraphraser

1
BASIC BUSINESS STATISTICS
Table of Contents
Answer to the question 1............................................................................................................2
Part (a)....................................................................................................................................2
Part (b)....................................................................................................................................2
Answer to the question 2........................................................................................................3
Part (a)....................................................................................................................................3
Part (b)....................................................................................................................................3
Part (c)....................................................................................................................................4
Answer to the question 3............................................................................................................5
Part (a)....................................................................................................................................5
Part (b)....................................................................................................................................6
Answer to the question 4............................................................................................................6
Part (a)....................................................................................................................................6
Part (b)....................................................................................................................................7
Answer to the question 5............................................................................................................7
Part (a)....................................................................................................................................7
Part (b)....................................................................................................................................8
Answer to the question 6............................................................................................................8
Part (a)....................................................................................................................................8
Part (b)....................................................................................................................................9
Part (c)....................................................................................................................................9
Bibliography.............................................................................................................................10

2
BASIC BUSINESS STATISTICS
⊘ This is a preview!⊘
Do you want full access?
Subscribe today to unlock all pages.

Trusted by 1+ million students worldwide

3
BASIC BUSINESS STATISTICS
Answer to the question 1
Part (a)
Null hypothesis: There is no association among the class standing and the promotion of rank
admiral.
Alternative hypothesis: There is an association among the class standing and the promotion of
rank admiral.
Table1 Test output
Part (b)
Test statistic = 0.0627
P-value = 0.955
Alpha = 0.05 (at 5% level)
Paraphrase This Document
Need a fresh take? Get an instant paraphrase of this document with our AI Paraphraser

4
BASIC BUSINESS STATISTICS
It has been seen that P-value > alpha. Thus the null hypothesis is not significant.
Therefore the test can be summarized that there is no association among the class standing and
the promotion of rank admiral.
Answer to the question 2
Part (a)
Given that
N= 20000
X = 18
P = 18/20000
= 0.0009
The 95% confidence interval is as below
P ± 1.96 * √ P(1− p)
N
= 0.0009 ± 1.96 * √ 0.0009(1−0.0009)
20000
= 0.0009 ±0.000415592
= (0.00048, 0.0014)
Part (b)
Null hypothesis: The number of people who use bus route regularly is 10,000 or less.
Alternative hypothesis: The number of people who use bus route regularly is not
10,000 or less.

5
BASIC BUSINESS STATISTICS
Table 2 Test output
P- Value = 0.000
Alpha = 0.05
In this test, P-value < alpha. Hence the null hypothesis is rejected. Therefore it may be
summarized that the number of people who use bus route regularly is not 10,000 or less.
Part (c)
According to the above result it has been seen that the number of people who use bus
route regularly is not 10,000 or less. That means it is above the 10,000. It is to recommend to
the bus manager that the company should continue their service and give better service
facility to the passenger.
⊘ This is a preview!⊘
Do you want full access?
Subscribe today to unlock all pages.

Trusted by 1+ million students worldwide

6
BASIC BUSINESS STATISTICS
Answer to the question 3
Part (a)
Null hypothesis: There is no difference between the two metro area commute times.
Alternative hypothesis: There is a difference between the two metro area commute times.
Test statistic = 2.267
P-value = 0.0124
Alpha = 0.05 (at 5% significance level)
In this test, P-value < alpha. Thus the null hypothesis is significant. Hence it may be
summarized that there is a difference between the two metro area commute times.
Paraphrase This Document
Need a fresh take? Get an instant paraphrase of this document with our AI Paraphraser

7
BASIC BUSINESS STATISTICS
Part (b)
Test statistic = 2.267
P-value = 0.0124
Alpha = 0.01 (at 1% significance level)
It has been seen that P-value < alpha. Thus the null hypothesis is significant. Hence it
may be concluded that there is a difference between the two metro area commute times.
Type 1 error define rejection of the null hypothesis when the hypothesis is true and
type 2 error means accept the null hypothesis when it is false. At 95% confidence interval the
alpha value is 0.05. This define that there is 5% probability to reject a null hypothesis which
is true. The error with type 2 are equivalent to false negative. When a test try to decrease one
type of error than the other type increases. Moreover when the alpha is decreases (alpha
=0.05 to alpha = 0.01) then the every part of the test is same. Hence when the type 1 error
decrease then the type 2 error increases.
Answer to the question 4
Part (a)
An online poll was conducted on ‘In hindsight, do you think Britain was right or
wrong to vote to leave the European Union?’ from 1 August 2016 - 2 August 2016, with the
sample size of 20 and the respondents are all 18 years and above (whatukthinks.org 2016).
Here
M= 8
N= 12
X-bar = 2.20

8
BASIC BUSINESS STATISTICS
Y-bar = 2.29
Sigmax2 = 0.0121
Sigmay 2= 0.0049
At 95% confidence interval z is 1.96
Hence it becomes like that
(X-bar – Y-bar) ± 1.96* ((sqrt (Sigmax2+ Sigmay 2)/ (M+N))
= 0.09±0.0841
= (0.0059, 0.1741)
Thus this means that the poll result of the union 95% confident that there result will
lies between (0.0059, 0.1741) and they are 5% not sure that their result will lie within this
interval.
Part (b)
The sampling issues are data collection and collaboration, issue on stratification, data
cleaning and modification for analysis.
The measurement issues are sampling error, sampling variability on different opinion,
mean variability and so on.
Answer to the question 5
Part (a)
Given that
N= 100
Mean = 1200
⊘ This is a preview!⊘
Do you want full access?
Subscribe today to unlock all pages.

Trusted by 1+ million students worldwide

9
BASIC BUSINESS STATISTICS
Standard deviation (s) = 200
Alpha = 0.05
Degrees of freedom = 99
Therefore 95% confidence interval is as below
Mean ± talpha/2 * (s/ sqrt (n))
= 1200 ± 1.66 * (200/ sqrt (100))
= (1166.8, 1233.2)
Part (b)
Null hypothesis: The GRE average of Walt Whitman student is 1150.
Alternative hypothesis: The GRE average of Walt Whitman student is not 1150.
Test statistic (t) = 1200−1150
¿ ¿ ¿
= 2.5
P- Value = 0.014
In this test P-value < alpha. Thus this means that the null hypothesis is significant.
Hence it may be summarized that GRE average of Walt Whitman student is not 1150.
Answer to the question 6
Part (a)
The 95% confidence interval is as below
(X-bar – Y-bar) ± 1.96* ((sqrt (Sigmax2+ Sigmay 2)/ (M+N))
= (126-67) ± 1.96* ((sqrt (15.54+ 4.20)/ 9))
Paraphrase This Document
Need a fresh take? Get an instant paraphrase of this document with our AI Paraphraser

10
BASIC BUSINESS STATISTICS
= 59±2.9030
= (59.096, 61.903)
Null hypothesis: There is an association between South Korea and Russia.
Alternative hypothesis: There is no association between South Korea and Russia.
Test statistic = -0.5954
P- Value = 0.000
Alpha = 0.05
Moreover the value of South Korea and Russia is 48.
Here the P-Value < alpha. Hence the null hypothesis is rejected. More over the
common value between South Korea and Russia is not lie within the confidence interval.
Thus this shows the same that is reject the null hypothesis. Therefore there is no association
between South Korea and Russia.
Part (b)
Yes. Because both the confidence interval and hypothesis test shows the same
conclusion. For all the countries the result is different. Because every country has a different
mixture of land line and cell phone calls.
Part (c)
Yes, the policy trend is based on land line call and cell phone call among all the
countries. The china and US Plays the major threat role in this purpose.

11
BASIC BUSINESS STATISTICS
Bibliography
Bonett, D. G., & Wright, T. A. (2015). Cronbach's alpha reliability: Interval estimation,
hypothesis testing, and sample size planning. Journal of Organizational Behavior,
36(1), 3-15.
De Winter, J. C. (2013). Using the Student's t-test with extremely small sample sizes.
Practical Assessment, Research, and Evaluation, 18(1), 10.
Moinester, M., & Gottfried, R. (2014). Sample size estimation for correlations with pre-
specified confidence interval. The quantitative methods for psychology, 10(2), 124-
130.
Wang, M., & Liu, G. (2016). A simple two-sample Bayesian t-test for hypothesis testing. The
American Statistician, 70(2), 195-201.
Wang, M., & Liu, G. (2016). A simple two-sample Bayesian t-test for hypothesis testing. The
American Statistician, 70(2), 195-201.
⊘ This is a preview!⊘
Do you want full access?
Subscribe today to unlock all pages.

Trusted by 1+ million students worldwide
1 out of 15
Related Documents

Your All-in-One AI-Powered Toolkit for Academic Success.
+13062052269
info@desklib.com
Available 24*7 on WhatsApp / Email
Unlock your academic potential
Copyright © 2020–2025 A2Z Services. All Rights Reserved. Developed and managed by ZUCOL.