Business Statistics: Bitcoin, Stock Market Descriptive Analysis Report
VerifiedAdded on 2023/01/23
|12
|2383
|65
Report
AI Summary
This business statistics report analyzes the weekly closing prices and returns of Bitcoin, NAB, Wesfarmers, and Woodside. It includes a trend line analysis of Bitcoin's closing price and histograms of weekly returns for all assets, along with descriptive statistics (mean, standard deviation, skewness, kurtosis, etc.) to assess the distribution and volatility. The report examines the probability of loss for each investment and compares their performance. The analysis covers the period from 2013 to 2020, providing insights into market trends and investment risks. The report uses scatter diagrams and descriptive statistics to evaluate the performance of each asset and determine whether they follow a trend line. The report also focuses on the descriptive analysis of the data to provide insights into the data and the probability of loss in investing in the stocks. The report concludes with an overview of the findings and their implications for investment strategies. It uses data analysis to assist in the decision-making process of investing in financial markets.
Running head: BUSINESS STATISTICS
Business Statistics
Name of the Student:
Name of the University:
Author Note:
Business Statistics
Name of the Student:
Name of the University:
Author Note:
Paraphrase This Document
Need a fresh take? Get an instant paraphrase of this document with our AI Paraphraser
1BUSINESS STATISTICS
Table of Contents
Introduction................................................................................................................................3
Trend line for weekly closing price...........................................................................................3
Histogram of weekly return.......................................................................................................4
Three aspects of descriptive analysis.........................................................................................4
Analysis of NAB, Wesfarmers and Woodside...........................................................................5
Conclusion................................................................................................................................10
Reference..................................................................................................................................11
2BUSINESS STATISTICS
Executive Summary
Bitcoin is a payment network which is very well-known as a cryptocurrency that uses
the block chain technology. Some says, Bitcoin as a secure, global and digital currency
represents the future of finance and some are not optimistic about it. A statistical analysis is
needed to judge that whether it is recommendable or not to invest in Bitcoin. Data on the
closing price and the return of Bitcoin on weekly basis can be used to get the best results
from the analysis. The trend and the statistics can suggest the better option between investin
and not investing on Bitcoins.
⊘ This is a preview!⊘
Do you want full access?
Subscribe today to unlock all pages.
Trusted by 1+ million students worldwide
3BUSINESS STATISTICS
Introduction
Blockchain, primarily block chain, is a distributed decentralized digital ledger.
Cryptocurrency is an application of block chain technology. Cryptocurrency uses the
encryption techniques to secure and regulate the financial transaction, generation of
additional units and confirm the relocation of assets. A very well-known example of
cryptocurrency is Bitcoin. Bitcoin is a new kind of payment network and it uses the
technology to control without banks, manage transactions and issue the Bitcoins collectively
using the network (Easley, O'Hara and Basu 2019). The reasons for being optimistic about
the future of Bitcoin are market stability, Scalability of mainstream use, adoption, favorable
regulatory decisions, successful platform launches and strong cryptocurrency. The reason
behind not being optimistic about the future of Bitcoin is the supply of Bitcoin is fixed in the
long-run. Now, even if it follows the constant Friedman growth rule it would not be possible
to solve the problem.
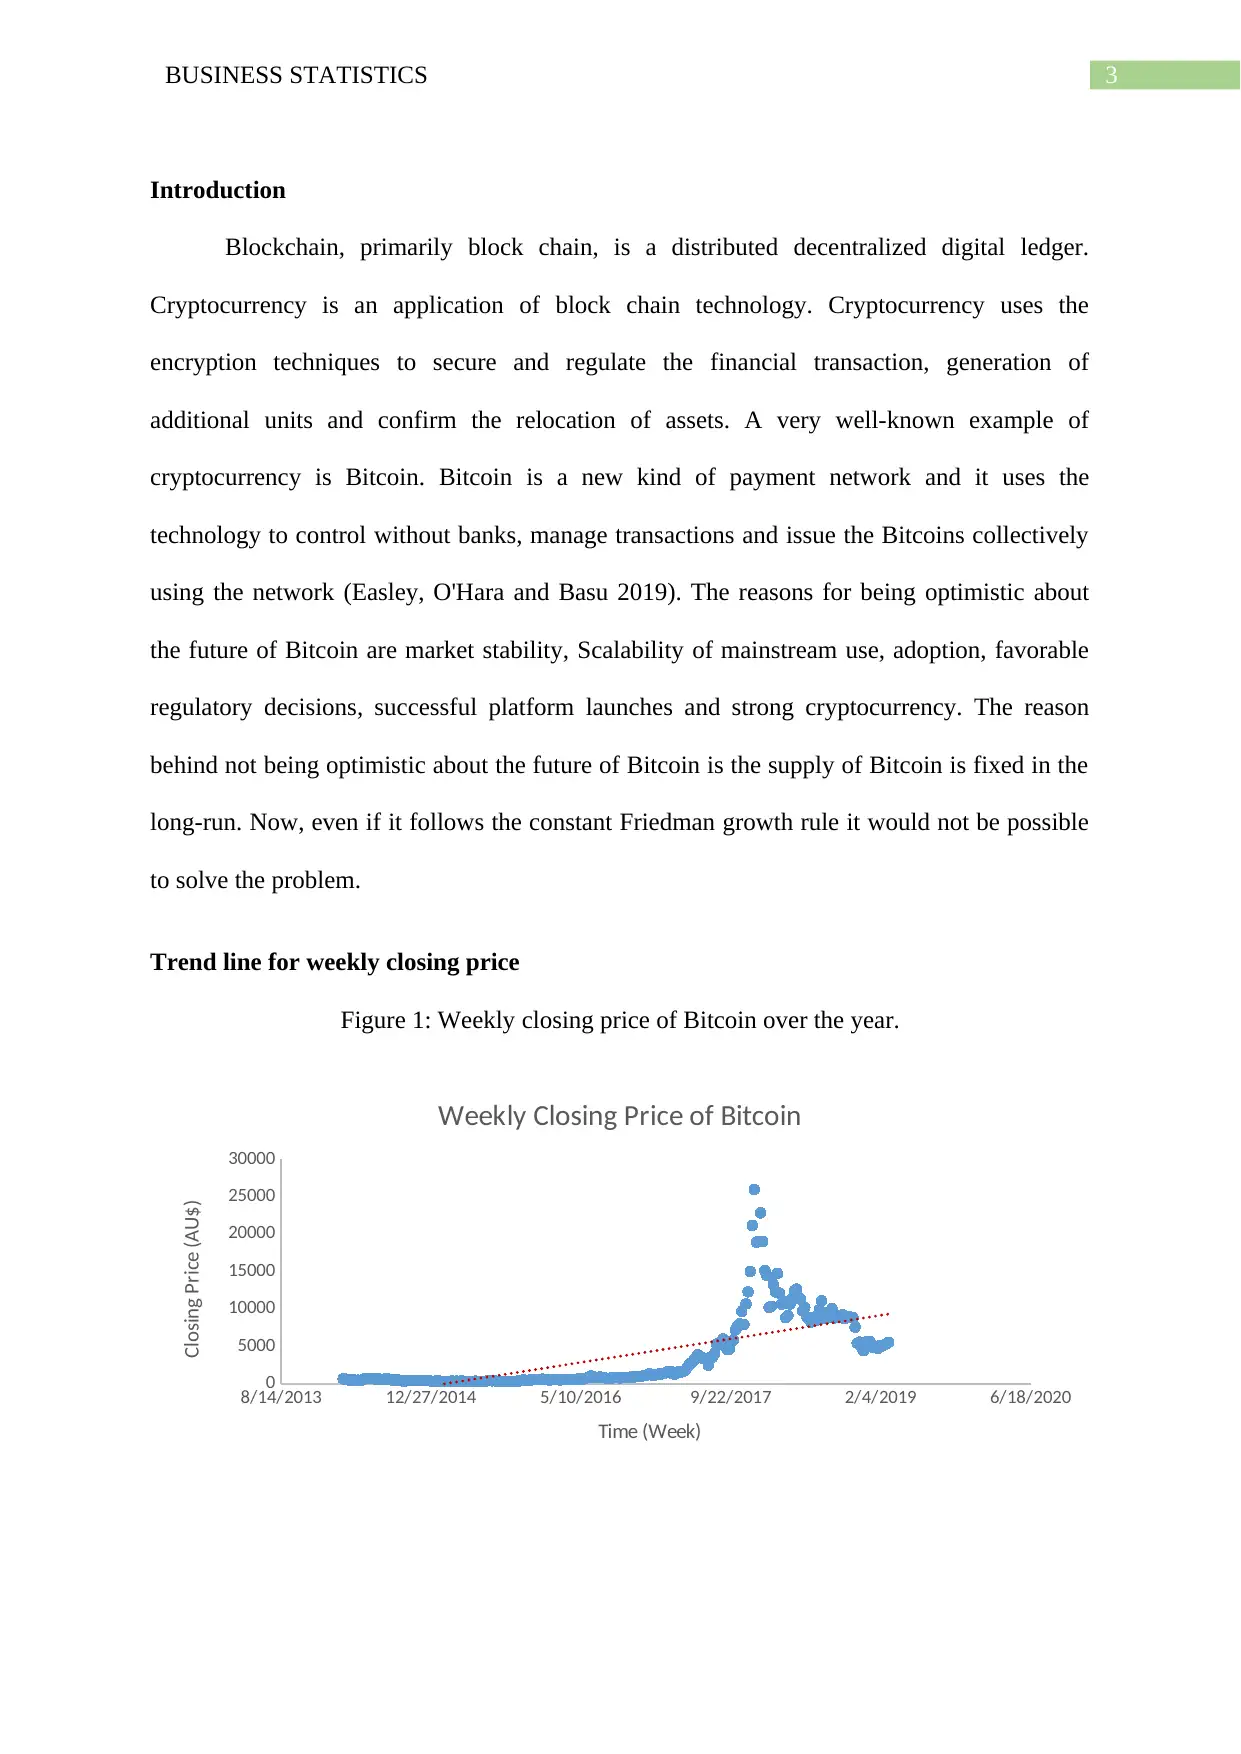
Trend line for weekly closing price
Figure 1: Weekly closing price of Bitcoin over the year.
8/14/2013 12/27/2014 5/10/2016 9/22/2017 2/4/2019 6/18/2020
0
5000
10000
15000
20000
25000
30000
Weekly Closing Price of Bitcoin
Time (Week)
Closing Price (AU$)
Introduction
Blockchain, primarily block chain, is a distributed decentralized digital ledger.
Cryptocurrency is an application of block chain technology. Cryptocurrency uses the
encryption techniques to secure and regulate the financial transaction, generation of
additional units and confirm the relocation of assets. A very well-known example of
cryptocurrency is Bitcoin. Bitcoin is a new kind of payment network and it uses the
technology to control without banks, manage transactions and issue the Bitcoins collectively
using the network (Easley, O'Hara and Basu 2019). The reasons for being optimistic about
the future of Bitcoin are market stability, Scalability of mainstream use, adoption, favorable
regulatory decisions, successful platform launches and strong cryptocurrency. The reason
behind not being optimistic about the future of Bitcoin is the supply of Bitcoin is fixed in the
long-run. Now, even if it follows the constant Friedman growth rule it would not be possible
to solve the problem.
Trend line for weekly closing price
Figure 1: Weekly closing price of Bitcoin over the year.
8/14/2013 12/27/2014 5/10/2016 9/22/2017 2/4/2019 6/18/2020
0
5000
10000
15000
20000
25000
30000
Weekly Closing Price of Bitcoin
Time (Week)
Closing Price (AU$)
Paraphrase This Document
Need a fresh take? Get an instant paraphrase of this document with our AI Paraphraser
4BUSINESS STATISTICS
The above figure is scatter diagram presenting the weekly closing price of the Bitcoin.
The scatter diagram is helpful to determine the relationship between two variables. To do so,
it presents the dependent variable on the vertical axis and the independent variable on the
horizontal axis. Then it presents the data of dependent variable against each value of
independent variable. In the figure above the closing price of Bitcoin is presented on the
vertical axis and the dots are presenting the closing price of Bitcoin against each week from
2014 to 2019. A trend line is presented which does not match with the scatter diagram of
close price of Bitcoins. Therefore, it can be said that the price does not follow the trend line
(Güçlü 2018).
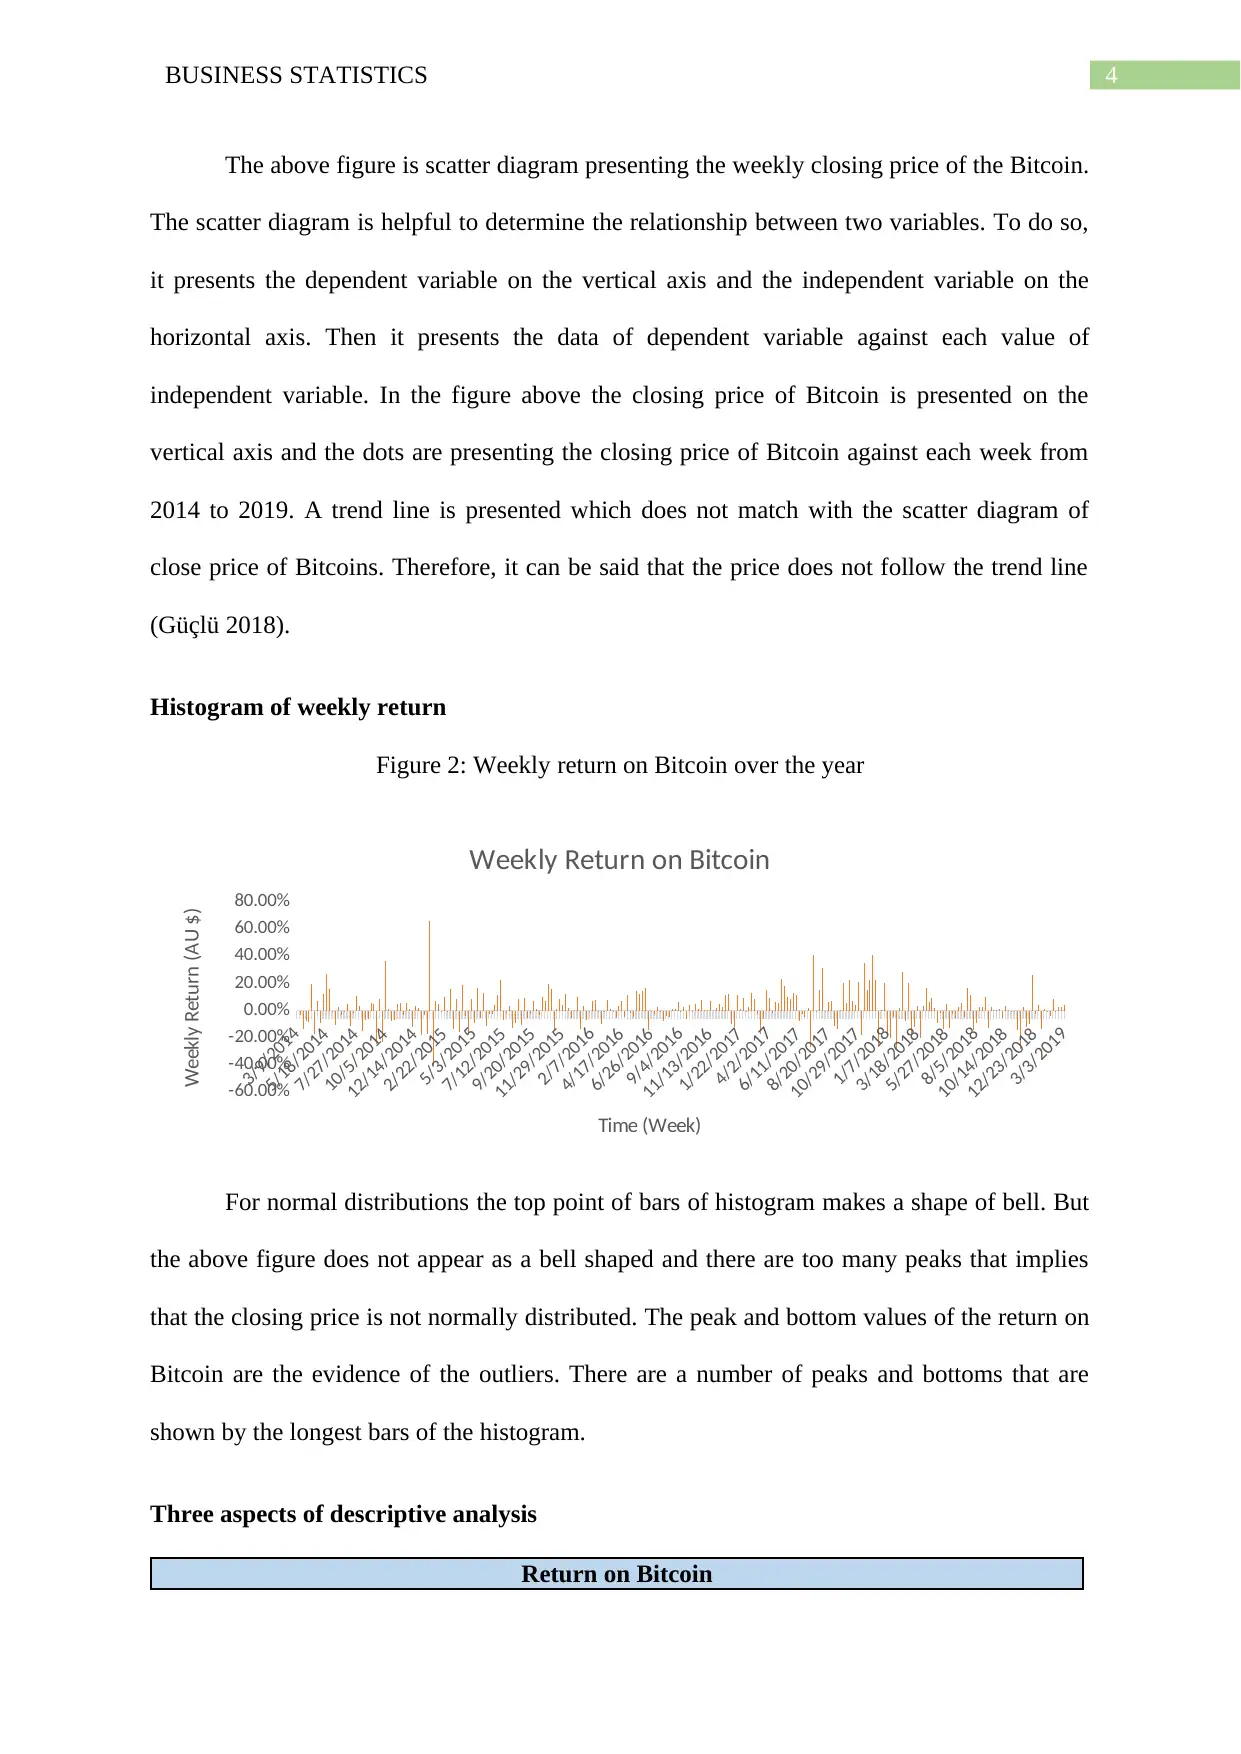
Histogram of weekly return
Figure 2: Weekly return on Bitcoin over the year
3/9/2014
5/18/2014
7/27/2014
10/5/2014
12/14/2014
2/22/2015
5/3/2015
7/12/2015
9/20/2015
11/29/2015
2/7/2016
4/17/2016
6/26/2016
9/4/2016
11/13/2016
1/22/2017
4/2/2017
6/11/2017
8/20/2017
10/29/2017
1/7/2018
3/18/2018
5/27/2018
8/5/2018
10/14/2018
12/23/2018
3/3/2019
-60.00%
-40.00%
-20.00%
0.00%
20.00%
40.00%
60.00%
80.00%
Weekly Return on Bitcoin
Time (Week)
Weekly Return (AU $)
For normal distributions the top point of bars of histogram makes a shape of bell. But
the above figure does not appear as a bell shaped and there are too many peaks that implies
that the closing price is not normally distributed. The peak and bottom values of the return on
Bitcoin are the evidence of the outliers. There are a number of peaks and bottoms that are
shown by the longest bars of the histogram.
Three aspects of descriptive analysis
Return on Bitcoin
The above figure is scatter diagram presenting the weekly closing price of the Bitcoin.
The scatter diagram is helpful to determine the relationship between two variables. To do so,
it presents the dependent variable on the vertical axis and the independent variable on the
horizontal axis. Then it presents the data of dependent variable against each value of
independent variable. In the figure above the closing price of Bitcoin is presented on the
vertical axis and the dots are presenting the closing price of Bitcoin against each week from
2014 to 2019. A trend line is presented which does not match with the scatter diagram of
close price of Bitcoins. Therefore, it can be said that the price does not follow the trend line
(Güçlü 2018).
Histogram of weekly return
Figure 2: Weekly return on Bitcoin over the year
3/9/2014
5/18/2014
7/27/2014
10/5/2014
12/14/2014
2/22/2015
5/3/2015
7/12/2015
9/20/2015
11/29/2015
2/7/2016
4/17/2016
6/26/2016
9/4/2016
11/13/2016
1/22/2017
4/2/2017
6/11/2017
8/20/2017
10/29/2017
1/7/2018
3/18/2018
5/27/2018
8/5/2018
10/14/2018
12/23/2018
3/3/2019
-60.00%
-40.00%
-20.00%
0.00%
20.00%
40.00%
60.00%
80.00%
Weekly Return on Bitcoin
Time (Week)
Weekly Return (AU $)
For normal distributions the top point of bars of histogram makes a shape of bell. But
the above figure does not appear as a bell shaped and there are too many peaks that implies
that the closing price is not normally distributed. The peak and bottom values of the return on
Bitcoin are the evidence of the outliers. There are a number of peaks and bottoms that are
shown by the longest bars of the histogram.
Three aspects of descriptive analysis
Return on Bitcoin
5BUSINESS STATISTICS
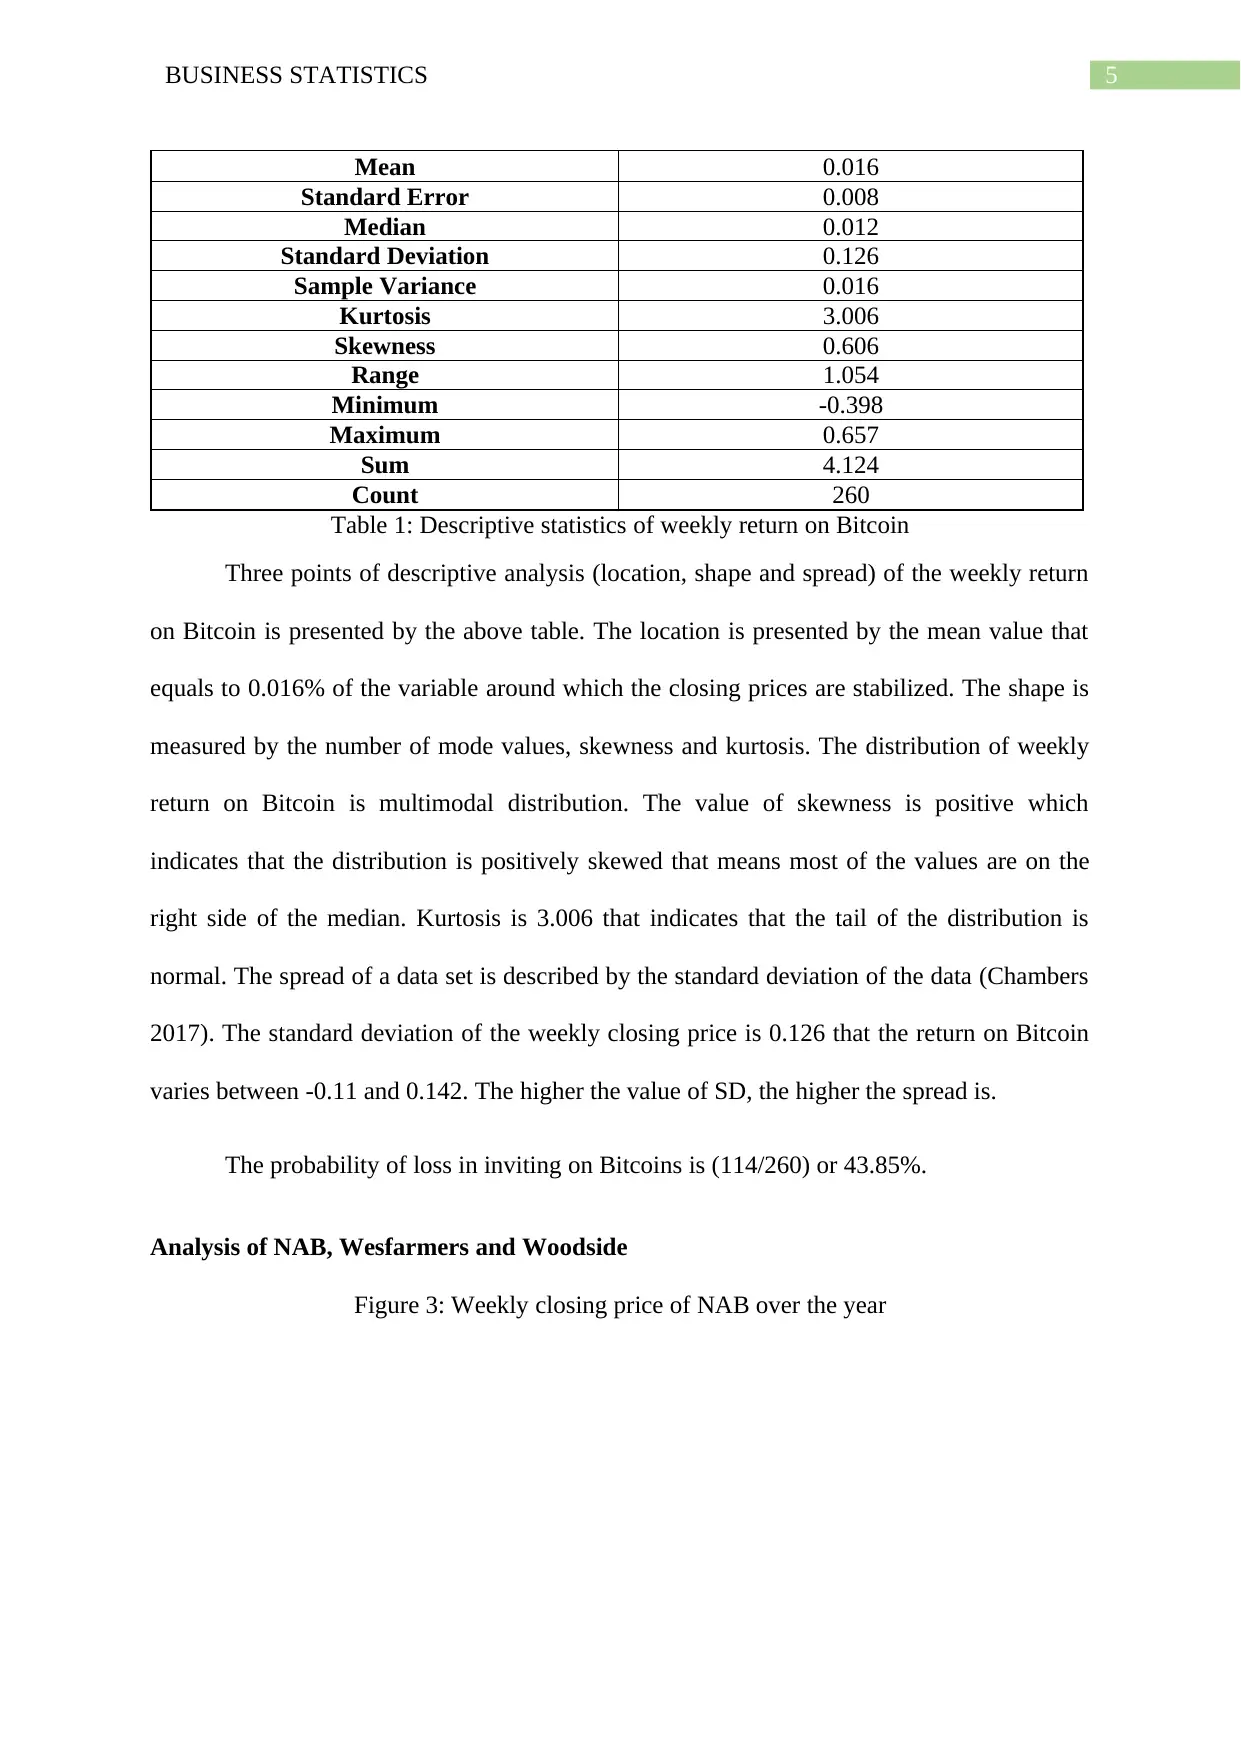
Mean 0.016
Standard Error 0.008
Median 0.012
Standard Deviation 0.126
Sample Variance 0.016
Kurtosis 3.006
Skewness 0.606
Range 1.054
Minimum -0.398
Maximum 0.657
Sum 4.124
Count 260
Table 1: Descriptive statistics of weekly return on Bitcoin
Three points of descriptive analysis (location, shape and spread) of the weekly return
on Bitcoin is presented by the above table. The location is presented by the mean value that
equals to 0.016% of the variable around which the closing prices are stabilized. The shape is
measured by the number of mode values, skewness and kurtosis. The distribution of weekly
return on Bitcoin is multimodal distribution. The value of skewness is positive which
indicates that the distribution is positively skewed that means most of the values are on the
right side of the median. Kurtosis is 3.006 that indicates that the tail of the distribution is
normal. The spread of a data set is described by the standard deviation of the data (Chambers
2017). The standard deviation of the weekly closing price is 0.126 that the return on Bitcoin
varies between -0.11 and 0.142. The higher the value of SD, the higher the spread is.
The probability of loss in inviting on Bitcoins is (114/260) or 43.85%.
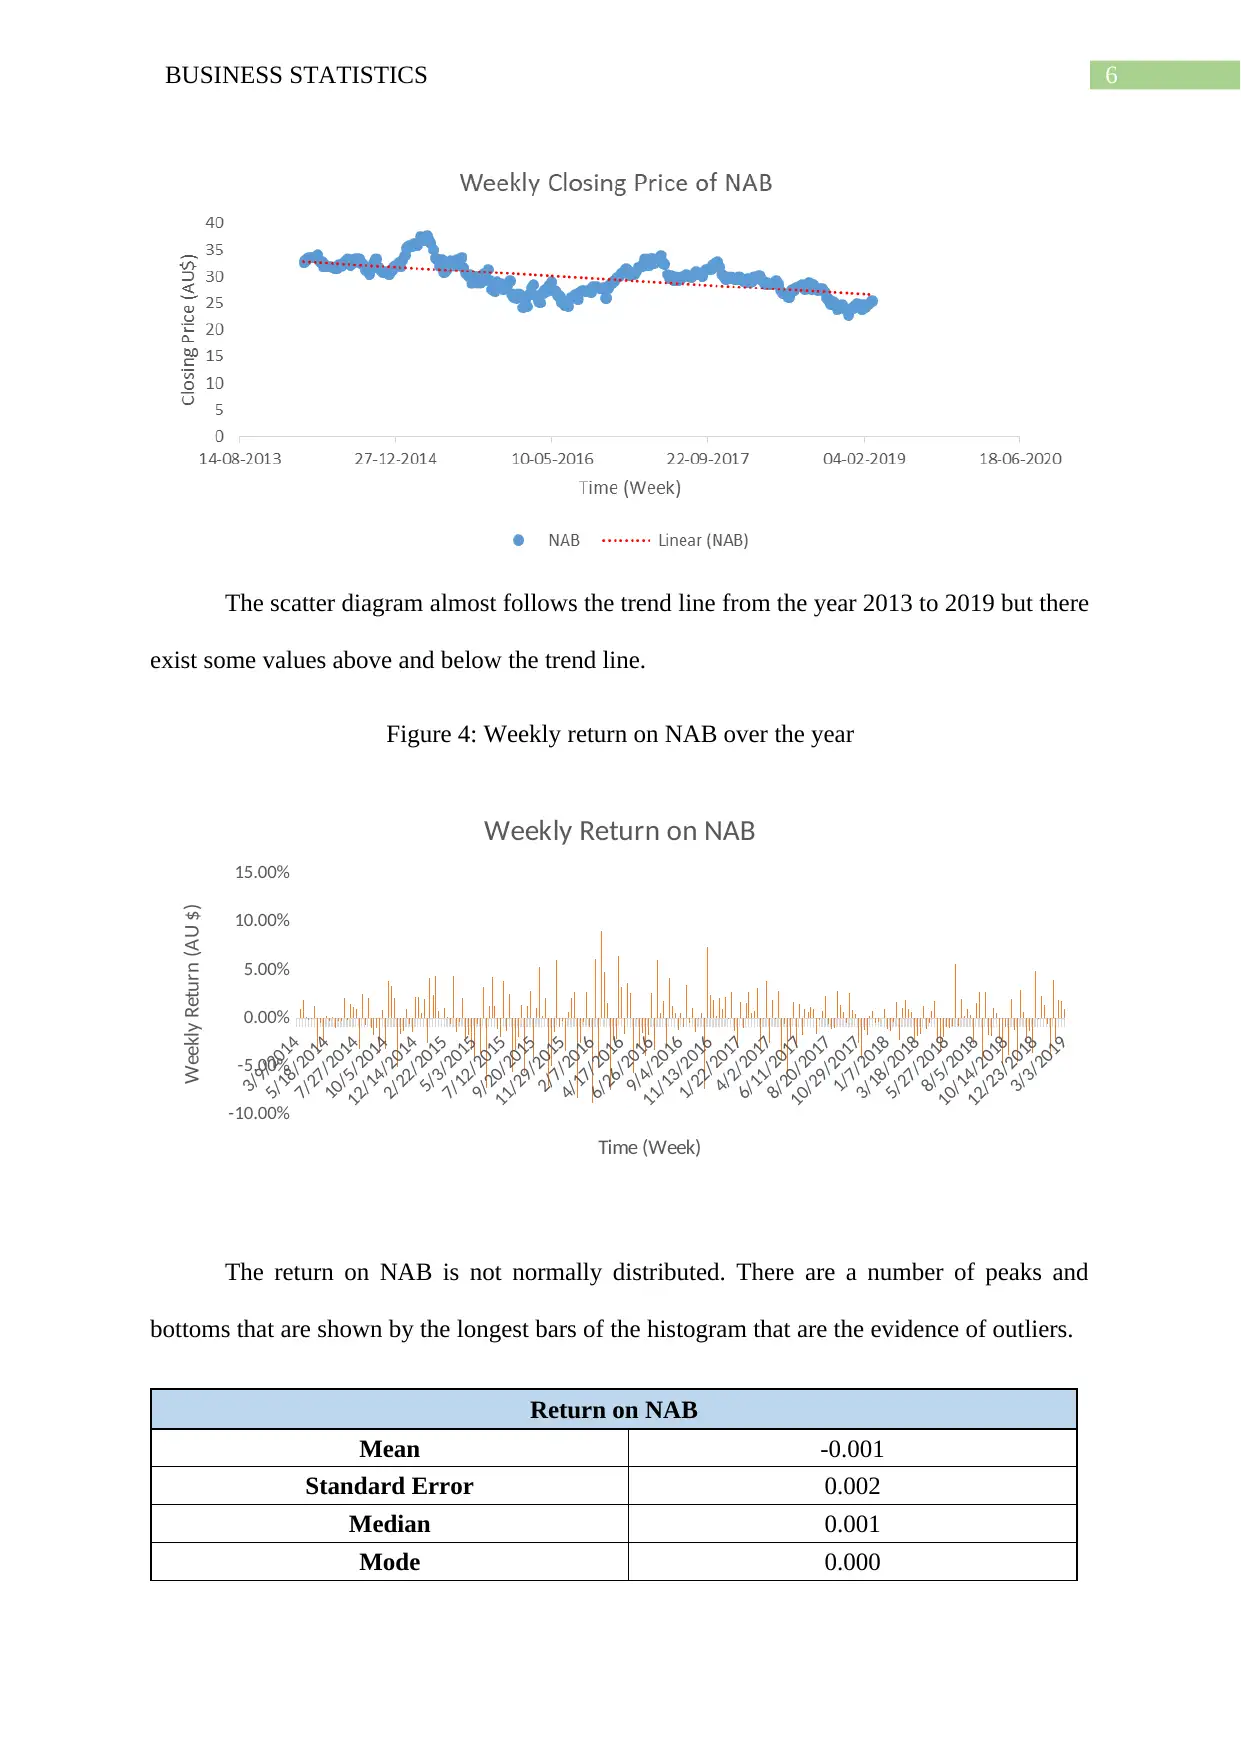
Analysis of NAB, Wesfarmers and Woodside
Figure 3: Weekly closing price of NAB over the year
Mean 0.016
Standard Error 0.008
Median 0.012
Standard Deviation 0.126
Sample Variance 0.016
Kurtosis 3.006
Skewness 0.606
Range 1.054
Minimum -0.398
Maximum 0.657
Sum 4.124
Count 260
Table 1: Descriptive statistics of weekly return on Bitcoin
Three points of descriptive analysis (location, shape and spread) of the weekly return
on Bitcoin is presented by the above table. The location is presented by the mean value that
equals to 0.016% of the variable around which the closing prices are stabilized. The shape is
measured by the number of mode values, skewness and kurtosis. The distribution of weekly
return on Bitcoin is multimodal distribution. The value of skewness is positive which
indicates that the distribution is positively skewed that means most of the values are on the
right side of the median. Kurtosis is 3.006 that indicates that the tail of the distribution is
normal. The spread of a data set is described by the standard deviation of the data (Chambers
2017). The standard deviation of the weekly closing price is 0.126 that the return on Bitcoin
varies between -0.11 and 0.142. The higher the value of SD, the higher the spread is.
The probability of loss in inviting on Bitcoins is (114/260) or 43.85%.
Analysis of NAB, Wesfarmers and Woodside
Figure 3: Weekly closing price of NAB over the year
⊘ This is a preview!⊘
Do you want full access?
Subscribe today to unlock all pages.
Trusted by 1+ million students worldwide
6BUSINESS STATISTICS
The scatter diagram almost follows the trend line from the year 2013 to 2019 but there
exist some values above and below the trend line.
Figure 4: Weekly return on NAB over the year
3/9/2014
5/18/2014
7/27/2014
10/5/2014
12/14/2014
2/22/2015
5/3/2015
7/12/2015
9/20/2015
11/29/2015
2/7/2016
4/17/2016
6/26/2016
9/4/2016
11/13/2016
1/22/2017
4/2/2017
6/11/2017
8/20/2017
10/29/2017
1/7/2018
3/18/2018
5/27/2018
8/5/2018
10/14/2018
12/23/2018
3/3/2019
-10.00%
-5.00%
0.00%
5.00%
10.00%
15.00%
Weekly Return on NAB
Time (Week)
Weekly Return (AU $)
The return on NAB is not normally distributed. There are a number of peaks and
bottoms that are shown by the longest bars of the histogram that are the evidence of outliers.
Return on NAB
Mean -0.001
Standard Error 0.002
Median 0.001
Mode 0.000
Paraphrase This Document
Need a fresh take? Get an instant paraphrase of this document with our AI Paraphraser
7BUSINESS STATISTICS
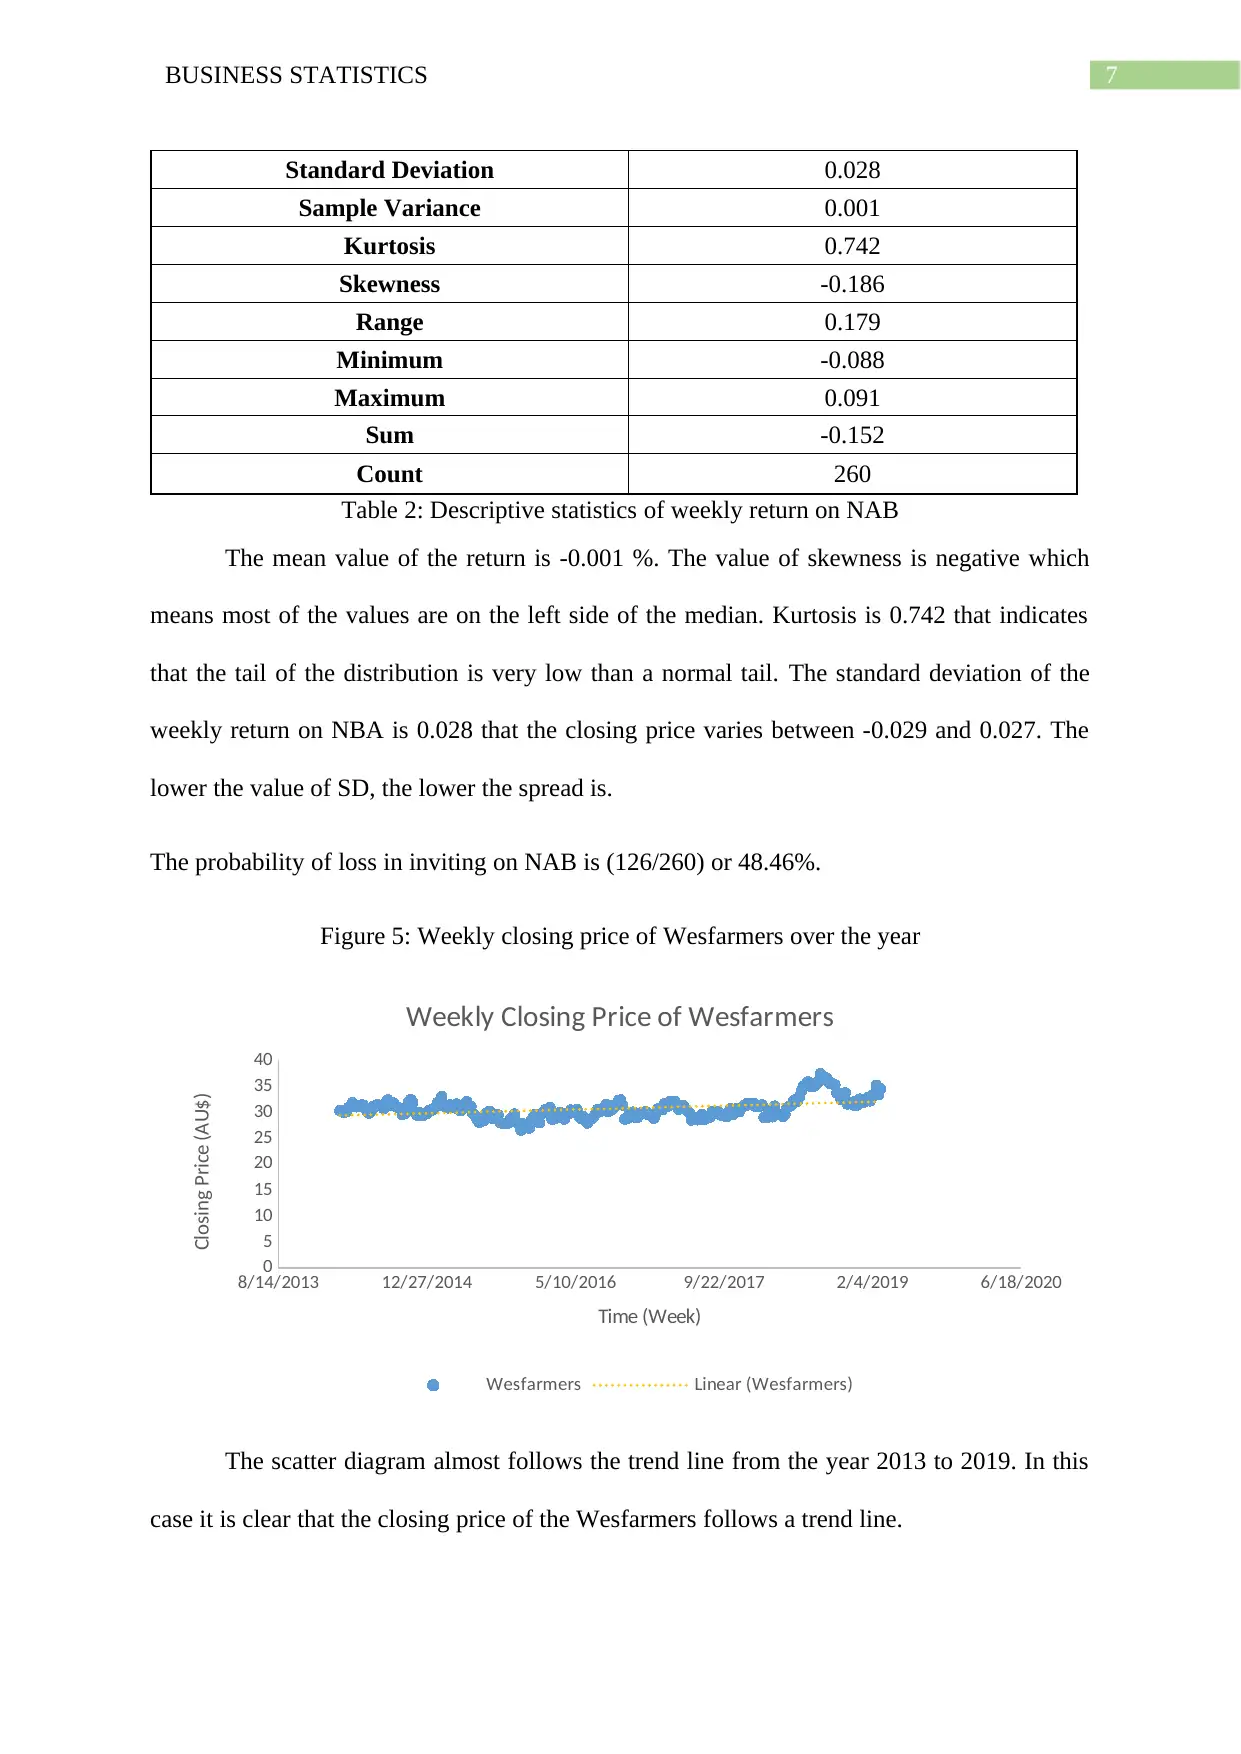
Standard Deviation 0.028
Sample Variance 0.001
Kurtosis 0.742
Skewness -0.186
Range 0.179
Minimum -0.088
Maximum 0.091
Sum -0.152
Count 260
Table 2: Descriptive statistics of weekly return on NAB
The mean value of the return is -0.001 %. The value of skewness is negative which
means most of the values are on the left side of the median. Kurtosis is 0.742 that indicates
that the tail of the distribution is very low than a normal tail. The standard deviation of the
weekly return on NBA is 0.028 that the closing price varies between -0.029 and 0.027. The
lower the value of SD, the lower the spread is.
The probability of loss in inviting on NAB is (126/260) or 48.46%.
Figure 5: Weekly closing price of Wesfarmers over the year
8/14/2013 12/27/2014 5/10/2016 9/22/2017 2/4/2019 6/18/2020
0
5
10
15
20
25
30
35
40
Weekly Closing Price of Wesfarmers
Wesfarmers Linear (Wesfarmers)
Time (Week)
Closing Price (AU$)
The scatter diagram almost follows the trend line from the year 2013 to 2019. In this
case it is clear that the closing price of the Wesfarmers follows a trend line.
8BUSINESS STATISTICS
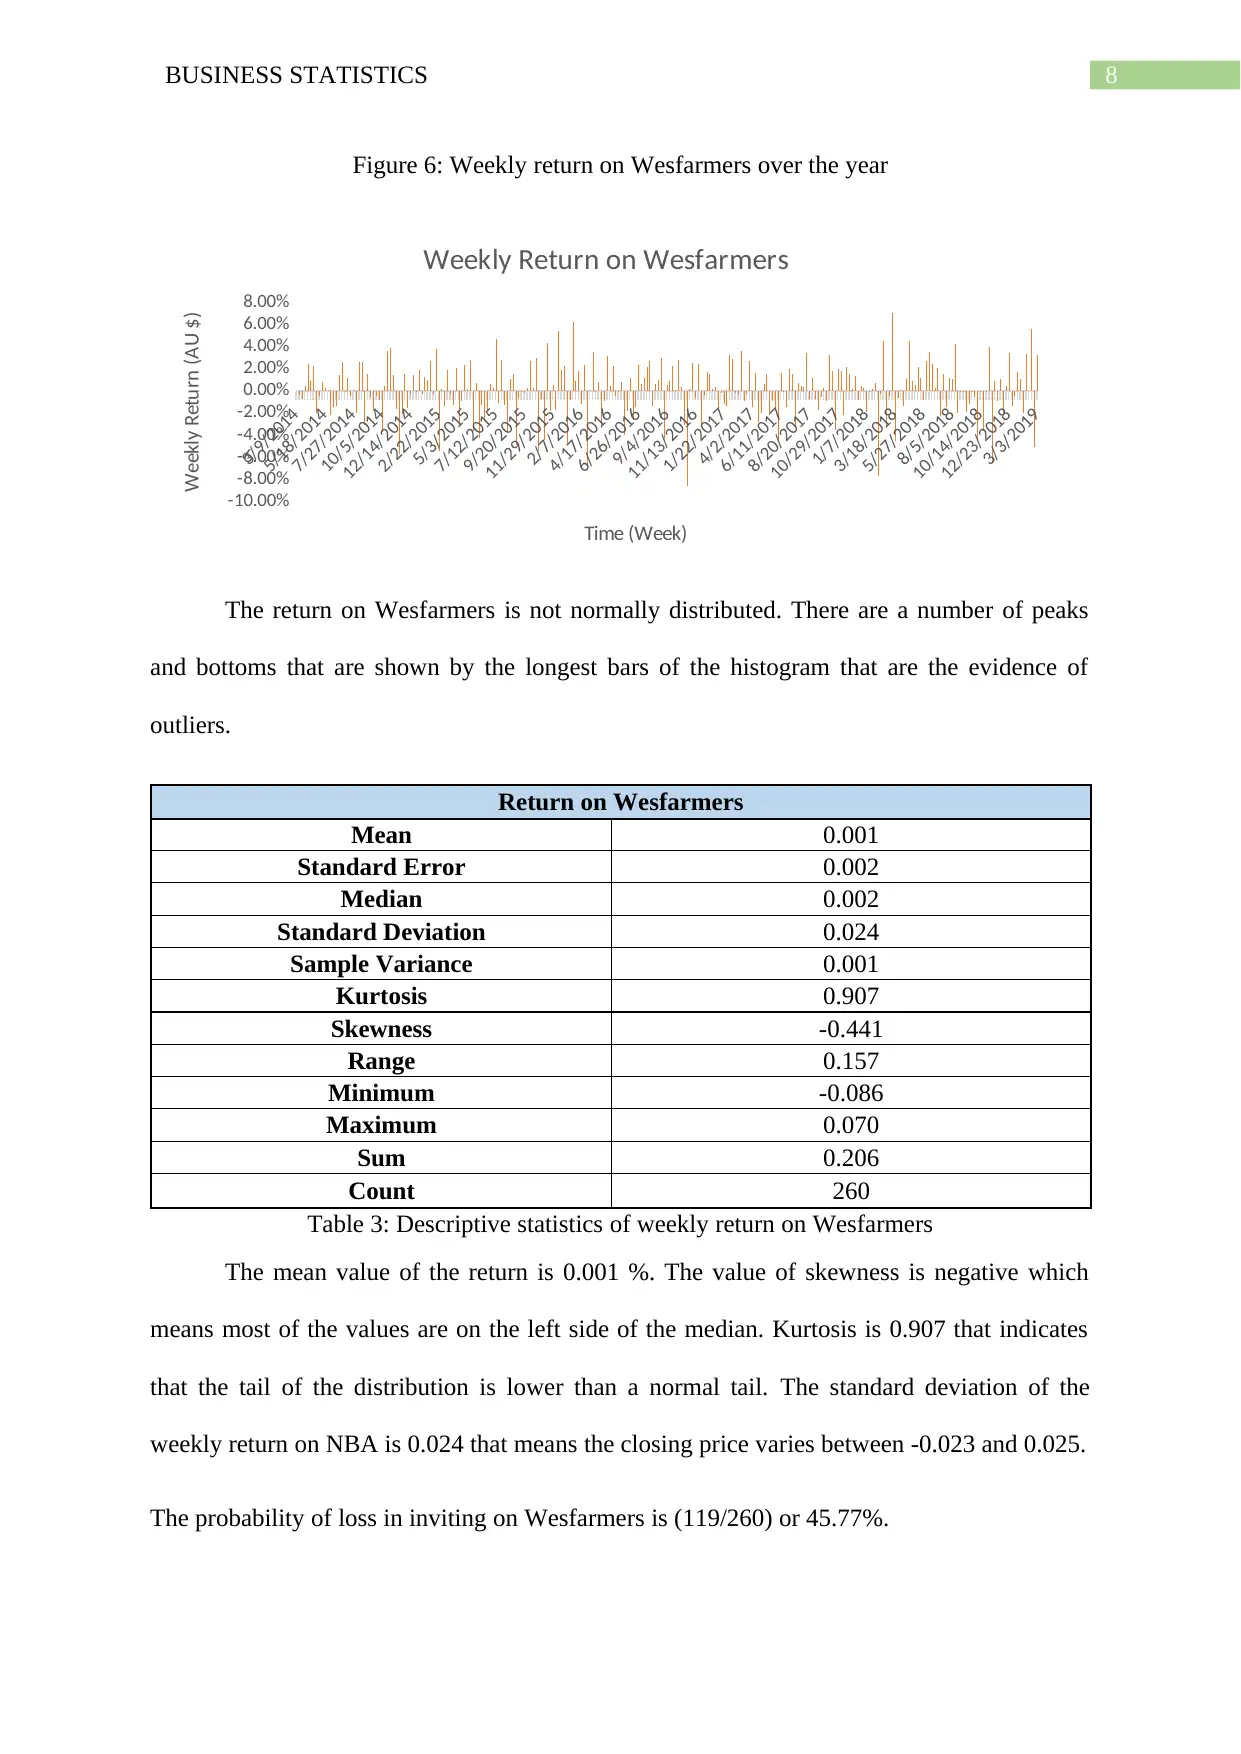
Figure 6: Weekly return on Wesfarmers over the year
3/9/2014
5/18/2014
7/27/2014
10/5/2014
12/14/2014
2/22/2015
5/3/2015
7/12/2015
9/20/2015
11/29/2015
2/7/2016
4/17/2016
6/26/2016
9/4/2016
11/13/2016
1/22/2017
4/2/2017
6/11/2017
8/20/2017
10/29/2017
1/7/2018
3/18/2018
5/27/2018
8/5/2018
10/14/2018
12/23/2018
3/3/2019
-10.00%
-8.00%
-6.00%
-4.00%
-2.00%
0.00%
2.00%
4.00%
6.00%
8.00%
Weekly Return on Wesfarmers
Time (Week)
Weekly Return (AU $)
The return on Wesfarmers is not normally distributed. There are a number of peaks
and bottoms that are shown by the longest bars of the histogram that are the evidence of
outliers.
Return on Wesfarmers
Mean 0.001
Standard Error 0.002
Median 0.002
Standard Deviation 0.024
Sample Variance 0.001
Kurtosis 0.907
Skewness -0.441
Range 0.157
Minimum -0.086
Maximum 0.070
Sum 0.206
Count 260
Table 3: Descriptive statistics of weekly return on Wesfarmers
The mean value of the return is 0.001 %. The value of skewness is negative which
means most of the values are on the left side of the median. Kurtosis is 0.907 that indicates
that the tail of the distribution is lower than a normal tail. The standard deviation of the
weekly return on NBA is 0.024 that means the closing price varies between -0.023 and 0.025.
The probability of loss in inviting on Wesfarmers is (119/260) or 45.77%.
⊘ This is a preview!⊘
Do you want full access?
Subscribe today to unlock all pages.
Trusted by 1+ million students worldwide
9BUSINESS STATISTICS
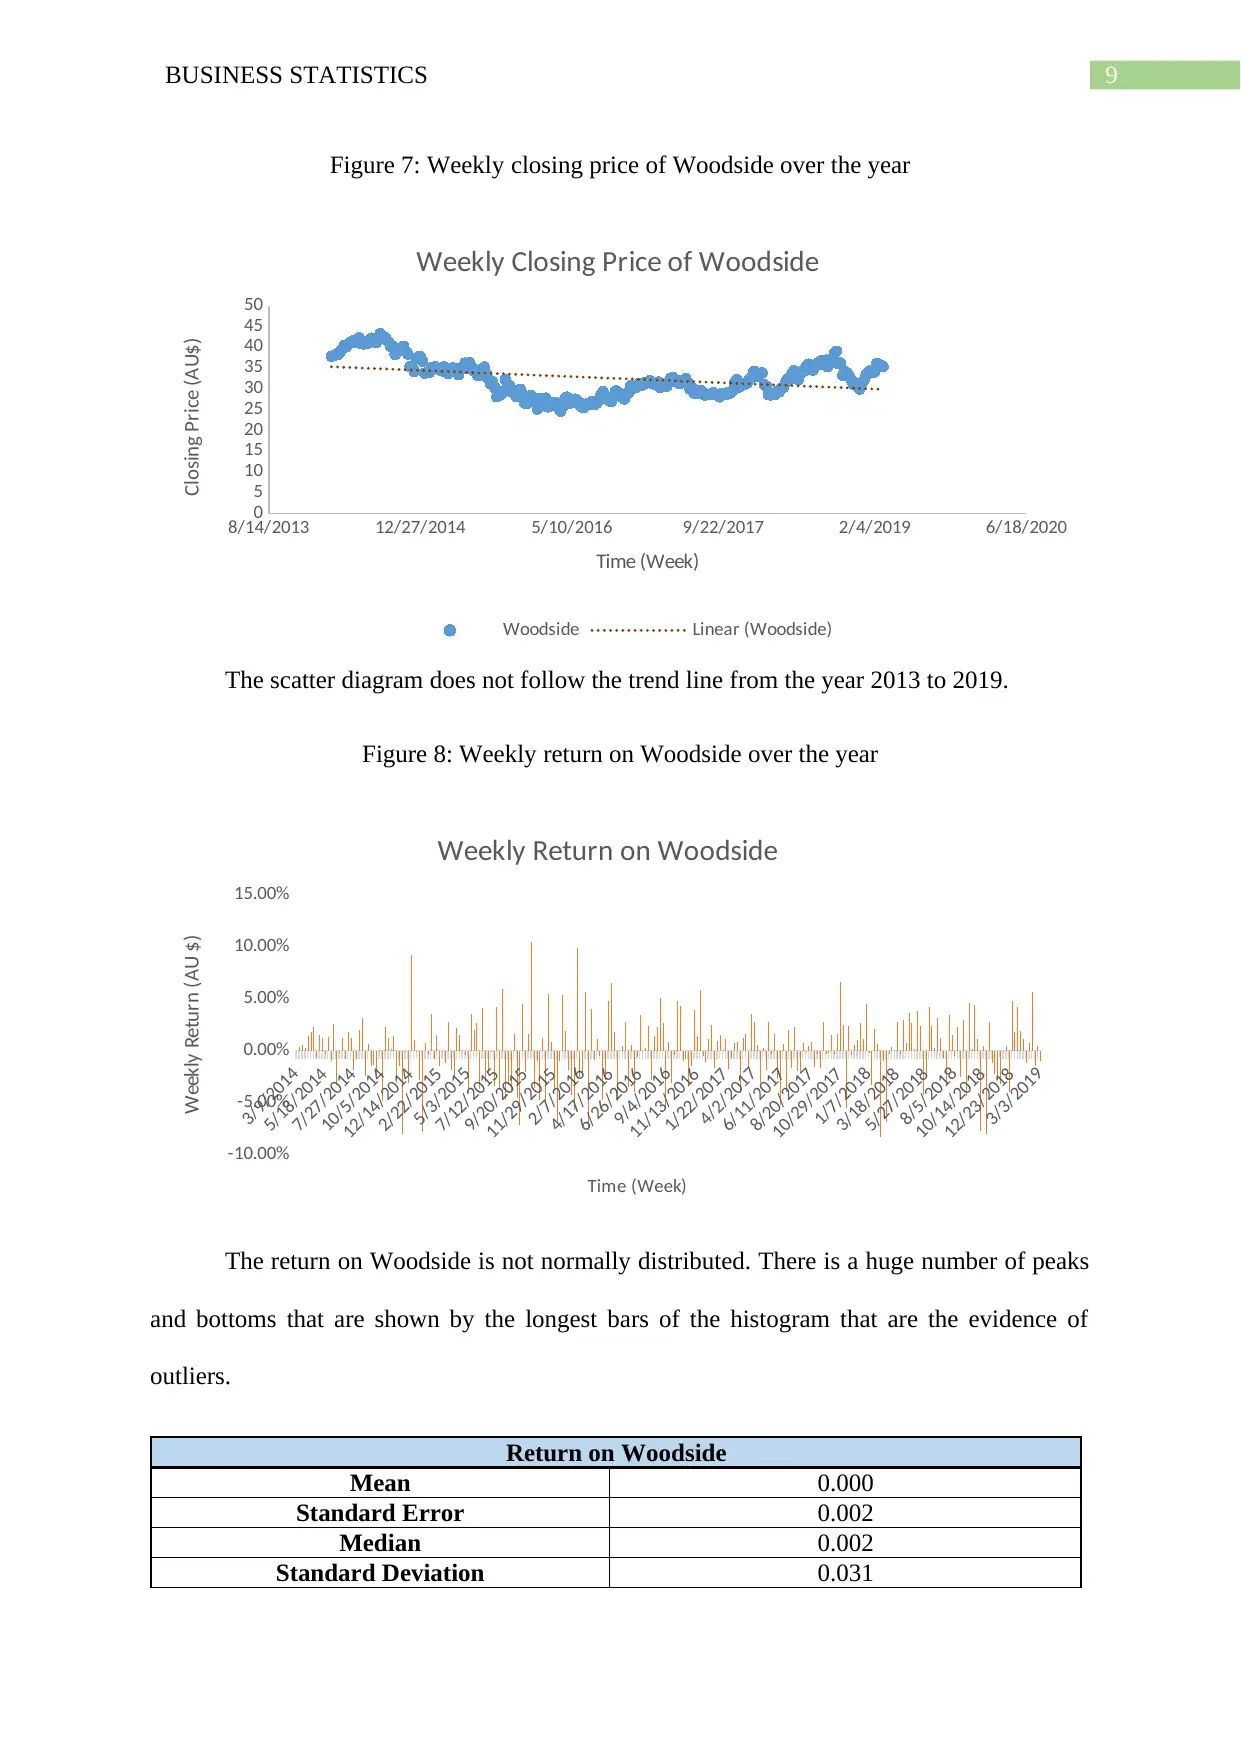
Figure 7: Weekly closing price of Woodside over the year
8/14/2013 12/27/2014 5/10/2016 9/22/2017 2/4/2019 6/18/2020
0
5
10
15
20
25
30
35
40
45
50
Weekly Closing Price of Woodside
Woodside Linear (Woodside)
Time (Week)
Closing Price (AU$)
The scatter diagram does not follow the trend line from the year 2013 to 2019.
Figure 8: Weekly return on Woodside over the year
3/9/2014
5/18/2014
7/27/2014
10/5/2014
12/14/2014
2/22/2015
5/3/2015
7/12/2015
9/20/2015
11/29/2015
2/7/2016
4/17/2016
6/26/2016
9/4/2016
11/13/2016
1/22/2017
4/2/2017
6/11/2017
8/20/2017
10/29/2017
1/7/2018
3/18/2018
5/27/2018
8/5/2018
10/14/2018
12/23/2018
3/3/2019
-10.00%
-5.00%
0.00%
5.00%
10.00%
15.00%
Weekly Return on Woodside
Time (Week)
Weekly Return (AU $)
The return on Woodside is not normally distributed. There is a huge number of peaks
and bottoms that are shown by the longest bars of the histogram that are the evidence of
outliers.
Return on Woodside
Mean 0.000
Standard Error 0.002
Median 0.002
Standard Deviation 0.031
Paraphrase This Document
Need a fresh take? Get an instant paraphrase of this document with our AI Paraphraser
10BUSINESS STATISTICS
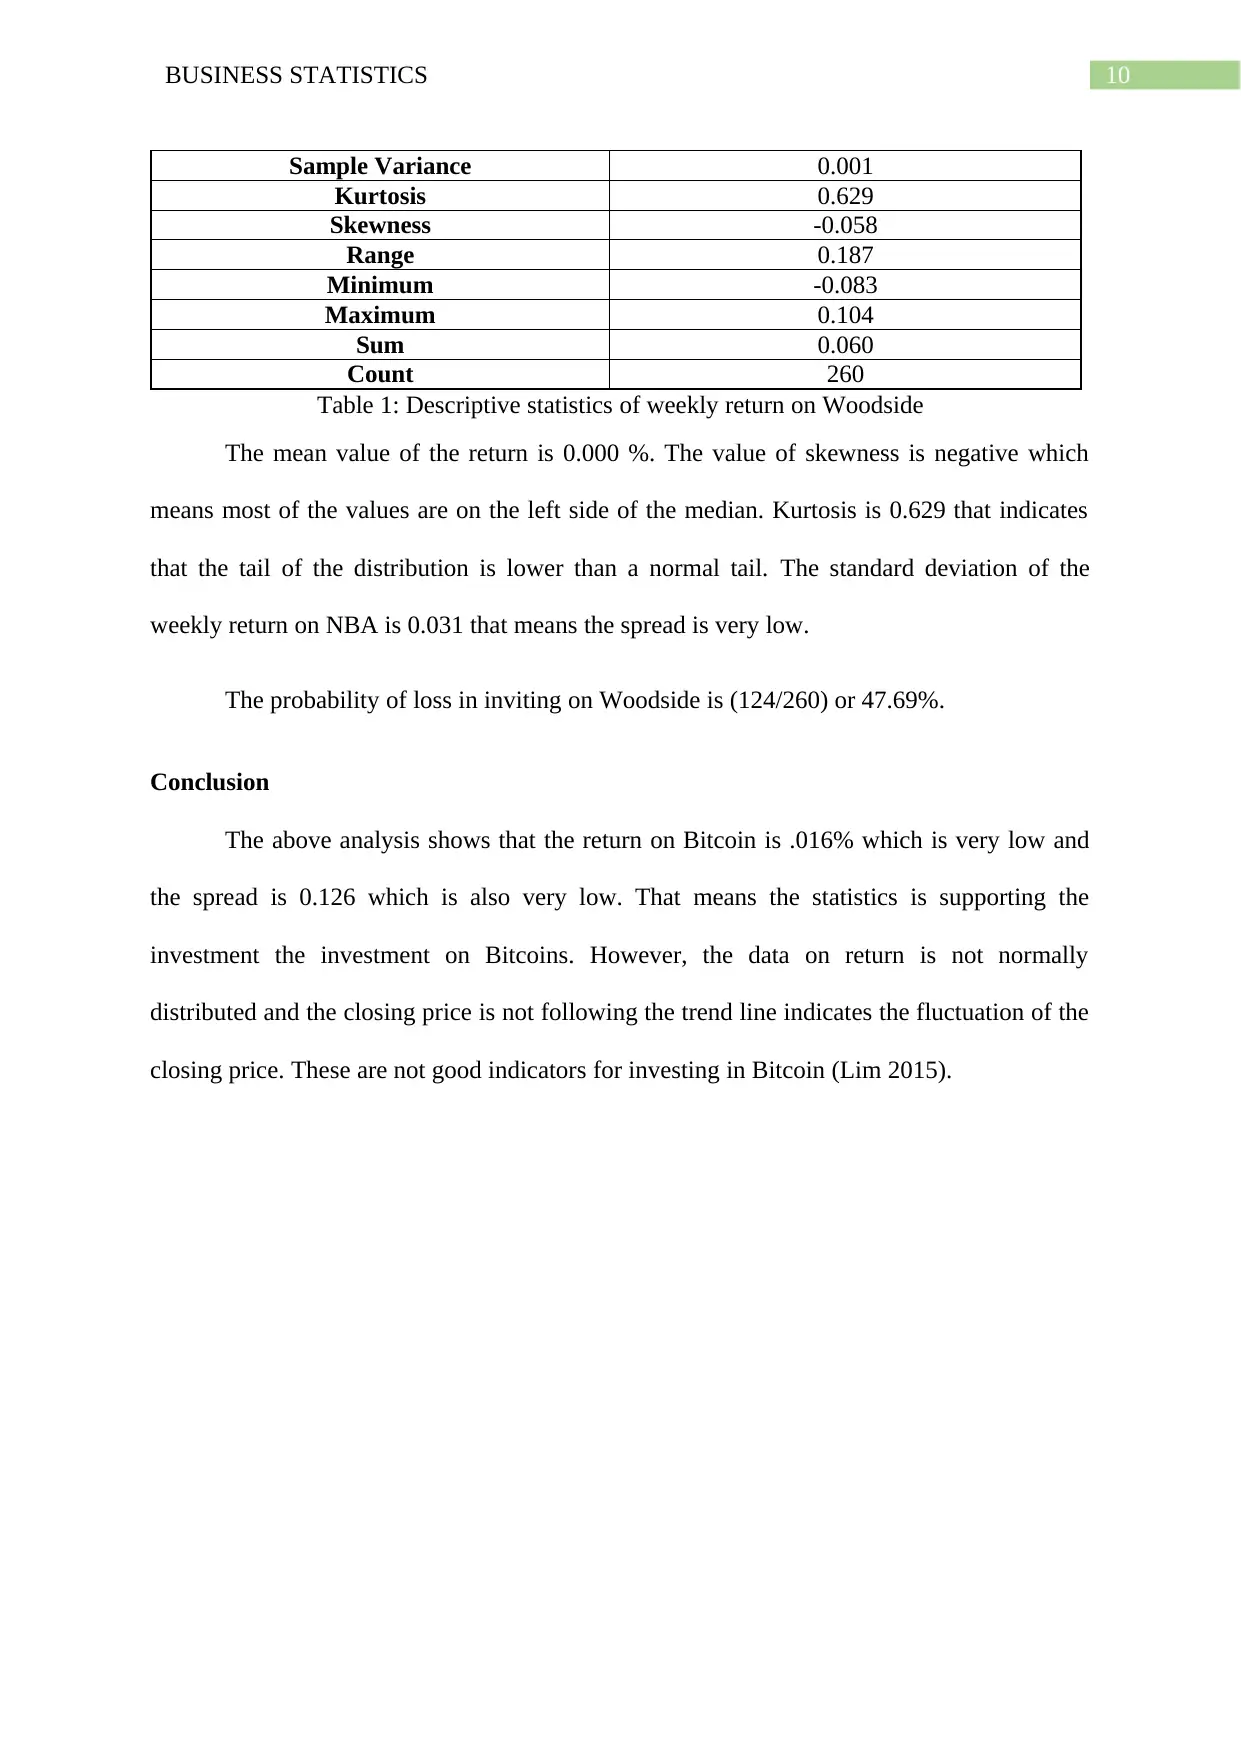
Sample Variance 0.001
Kurtosis 0.629
Skewness -0.058
Range 0.187
Minimum -0.083
Maximum 0.104
Sum 0.060
Count 260
Table 1: Descriptive statistics of weekly return on Woodside
The mean value of the return is 0.000 %. The value of skewness is negative which
means most of the values are on the left side of the median. Kurtosis is 0.629 that indicates
that the tail of the distribution is lower than a normal tail. The standard deviation of the
weekly return on NBA is 0.031 that means the spread is very low.
The probability of loss in inviting on Woodside is (124/260) or 47.69%.
Conclusion
The above analysis shows that the return on Bitcoin is .016% which is very low and
the spread is 0.126 which is also very low. That means the statistics is supporting the
investment the investment on Bitcoins. However, the data on return is not normally
distributed and the closing price is not following the trend line indicates the fluctuation of the
closing price. These are not good indicators for investing in Bitcoin (Lim 2015).
11BUSINESS STATISTICS
Reference
Chambers, J.M., 2017. Graphical Methods for Data Analysis: 0. Chapman and Hall/CRC.
Easley, D., O'Hara, M. and Basu, S., 2019. From mining to markets: The evolution of bitcoin
transaction fees. Journal of Financial Economics.
Güçlü, Y.S., 2018. Multiple Şen-innovative trend analyses and partial Mann-Kendall
test. Journal of Hydrology, 566, pp.685-704.
Lim, K.G., 2015. Financial valuation and econometrics.
⊘ This is a preview!⊘
Do you want full access?
Subscribe today to unlock all pages.
Trusted by 1+ million students worldwide
1 out of 12


Your All-in-One AI-Powered Toolkit for Academic Success.
+13062052269
info@desklib.com
Available 24*7 on WhatsApp / Email
![[object Object]](/_next/static/media/star-bottom.7253800d.svg)
Unlock your academic potential
Copyright © 2020–2026 A2Z Services. All Rights Reserved. Developed and managed by ZUCOL.