HI6007: Statistics and Research Methods Group Assignment Project

Verified

Added on  2022/09/16

|7
|643
|12
Project
AI Summary
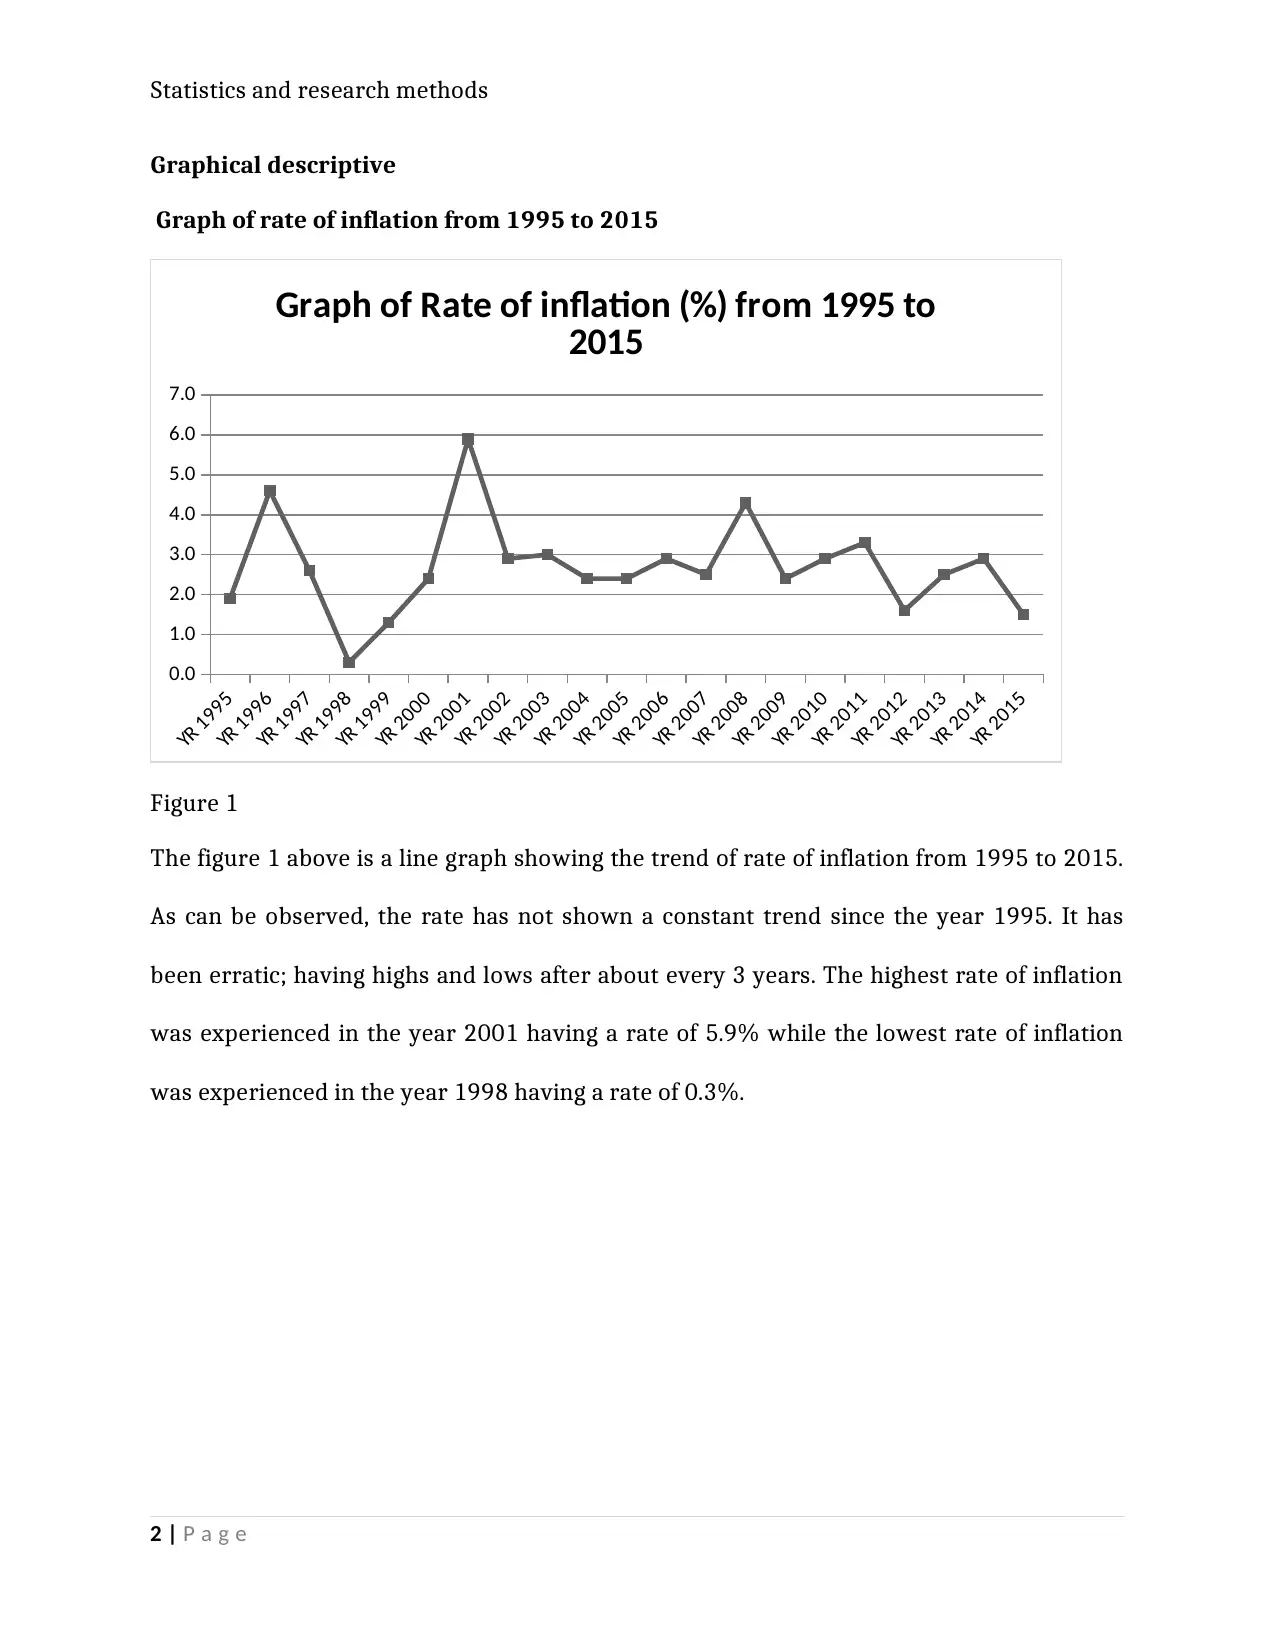
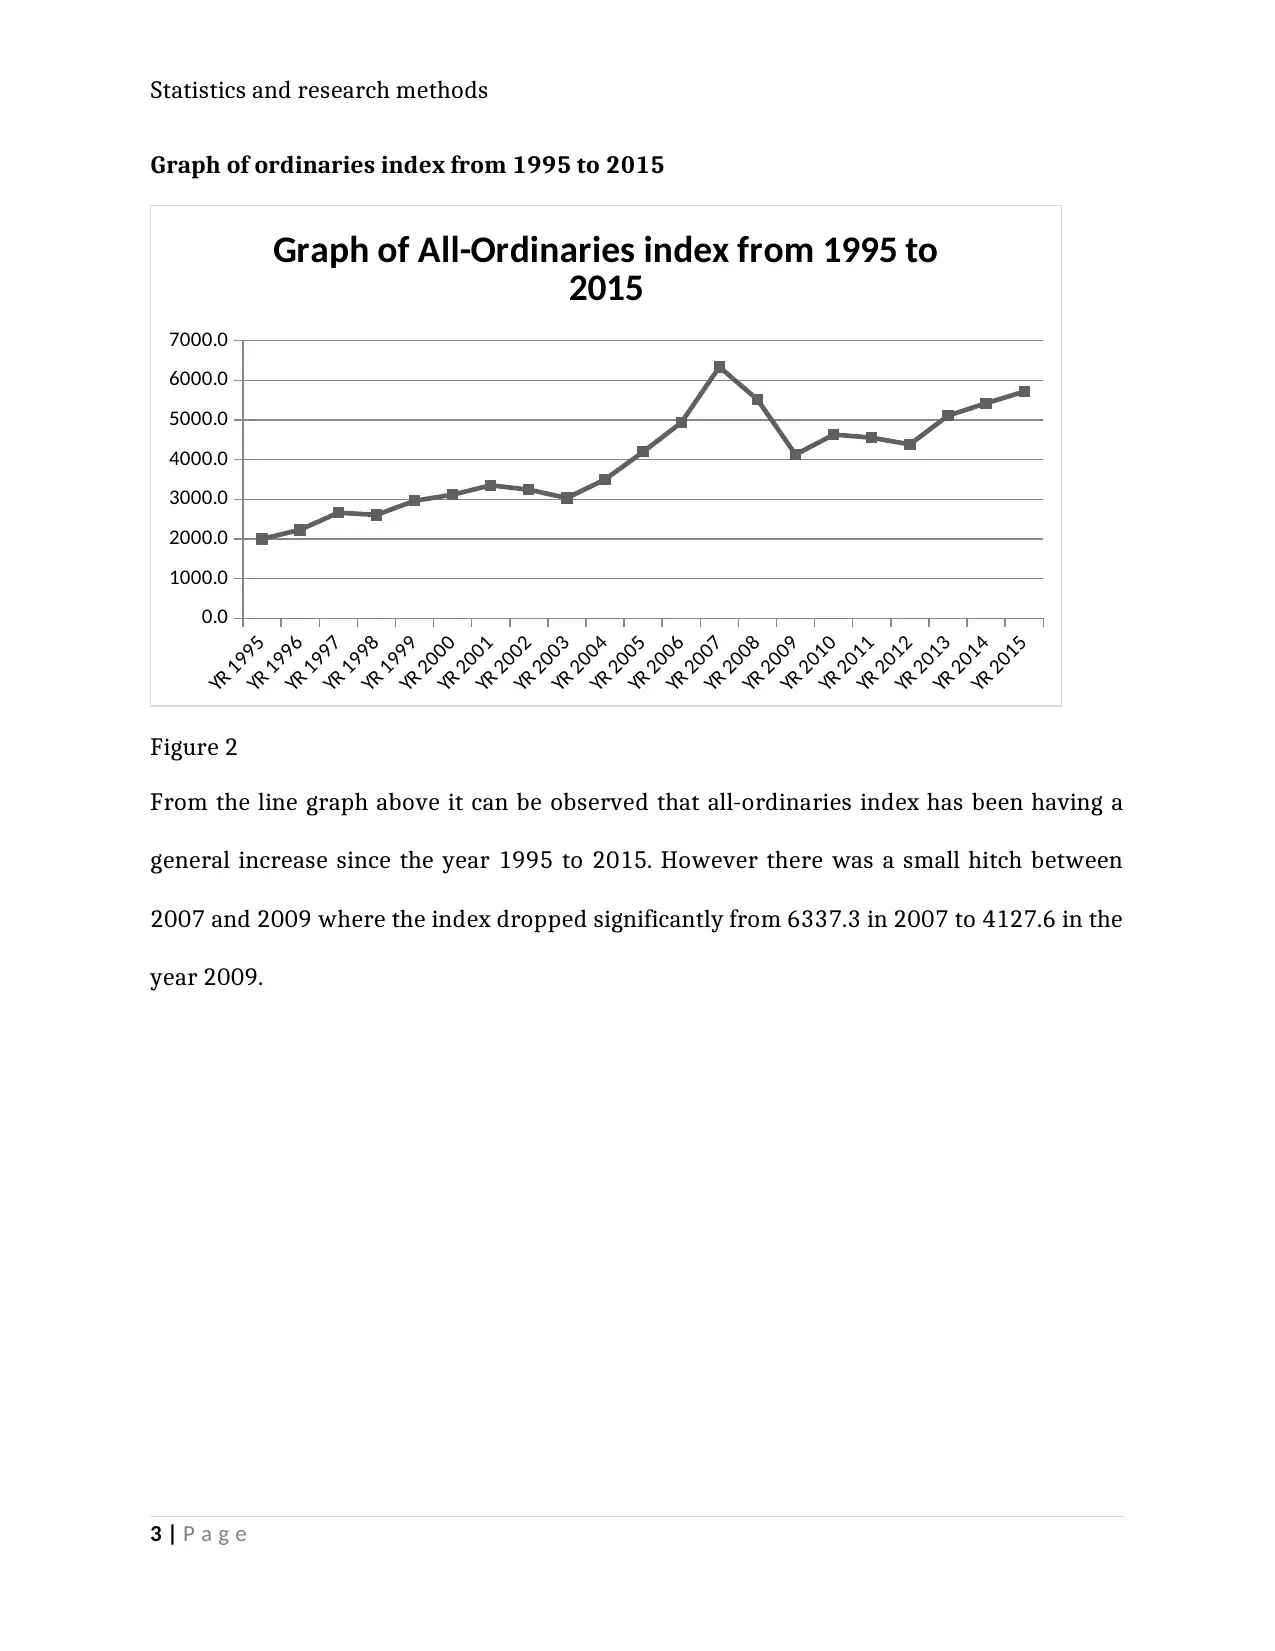
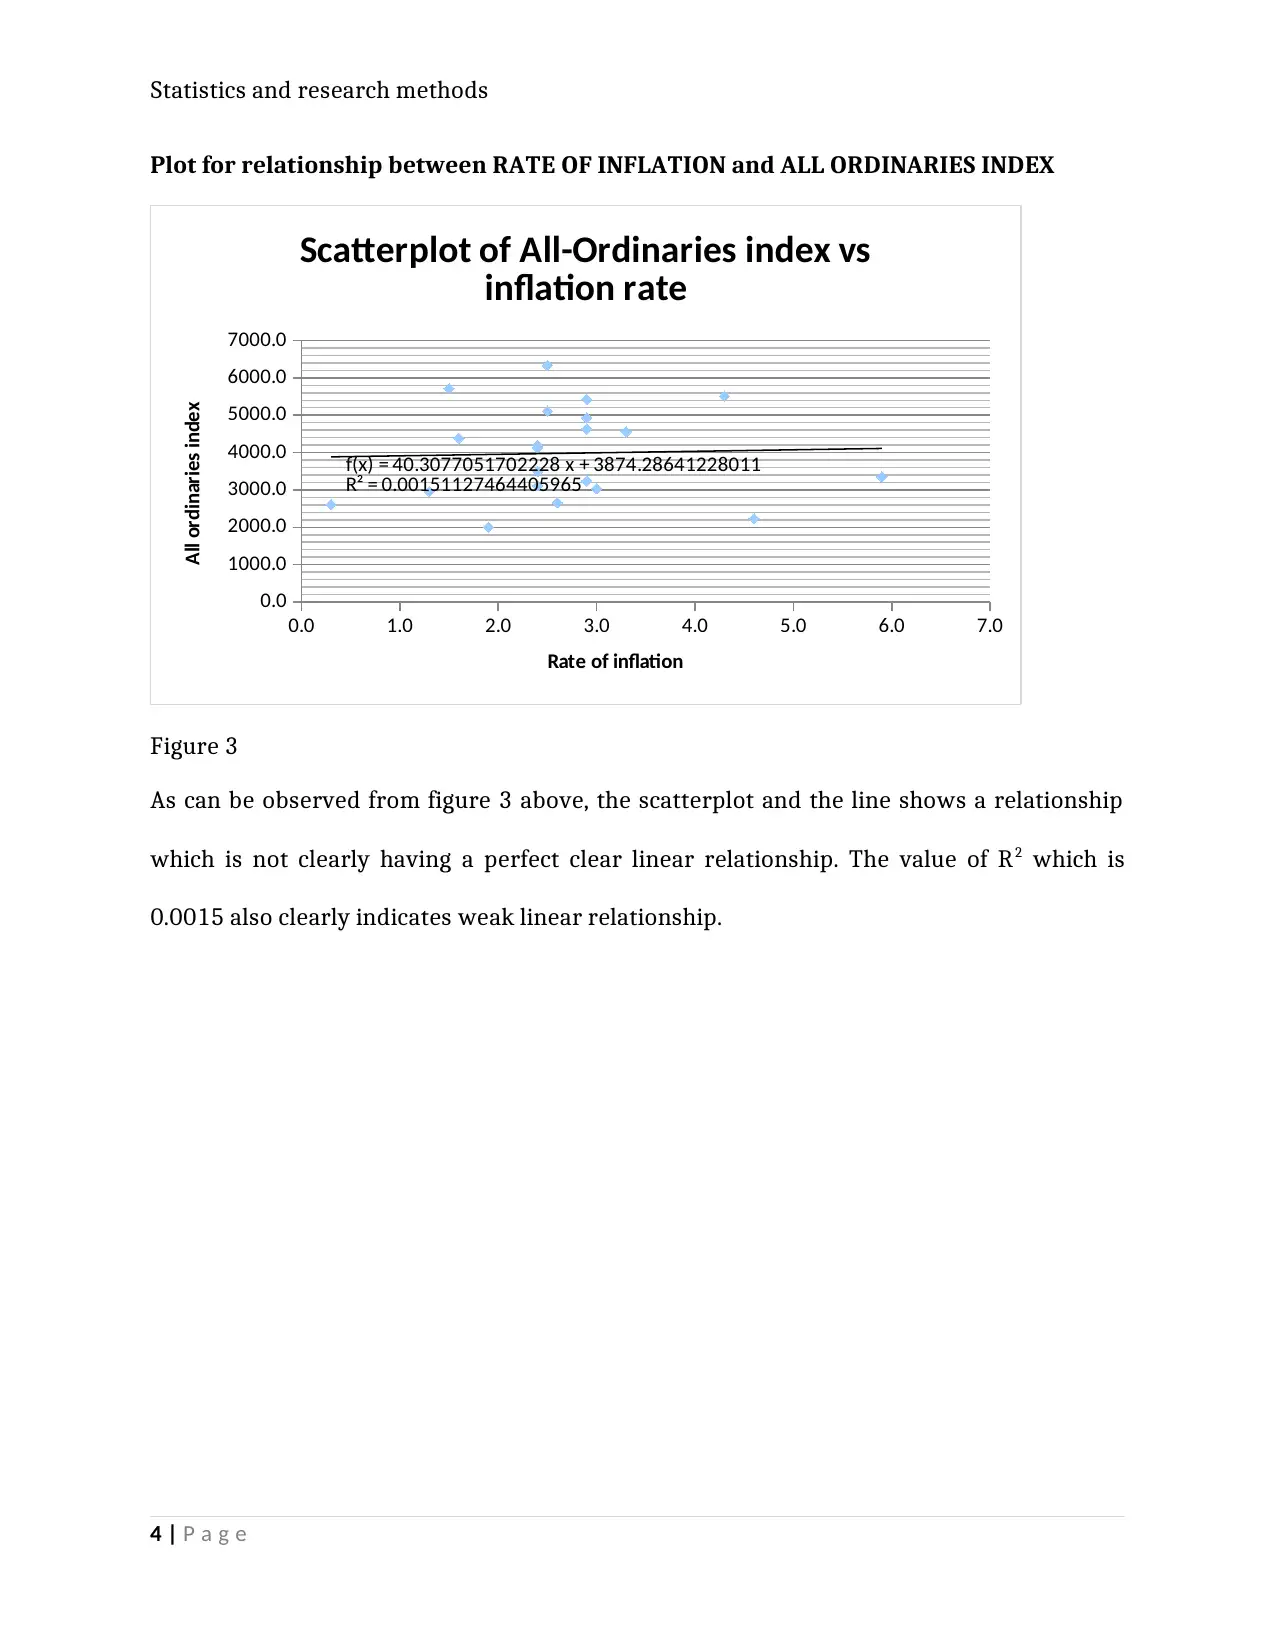
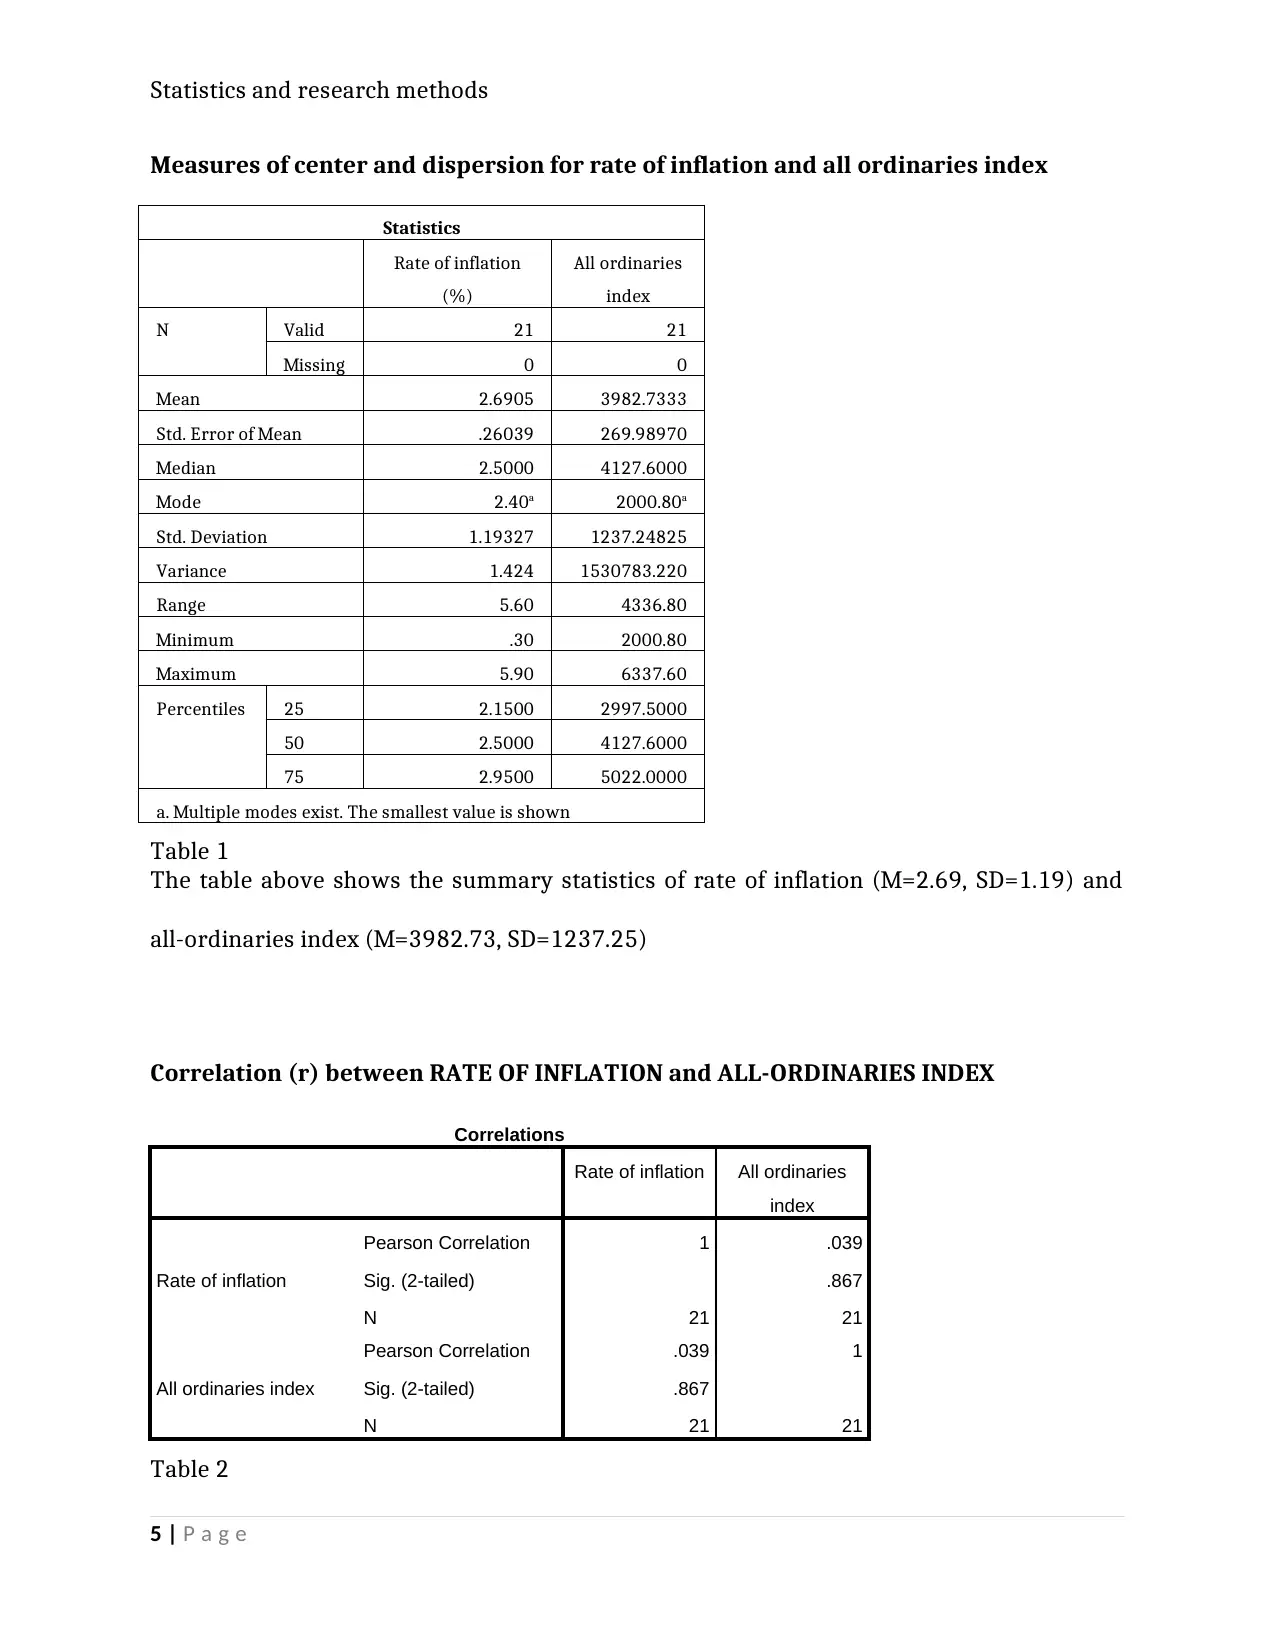
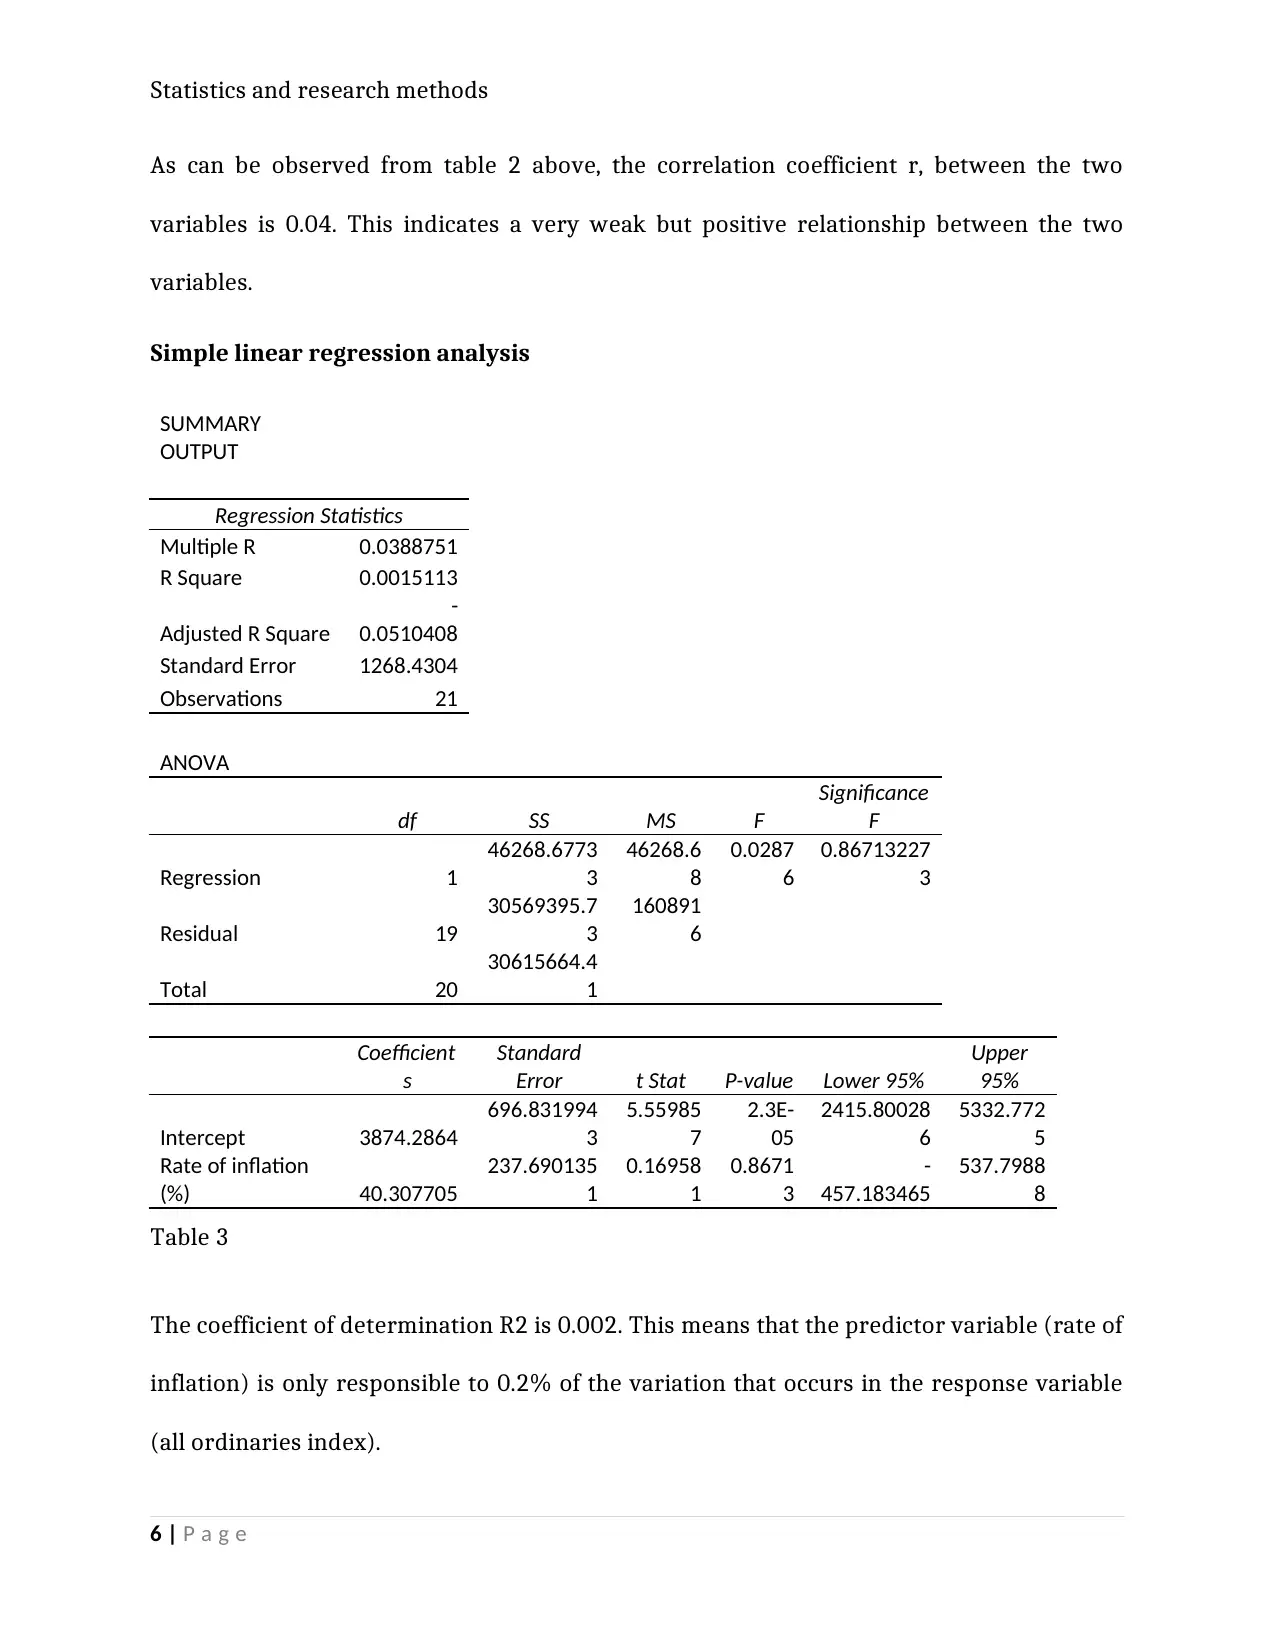
This project analyzes the relationship between the rate of inflation and the all-ordinaries index from 1995 to 2015. It includes graphical representations of the data, such as line graphs and scatterplots, to visualize trends and relationships. The analysis involves calculating measures of center and dispersion, including mean, median, standard deviation, and variance, for both variables. Correlation analysis is performed to determine the strength and direction of the relationship between the two variables. Furthermore, a simple linear regression analysis is conducted to model the relationship, with the results including regression statistics, ANOVA table, and coefficients. The project also interprets the coefficient of determination (R2) and tests the significance of the relationship, providing conclusions based on the statistical findings. The project aims to demonstrate an understanding of statistical principles and techniques relevant to business decision-making.
Document Page
Statistics and research methods
Statistics and Research Methods for Business Decision Making
Student name:
Tutor name
1 | P a g e
tabler-icon-diamond-filled.svg

Paraphrase This Document

Need a fresh take? Get an instant paraphrase of this document with our AI Paraphraser
Document Page
Statistics and research methods
Graphical descriptive
Graph of rate of inflation from 1995 to 2015
YR 1995
YR 1996
YR 1997
YR 1998
YR 1999
YR 2000
YR 2001
YR 2002
YR 2003
YR 2004
YR 2005
YR 2006
YR 2007
YR 2008
YR 2009
YR 2010
YR 2011
YR 2012
YR 2013
YR 2014
YR 2015
0.0
1.0
2.0
3.0
4.0
5.0
6.0
7.0
Graph of Rate of inflation (%) from 1995 to
2015
Figure 1
The figure 1 above is a line graph showing the trend of rate of inflation from 1995 to 2015.
As can be observed, the rate has not shown a constant trend since the year 1995. It has
been erratic; having highs and lows after about every 3 years. The highest rate of inflation
was experienced in the year 2001 having a rate of 5.9% while the lowest rate of inflation
was experienced in the year 1998 having a rate of 0.3%.
2 | P a g e
Document Page
Statistics and research methods
Graph of ordinaries index from 1995 to 2015
YR 1995
YR 1996
YR 1997
YR 1998
YR 1999
YR 2000
YR 2001
YR 2002
YR 2003
YR 2004
YR 2005
YR 2006
YR 2007
YR 2008
YR 2009
YR 2010
YR 2011
YR 2012
YR 2013
YR 2014
YR 2015
0.0
1000.0
2000.0
3000.0
4000.0
5000.0
6000.0
7000.0
Graph of All-Ordinaries index from 1995 to
2015
Figure 2
From the line graph above it can be observed that all-ordinaries index has been having a
general increase since the year 1995 to 2015. However there was a small hitch between
2007 and 2009 where the index dropped significantly from 6337.3 in 2007 to 4127.6 in the
year 2009.
3 | P a g e
Document Page
Statistics and research methods
Plot for relationship between RATE OF INFLATION and ALL ORDINARIES INDEX
0.0 1.0 2.0 3.0 4.0 5.0 6.0 7.0
0.0
1000.0
2000.0
3000.0
4000.0
5000.0
6000.0
7000.0
f(x) = 40.3077051702228 x + 3874.28641228011
R² = 0.00151127464405965
Scatterplot of All-Ordinaries index vs
inflation rate
Rate of inflation
All ordinaries index
Figure 3
As can be observed from figure 3 above, the scatterplot and the line shows a relationship
which is not clearly having a perfect clear linear relationship. The value of R2 which is
0.0015 also clearly indicates weak linear relationship.
4 | P a g e
tabler-icon-diamond-filled.svg

Paraphrase This Document

Need a fresh take? Get an instant paraphrase of this document with our AI Paraphraser
Document Page
Statistics and research methods
Measures of center and dispersion for rate of inflation and all ordinaries index
Statistics
Rate of inflation
(%)
All ordinaries
index
N Valid 21 21
Missing 0 0
Mean 2.6905 3982.7333
Std. Error of Mean .26039 269.98970
Median 2.5000 4127.6000
Mode 2.40a 2000.80a
Std. Deviation 1.19327 1237.24825
Variance 1.424 1530783.220
Range 5.60 4336.80
Minimum .30 2000.80
Maximum 5.90 6337.60
Percentiles 25 2.1500 2997.5000
50 2.5000 4127.6000
75 2.9500 5022.0000
a. Multiple modes exist. The smallest value is shown
Table 1
The table above shows the summary statistics of rate of inflation (M=2.69, SD=1.19) and
all-ordinaries index (M=3982.73, SD=1237.25)
Correlation (r) between RATE OF INFLATION and ALL-ORDINARIES INDEX
Correlations
Rate of inflation All ordinaries
index
Rate of inflation
Pearson Correlation 1 .039
Sig. (2-tailed) .867
N 21 21
All ordinaries index
Pearson Correlation .039 1
Sig. (2-tailed) .867
N 21 21
Table 2
5 | P a g e
Document Page
Statistics and research methods
As can be observed from table 2 above, the correlation coefficient r, between the two
variables is 0.04. This indicates a very weak but positive relationship between the two
variables.
Simple linear regression analysis
SUMMARY
OUTPUT
Regression Statistics
Multiple R 0.0388751
R Square 0.0015113
Adjusted R Square
-
0.0510408
Standard Error 1268.4304
Observations 21
ANOVA
df SS MS F
Significance
F
Regression 1
46268.6773
3
46268.6
8
0.0287
6
0.86713227
3
Residual 19
30569395.7
3
160891
6
Total 20
30615664.4
1
Coefficient
s
Standard
Error t Stat P-value Lower 95%
Upper
95%
Intercept 3874.2864
696.831994
3
5.55985
7
2.3E-
05
2415.80028
6
5332.772
5
Rate of inflation
(%) 40.307705
237.690135
1
0.16958
1
0.8671
3
-
457.183465
537.7988
8
Table 3
The coefficient of determination R2 is 0.002. This means that the predictor variable (rate of
inflation) is only responsible to 0.2% of the variation that occurs in the response variable
(all ordinaries index).
6 | P a g e
Document Page
Statistics and research methods
Testing the significance of the relationship at 0.05 level of significance
Since the p-value of the slope or gradient is 0.87 and is greater than the level of significance
(0.05), we will accept the null hypothesis and conclude that linear relationship between the
two variables is not significant.
The value of the standard error of the estimate is 3874.29. Since the p-value calculated
(0.87) is greater than the level of significance (0.05) it can be concluded that the model is
not the best predictor
7 | P a g e
chevron_up_icon
1 out of 7
circle_padding
hide_on_mobile
zoom_out_icon
[object Object]