Statistics of Business and Finance: Stock Returns Analysis & CAPM

Verified

Added on  2023/06/03

|9
|1388
|439
Homework Assignment
AI Summary
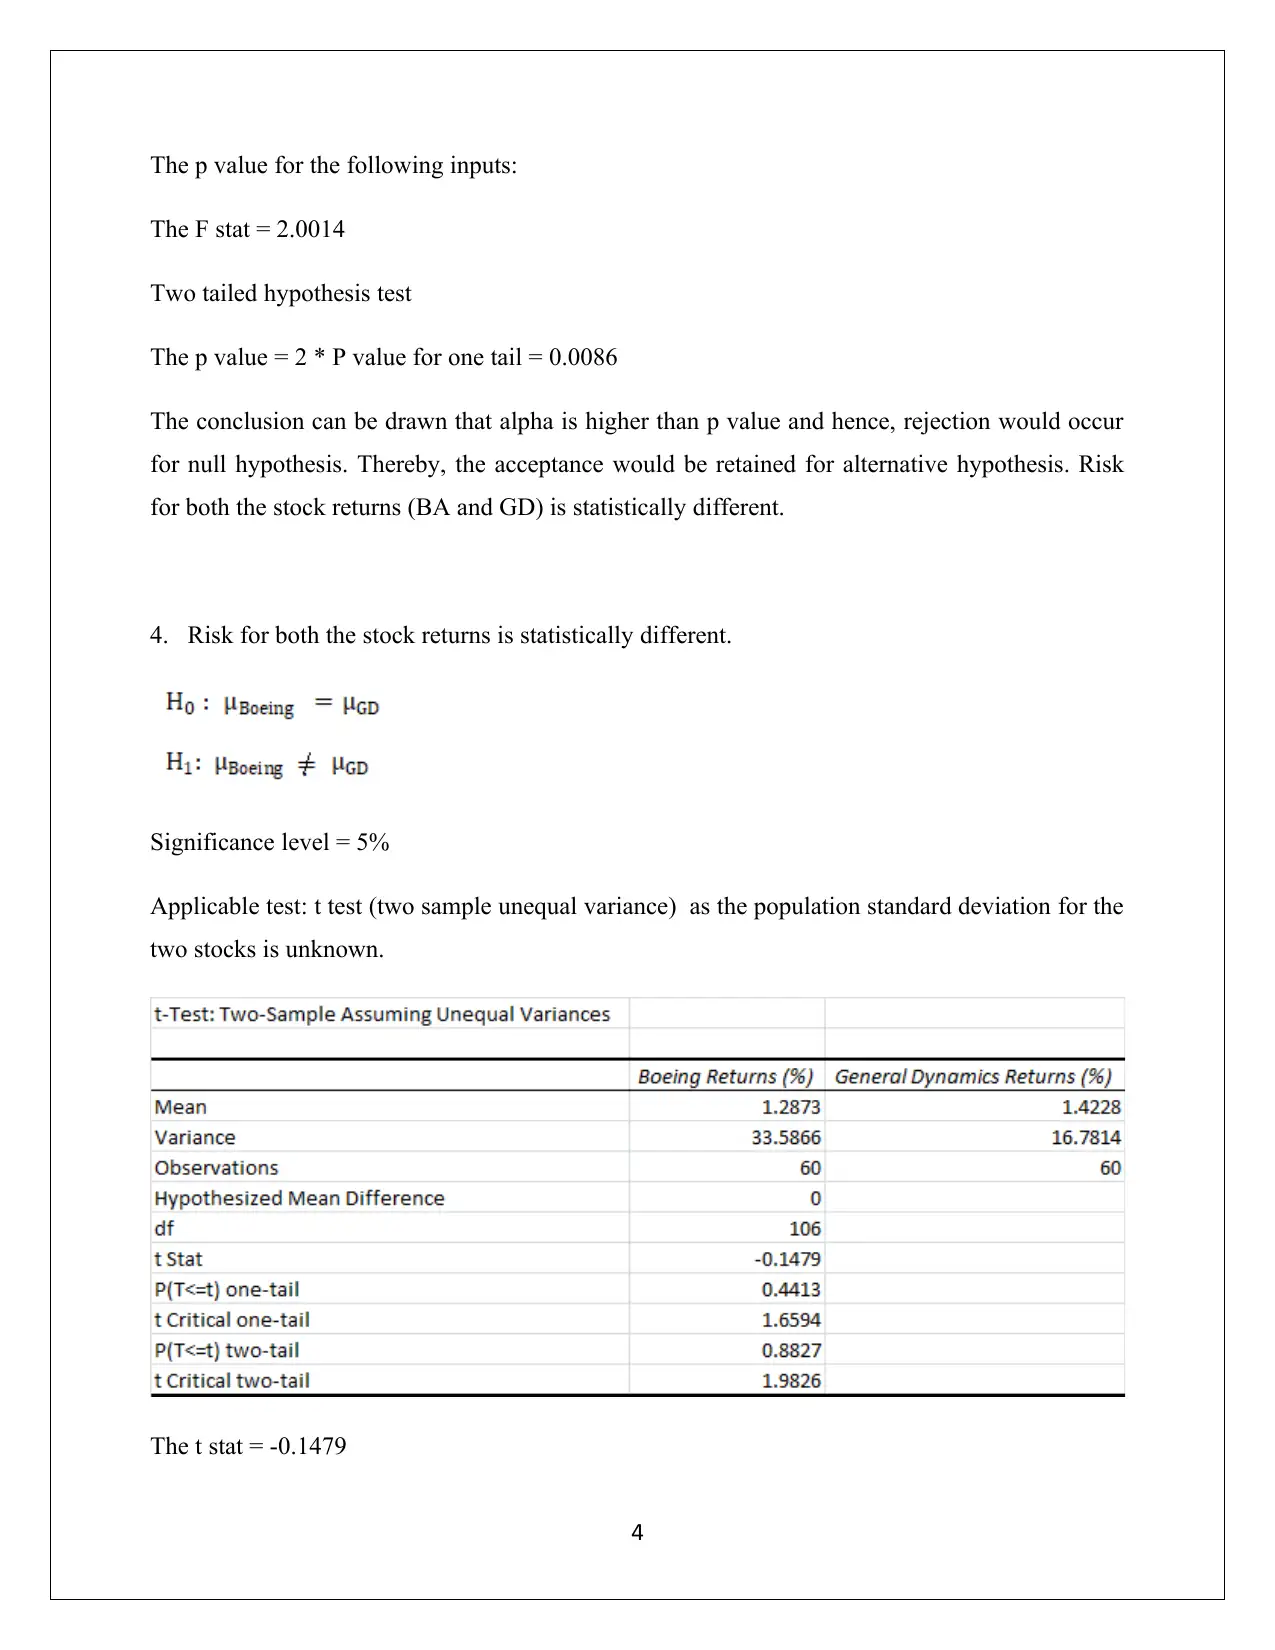
This assignment focuses on the statistical analysis of stock returns for Boeing (BA) and General Dynamics (GD), utilizing hypothesis testing and the Capital Asset Pricing Model (CAPM). The analysis includes Jarque-Bera tests for normality, t-tests for mean return comparison, and F-tests for risk assessment. The study determines that neither Boeing nor General Dynamics returns are normally distributed. Further analysis reveals a statistically significant difference in risk between the two stocks, favoring General Dynamics due to its lower risk profile. The CAPM model is applied to General Dynamics, revealing a beta of 0.652, but the model's explanatory power is limited, as indicated by a low coefficient of determination. The assignment concludes that while General Dynamics may be considered a neutral stock, the residuals of the CAPM model do not satisfy the assumption of normality, suggesting limitations in the model's applicability. Desklib offers more solved assignments and past papers for students.
Document Page
STATISTICS OF BUSINESS AND FINANCE
STUDENT NAME/ID
[Pick the date]
tabler-icon-diamond-filled.svg

Paraphrase This Document

Need a fresh take? Get an instant paraphrase of this document with our AI Paraphraser
Document Page
PART A: CALCULATIONS
1. Returns for Boeing Company (BA), General Dynamics (GD) and S&P Price Index
1
Document Page
Jarque- Berra Test (JB stat)
Formula for JB stat requires sample skew, kurtosis and sample size.
For Boeing Returns
Null hypothesis H0: Boeing Returns is normally distributed.
Alternative hypothesis H1: Boeing Returns is not normally distributed.
The JB stat for BA > Applicable critical value (5.99) and thus, we reject the null hypothesis.
Therefore, Boeing stock returns are not normally distributed.
For General Dynamics Returns
Null hypothesis H0: General Dynamics Returns is normally distributed.
Alternative hypothesis H1: General Dynamics Returns is not normally distributed.
The JB stat for GD > Applicable critical value (5.99) and thus, reject the null hypothesis.
Therefore, General Dynamics Returns is not normally distributed.
2. Mean return of General Dynamics Returns is different from a given percentage 2.8% or not.
Significance level = 5%
2
Document Page
Applicable test statistic: t stat (As population standard deviation is not given) with the test being
two tail.
The conclusion can be drawn that alpha is higher than p value and hence, rejection would occur
for null hypothesis. Thereby, the acceptance would be retained for alternative hypothesis. Mean
return of General Dynamics Returns is different from the given percentage 2.8%.
3. Risk for both the stock returns is statistically different or not.
Significance level = 5%
Applicable test: F stat
3
tabler-icon-diamond-filled.svg

Paraphrase This Document

Need a fresh take? Get an instant paraphrase of this document with our AI Paraphraser
Document Page
The p value for the following inputs:
The F stat = 2.0014
Two tailed hypothesis test
The p value = 2 * P value for one tail = 0.0086
The conclusion can be drawn that alpha is higher than p value and hence, rejection would occur
for null hypothesis. Thereby, the acceptance would be retained for alternative hypothesis. Risk
for both the stock returns (BA and GD) is statistically different.
4. Risk for both the stock returns is statistically different.
Significance level = 5%
Applicable test: t test (two sample unequal variance) as the population standard deviation for the
two stocks is unknown.
The t stat = -0.1479
4
Document Page
The p value = 0.8827
Alpha = 0.05
The conclusion can be drawn that alpha is not higher than p value and hence, rejection would not
occur for null hypothesis. Thereby, returns for both the stock returns (BA and GD) are not
statistically different.
Preferred stock: General Dynamics Returns (GD) owing to the fact the population risk is
different but the population return for the two stocks is not different. Hence, the preferred stock
would be the one with lower risk which is GD. The lower risk for GD is ascertained from the
lower value of standard deviation for returns on this stock based on the sample data.
(5) Taking GD stock into consideration along with the market index return, the excess returns
have been computed taking the risk free rate as the treasury yields. After these have been
computes the CAPM model has been derived using the linear regression model which resembles
the Security Market Line. In this, the independent variable is the excess market returns while the
dependent variable is the excess GD returns which have been computed in the manner
highlighted above. The output from regression analysis in Excel is indicated as follows.
5
Document Page
The CAPM equation is as highlighted below.
Excess returns on GD stock = 0.121 + 0.652* Market Excess Returns
(c) The coefficient of determination has been obtained as 0.2357
(d) The requisite 95% confidence interval for beta in relation to the GD stock is (0.344,0.961).
(6) The hypotheses for testing are as indicated below.
In the given case, it needs to be tested if the stock is neutral or not while that the hypothesised
value would be 1 since for this beta value, the stock is taken as neutral. With regards to
confidence interval based hypothesis testing, null hypothesis rejection is facilitated only when
the confidence interval does not contain hypothesized value. Here, the confidence interval for
beta does not comprise of the neutral value beta (i.e.1) and hence rejection of null hypothesis
takes place.
(7) The normality of the residual plot can be estimated through the Jarque Bera test.
Formula for JB stat requires sample skew, kurtosis and sample size.
For CAPM Residuals
Null hypothesis H0: The residuals of the CAPM model are normally distributed.
Alternative hypothesis H1: The residuals of the CAPM model are not normally distributed.
Significance level = 5%
The computed JB statistic for residuals comes out as 21.19
The JB stat for residuals > Applicable critical value (5.99) and thus, we can reject the null
hypothesis. Therefore, the residual errors are not normally distributed.
6
tabler-icon-diamond-filled.svg

Paraphrase This Document

Need a fresh take? Get an instant paraphrase of this document with our AI Paraphraser
Document Page
PART B: Interpretation
(1) Based on the relevant hypothesis test, it is estimated that non-normality is prevalent for both
GD stock returns and Boeing stock returns.
For any stock, both the risk and return assume importance since these are essential
characteristics. With regards to the sample data, it is evident that GD stock tends to offer a
superior average monthly return in comparison to the Boeing stock and the same has been
achieved at a lower risk than Boeing. This is highlighted from the comparison of sample standard
deviation for the two stocks.
(2) The underlying distribution is student t for the relevant test statistics in case of null
hypothesis. The GD stock mean return tends to be different from the stated value of 2.8%.
(3) Based on the hypothesis test in relation to the risk associated with the two stock returns, it is
apparent that there is significant difference with regards to the two stocks. The sample data for
the two stocks clearly reflect that GD stock returns would have lower risk amongst the two
stocks.
(4) The returns of the given two stocks do not show any statistically significant difference. The
superior stock is GD which has been selected owing to the lower population risk associated as
against Boeing stock returns which have a comparatively higher risk. The returns do not matter
since no significant difference occurs between the two stocks.
(5) (b) Beta for the preferable stock (GD) is 0.652. The implication is that a unit percentage
change in the independent variable (market excess return) would produce a change of 0.652% in
the dependent variable (GD stock excess return) with the movements being in the same direction.
(c) The independent variable (market excess return) is only capable to explain 23.57% of the
changes observed in the dependent variable (GD stock excess return) and hence the CAPM
model does not represent a good fit.
(d) The beta of GD stock can be estimated with 95% chance to lie within the defined interval i.e.
(0.344,0.961).
7
Document Page
(6) The hypothesis test suggests that the preferable stock (GD) can be taken as a neutral stock
since the available evidence does warrant rejection of the hypothesis that stock cannot have a
beta of 1.
(7) In order to check the normality for the error terms or residuals, the Jarque Berra test has been
conducted based on which it has been concluded that it would be incorrect to assume that the
distribution of residuals is normal and hence the assumption of the CAPM model is not satisfied.
8
chevron_up_icon
1 out of 9
circle_padding
hide_on_mobile
zoom_out_icon
[object Object]