Business Statistics Analysis: Assignment for Semester 2 Students

Verified

Added on  2022/08/27

|16
|1442
|31
Homework Assignment
AI Summary
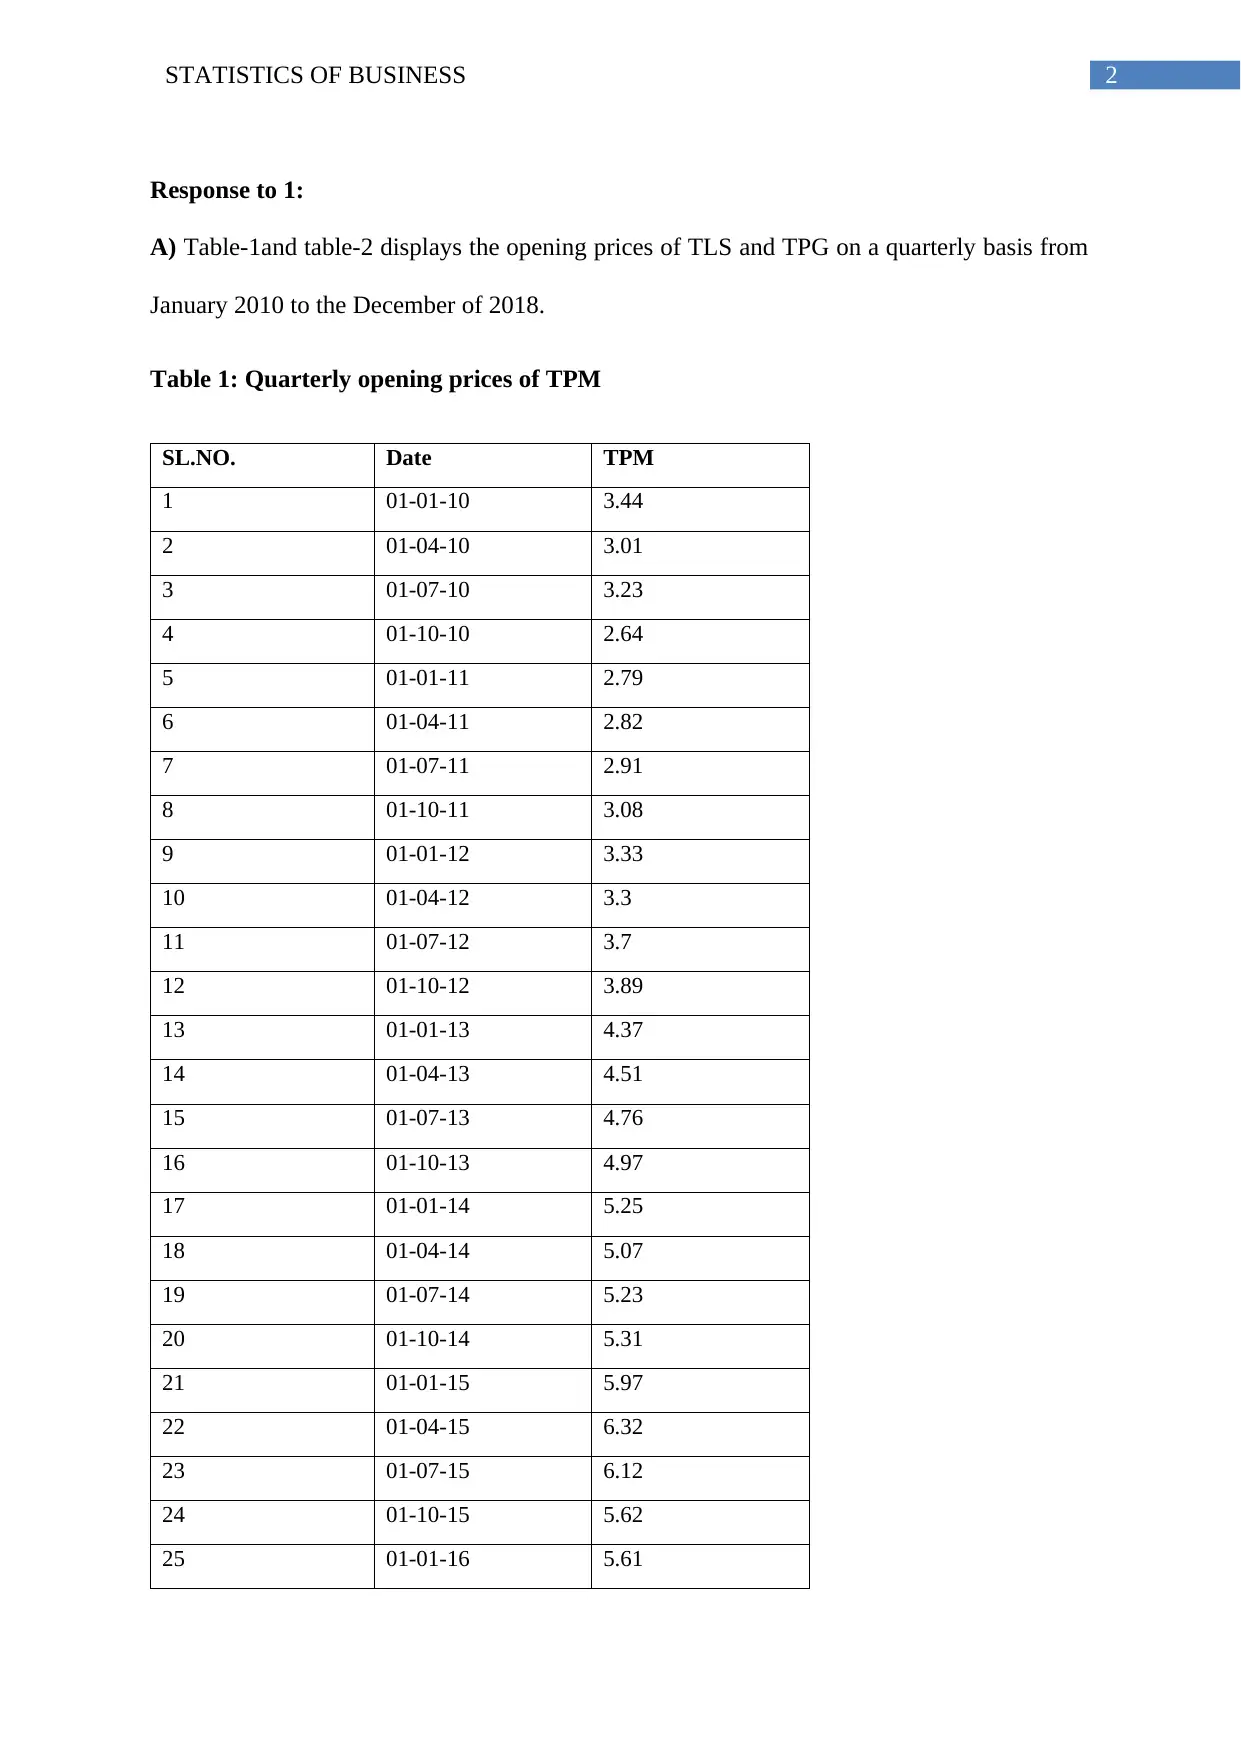
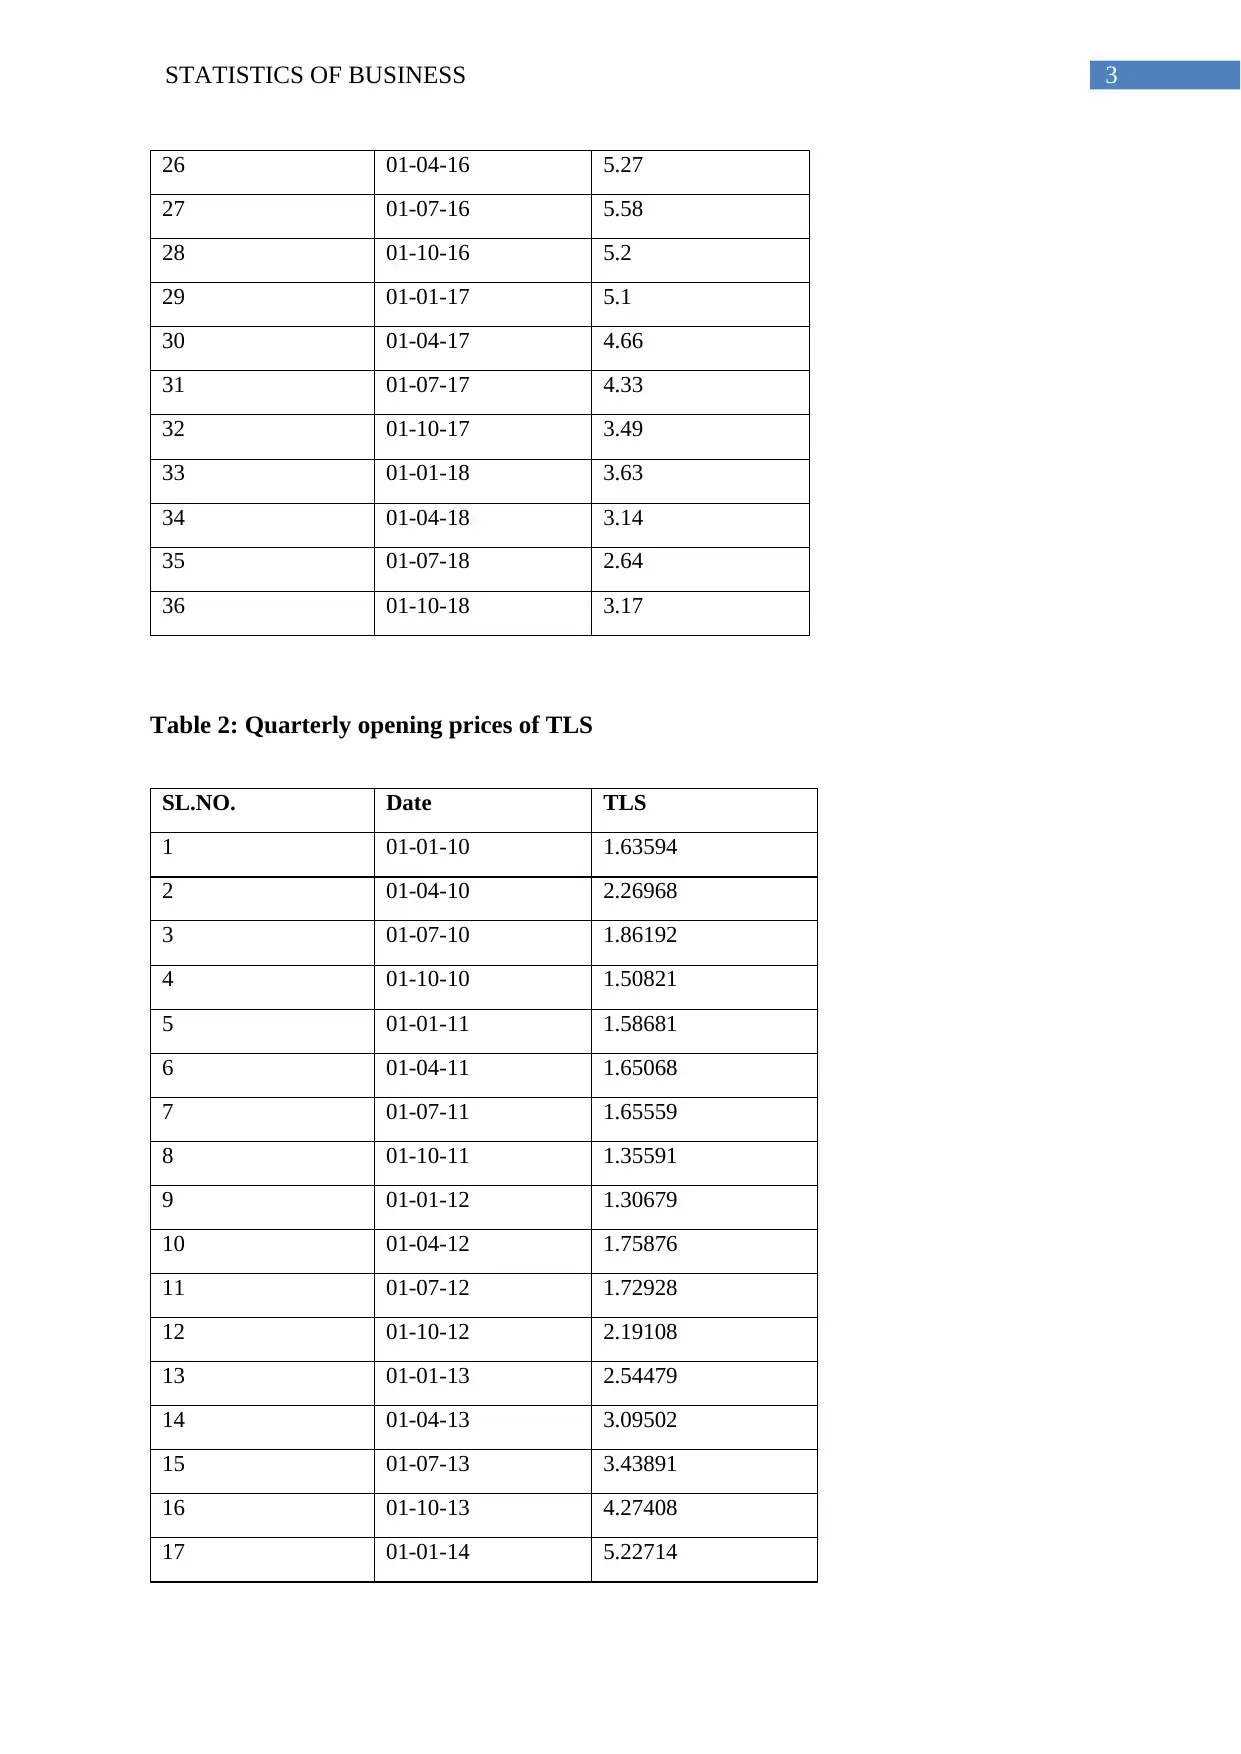
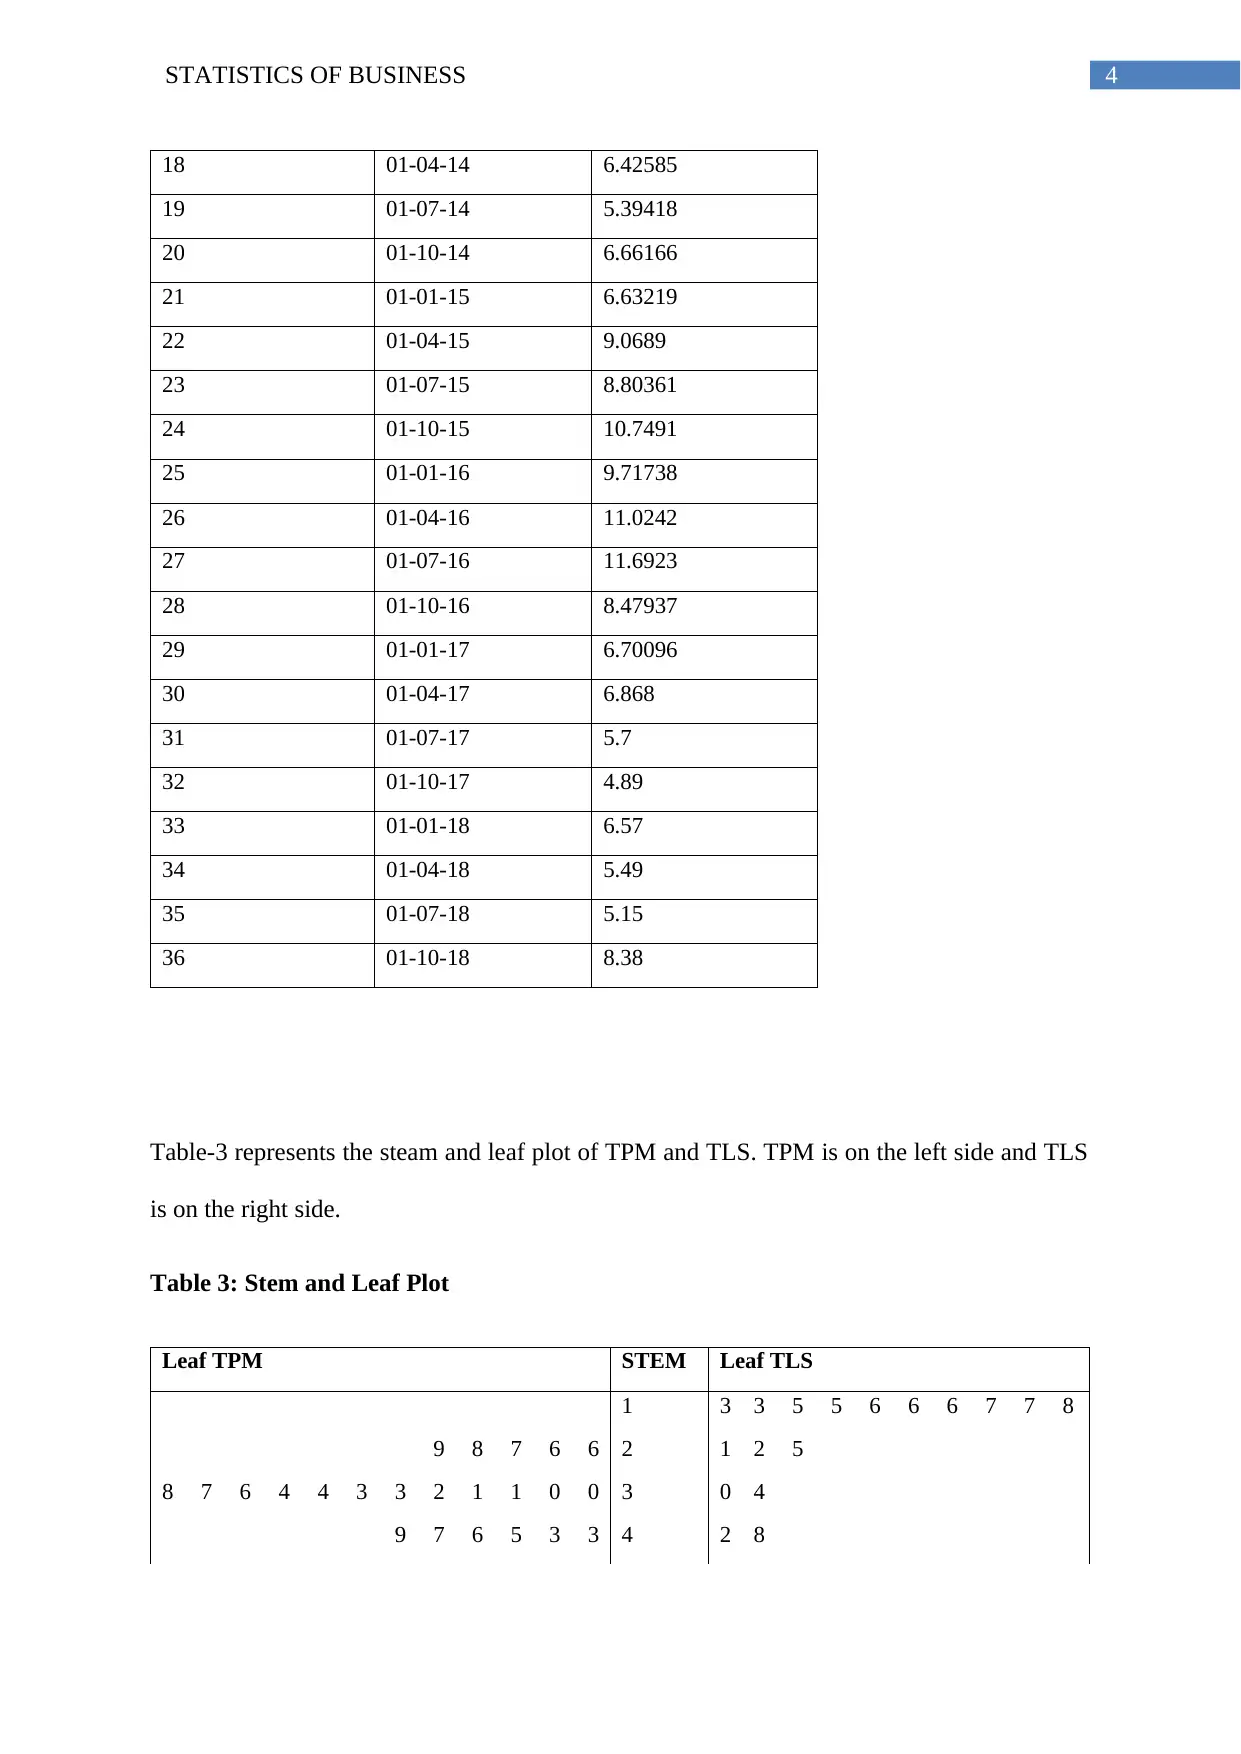
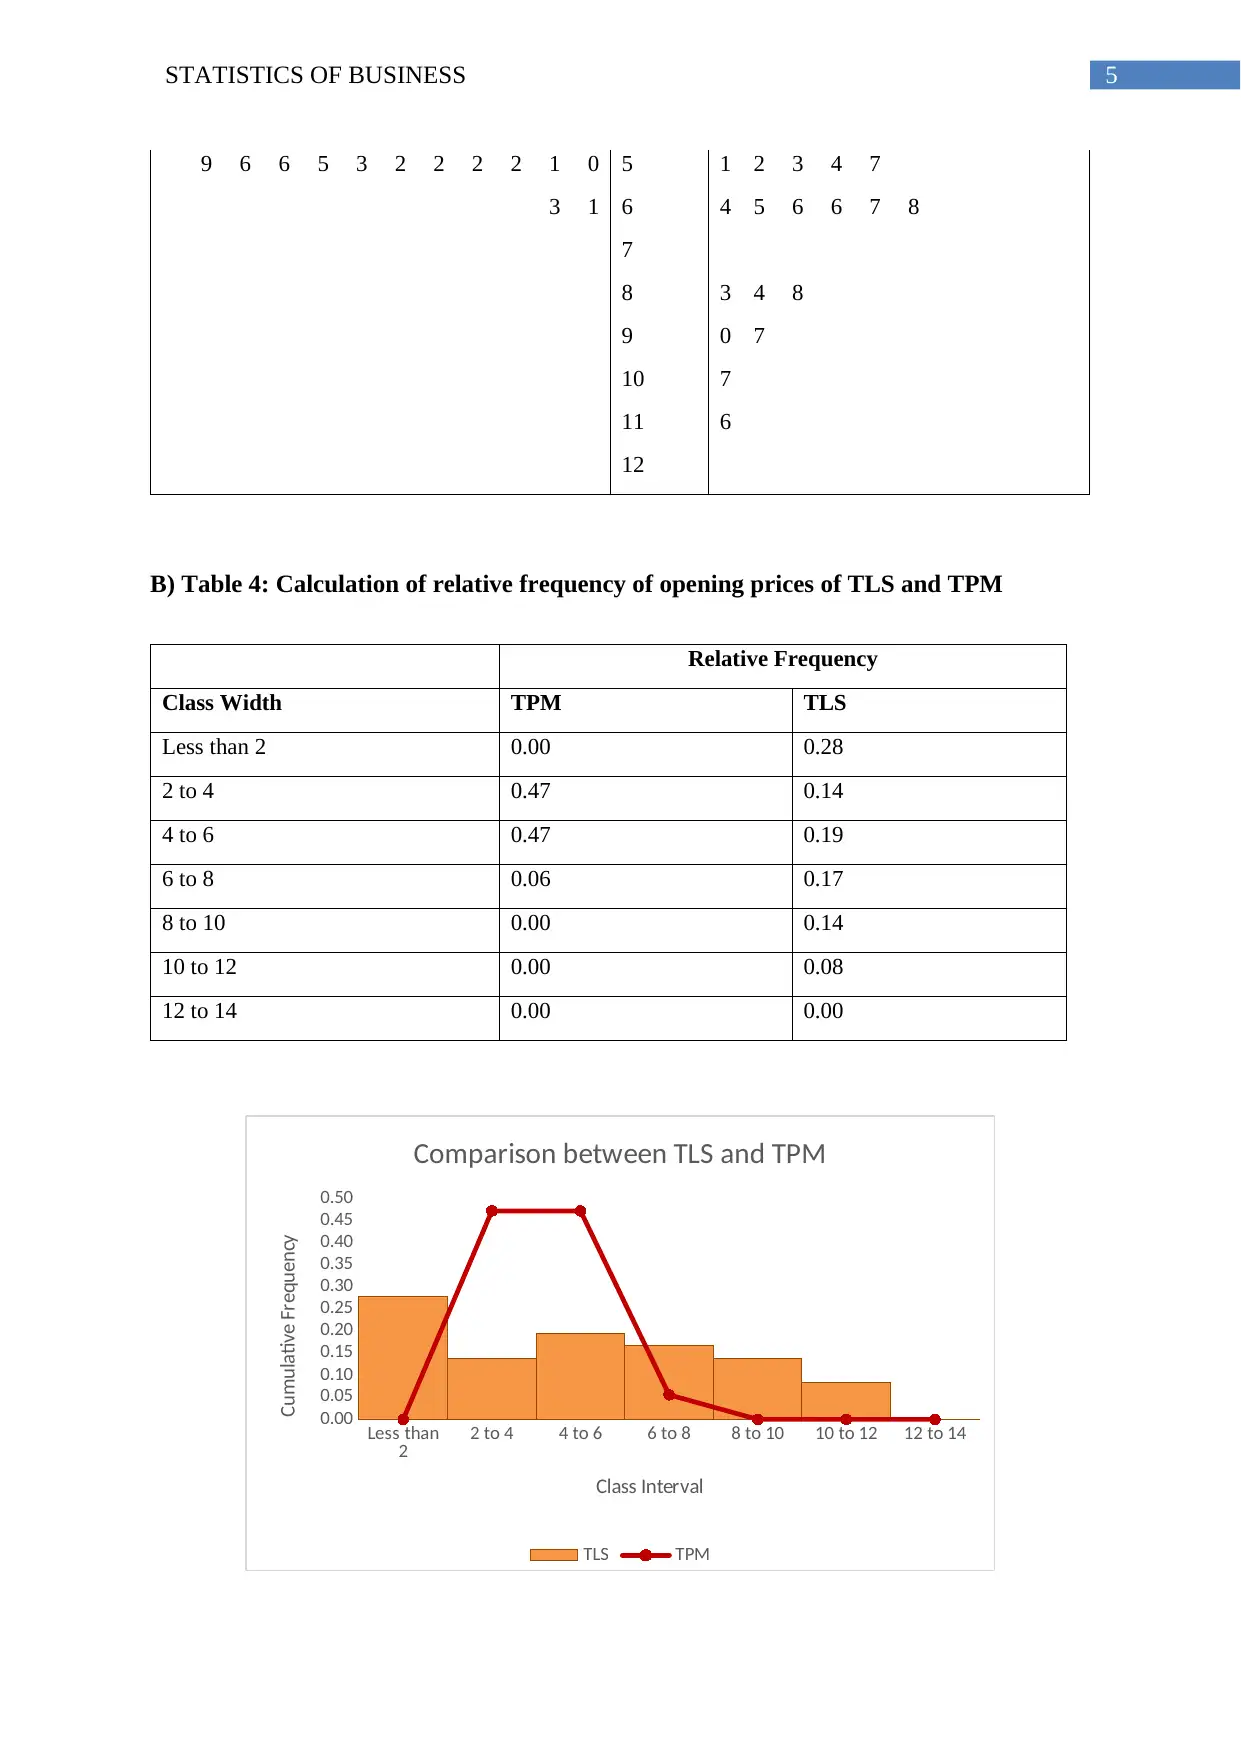
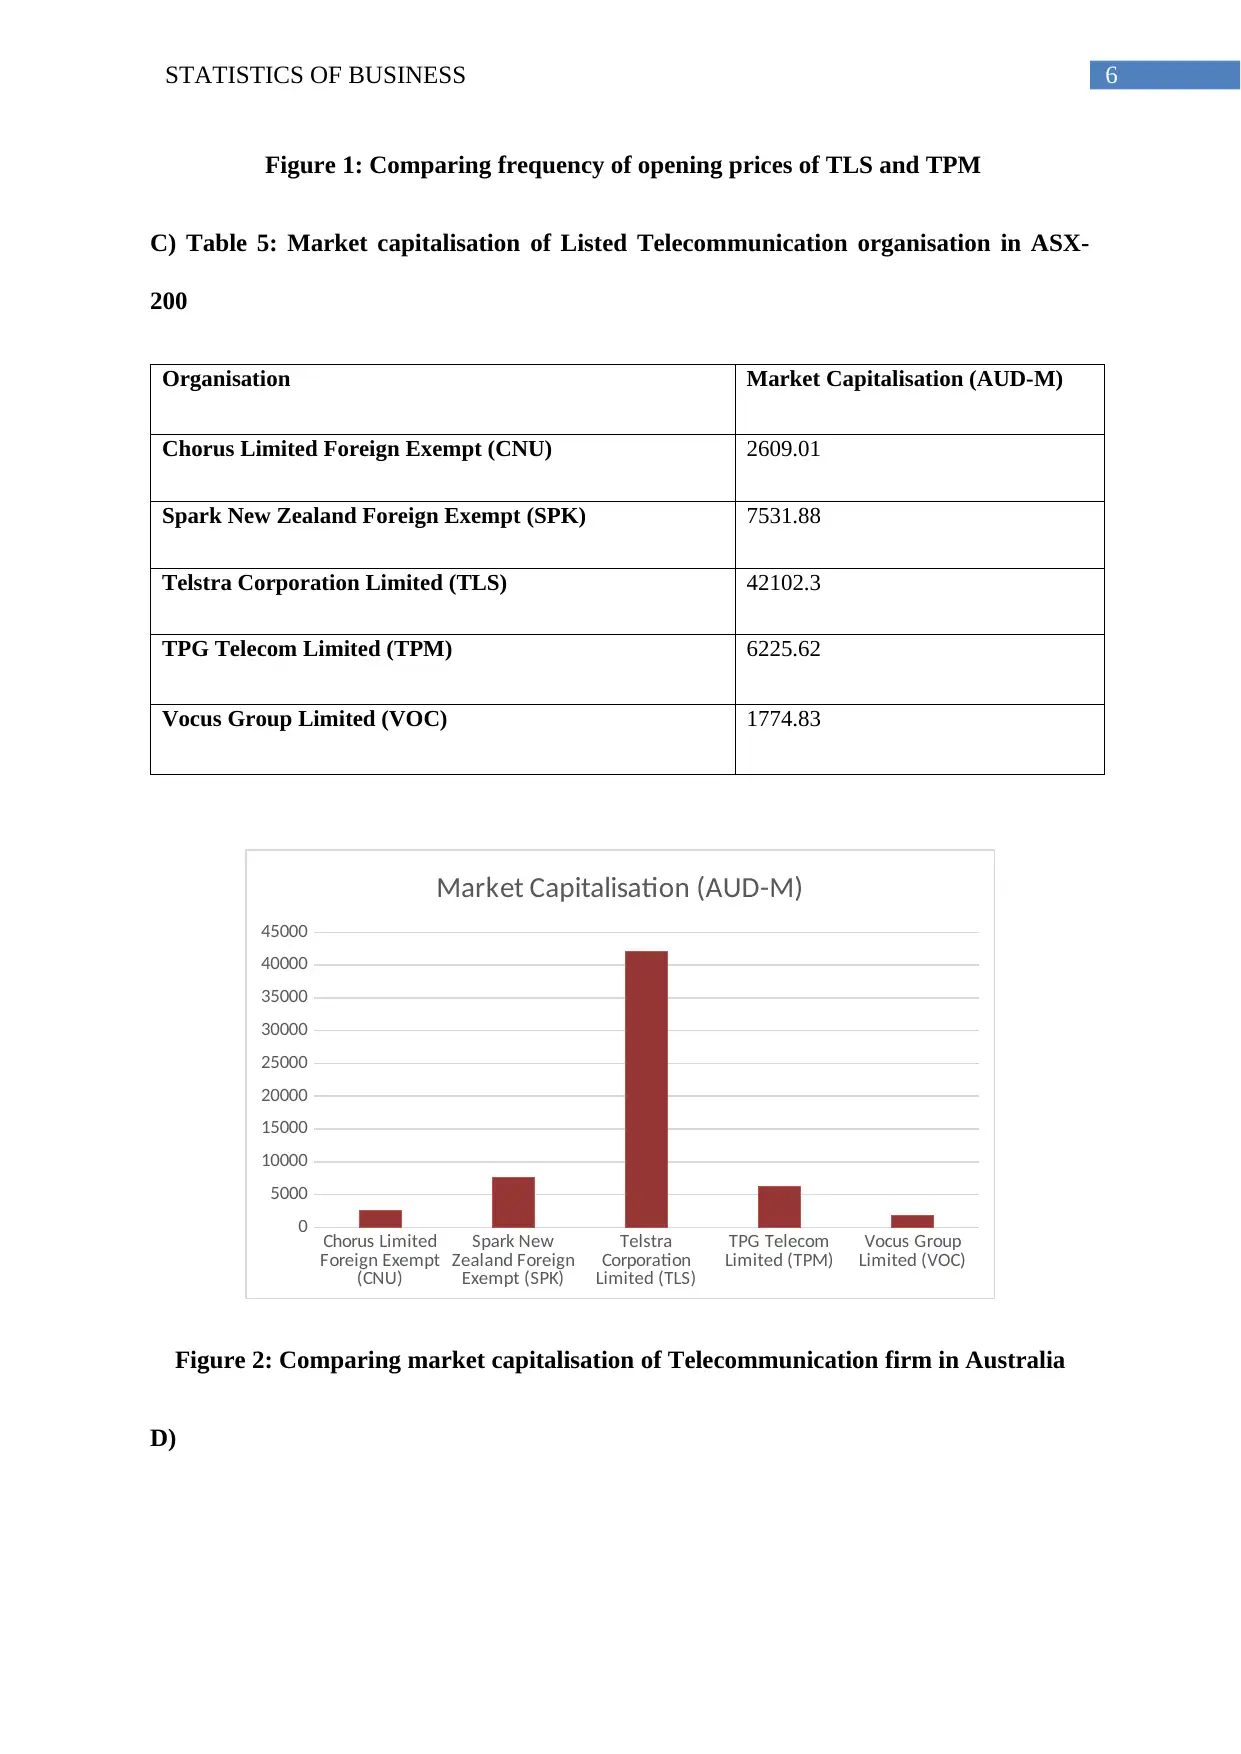
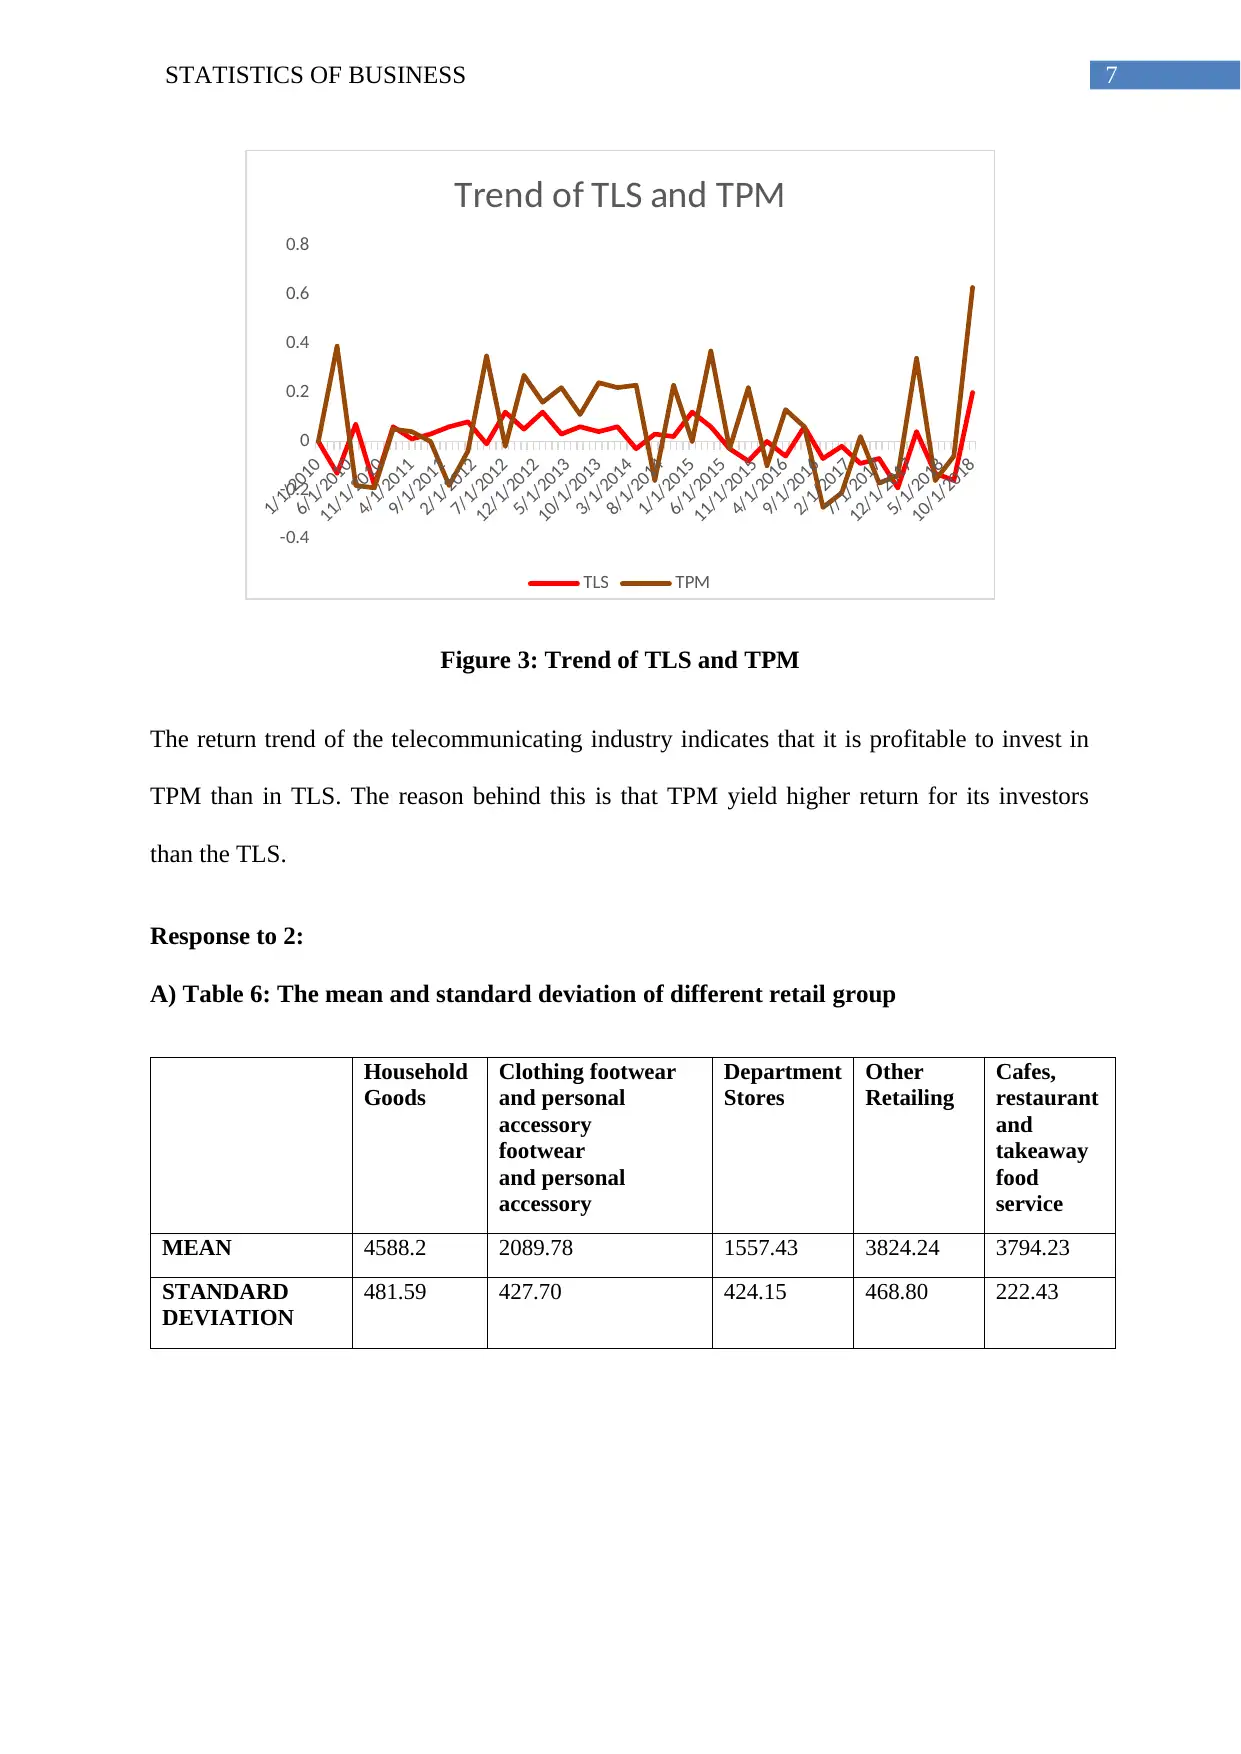
This document presents a comprehensive solution to a business statistics assignment, covering various statistical concepts and their applications. The assignment includes analysis of quarterly opening prices of telecommunication companies (TPM and TLS) using stem and leaf plots and relative frequency calculations. It delves into retail industry data, calculating mean, standard deviation, median, quartiles, and turnover trends for different retail groups. Probability calculations are performed based on given scenarios, including household characteristics and internet access. The assignment also addresses normal distribution problems, including z-score calculations. Furthermore, it explores hypothesis testing, analyzing enrolment percentages, and comparing proportions of travelers. The document provides detailed calculations, graphical representations, and interpretations of the results, demonstrating a strong understanding of statistical methods and their practical application in business contexts.
Document Page
Running head: STATISTICS OF BUSINESS
STATISTICS OF BUSINESS
Name of the Student
Name of the University
Author Note
Course ID:
tabler-icon-diamond-filled.svg

Paraphrase This Document

Need a fresh take? Get an instant paraphrase of this document with our AI Paraphraser
Document Page
1STATISTICS OF BUSINESS
Table of Contents
Response to 1:............................................................................................................................2
Response to 2:............................................................................................................................7
Response to 3:............................................................................................................................9
Response to 4:..........................................................................................................................10
Response to 5:..........................................................................................................................12
References................................................................................................................................15
Document Page
2STATISTICS OF BUSINESS
Response to 1:
A) Table-1and table-2 displays the opening prices of TLS and TPG on a quarterly basis from
January 2010 to the December of 2018.
Table 1: Quarterly opening prices of TPM
SL.NO. Date TPM
1 01-01-10 3.44
2 01-04-10 3.01
3 01-07-10 3.23
4 01-10-10 2.64
5 01-01-11 2.79
6 01-04-11 2.82
7 01-07-11 2.91
8 01-10-11 3.08
9 01-01-12 3.33
10 01-04-12 3.3
11 01-07-12 3.7
12 01-10-12 3.89
13 01-01-13 4.37
14 01-04-13 4.51
15 01-07-13 4.76
16 01-10-13 4.97
17 01-01-14 5.25
18 01-04-14 5.07
19 01-07-14 5.23
20 01-10-14 5.31
21 01-01-15 5.97
22 01-04-15 6.32
23 01-07-15 6.12
24 01-10-15 5.62
25 01-01-16 5.61
Document Page
3STATISTICS OF BUSINESS
26 01-04-16 5.27
27 01-07-16 5.58
28 01-10-16 5.2
29 01-01-17 5.1
30 01-04-17 4.66
31 01-07-17 4.33
32 01-10-17 3.49
33 01-01-18 3.63
34 01-04-18 3.14
35 01-07-18 2.64
36 01-10-18 3.17
Table 2: Quarterly opening prices of TLS
SL.NO. Date TLS
1 01-01-10 1.63594
2 01-04-10 2.26968
3 01-07-10 1.86192
4 01-10-10 1.50821
5 01-01-11 1.58681
6 01-04-11 1.65068
7 01-07-11 1.65559
8 01-10-11 1.35591
9 01-01-12 1.30679
10 01-04-12 1.75876
11 01-07-12 1.72928
12 01-10-12 2.19108
13 01-01-13 2.54479
14 01-04-13 3.09502
15 01-07-13 3.43891
16 01-10-13 4.27408
17 01-01-14 5.22714
tabler-icon-diamond-filled.svg

Paraphrase This Document

Need a fresh take? Get an instant paraphrase of this document with our AI Paraphraser
Document Page
4STATISTICS OF BUSINESS
18 01-04-14 6.42585
19 01-07-14 5.39418
20 01-10-14 6.66166
21 01-01-15 6.63219
22 01-04-15 9.0689
23 01-07-15 8.80361
24 01-10-15 10.7491
25 01-01-16 9.71738
26 01-04-16 11.0242
27 01-07-16 11.6923
28 01-10-16 8.47937
29 01-01-17 6.70096
30 01-04-17 6.868
31 01-07-17 5.7
32 01-10-17 4.89
33 01-01-18 6.57
34 01-04-18 5.49
35 01-07-18 5.15
36 01-10-18 8.38
Table-3 represents the steam and leaf plot of TPM and TLS. TPM is on the left side and TLS
is on the right side.
Table 3: Stem and Leaf Plot
Leaf TPM STEM Leaf TLS
1 3 3 5 5 6 6 6 7 7 8
9 8 7 6 6 2 1 2 5
8 7 6 4 4 3 3 2 1 1 0 0 3 0 4
9 7 6 5 3 3 4 2 8
Document Page
5STATISTICS OF BUSINESS
9 6 6 5 3 2 2 2 2 1 0 5 1 2 3 4 7
3 1 6 4 5 6 6 7 8
7
8 3 4 8
9 0 7
10 7
11 6
12
B) Table 4: Calculation of relative frequency of opening prices of TLS and TPM
Relative Frequency
Class Width TPM TLS
Less than 2 0.00 0.28
2 to 4 0.47 0.14
4 to 6 0.47 0.19
6 to 8 0.06 0.17
8 to 10 0.00 0.14
10 to 12 0.00 0.08
12 to 14 0.00 0.00
Less than
2 2 to 4 4 to 6 6 to 8 8 to 10 10 to 12 12 to 14
0.00
0.05
0.10
0.15
0.20
0.25
0.30
0.35
0.40
0.45
0.50
Comparison between TLS and TPM
TLS TPM
Class Interval
Cumulative Frequency
Document Page
6STATISTICS OF BUSINESS
Figure 1: Comparing frequency of opening prices of TLS and TPM
C) Table 5: Market capitalisation of Listed Telecommunication organisation in ASX-
200
Organisation Market Capitalisation (AUD-M)
Chorus Limited Foreign Exempt (CNU) 2609.01
Spark New Zealand Foreign Exempt (SPK) 7531.88
Telstra Corporation Limited (TLS) 42102.3
TPG Telecom Limited (TPM) 6225.62
Vocus Group Limited (VOC) 1774.83
Chorus Limited
Foreign Exempt
(CNU)
Spark New
Zealand Foreign
Exempt (SPK)
Telstra
Corporation
Limited (TLS)
TPG Telecom
Limited (TPM) Vocus Group
Limited (VOC)
0
5000
10000
15000
20000
25000
30000
35000
40000
45000
Market Capitalisation (AUD-M)
Figure 2: Comparing market capitalisation of Telecommunication firm in Australia
D)
tabler-icon-diamond-filled.svg

Paraphrase This Document

Need a fresh take? Get an instant paraphrase of this document with our AI Paraphraser
Document Page
7STATISTICS OF BUSINESS
1/1/2010
6/1/2010
11/1/2010
4/1/2011
9/1/2011
2/1/2012
7/1/2012
12/1/2012
5/1/2013
10/1/2013
3/1/2014
8/1/2014
1/1/2015
6/1/2015
11/1/2015
4/1/2016
9/1/2016
2/1/2017
7/1/2017
12/1/2017
5/1/2018
10/1/2018
-0.4
-0.2
0
0.2
0.4
0.6
0.8
Trend of TLS and TPM
TLS TPM
Figure 3: Trend of TLS and TPM
The return trend of the telecommunicating industry indicates that it is profitable to invest in
TPM than in TLS. The reason behind this is that TPM yield higher return for its investors
than the TLS.
Response to 2:
A) Table 6: The mean and standard deviation of different retail group
Household
Goods
Clothing footwear
and personal
accessory
footwear
and personal
accessory
Department
Stores
Other
Retailing
Cafes,
restaurant
and
takeaway
food
service
MEAN 4588.2 2089.78 1557.43 3824.24 3794.23
STANDARD
DEVIATION
481.59 427.70 424.15 468.80 222.43
Document Page
8STATISTICS OF BUSINESS
B) Table 7: Median, third quartile, maximum, first quartile and minimum of the retail industry
Household
Goods
Clothing footwear
and personal
accessory
footwear
and personal
accessory
Department
Stores
Other
Retailing
Cafes,
restaurant and
takeaway food
service
Minimum 4023.6 1632.2 1099.4 3334.5 3377.8
First Quartile 4360 1914.85 1401.725 3605.6 3676.125
Median 4451.3 1943.45 1421.45 3678.3 3796.55
Third Quartile 4689.675 2105.45 1540.4 3902.975 3913.5
Maximum 5826.5 3351.8 2813.5 5053.1 4278.9
C)
Household Goods Clothing footwear
and personal
accessory
footwear
and personal
accessory
Department Stores Other Retailing Cafes, restaurant
and takeaway food
service
1000
1500
2000
2500
3000
3500
4000
4500
5000
Comparison of Retail Turover
Figure 4: Comparing the retail turnover of each retail group
D)
Document Page
9STATISTICS OF BUSINESS
Jan-18 Feb-18 Mar-18 Apr-18 May-18 Jun-18 Jul-18 Aug-18 Sep-18 Oct-18 Nov-18 Dec-18
1000
1500
2000
2500
3000
3500
4000
4500
5000
5500
6000
Trend of Different Industry Group
Household Goods Clothing footwear
and personal accessory
footwear
and personal accessory
Department Stores
Other Retailing Cafes, restaurant and takeaway food service
Figure 5: Trend of retail turnover each industry
The turnover of household goods and cafes are high compared to retail and clothing
industry. However, departmental stores has the lowest turnover.
Response to 3:
A) Probability of a randomly selected household living in Queensland is P (Queensland) =
0.28
B) Probability of a randomly selected household who can live in Tasmania and will have
access to internet for social networking is P (Social networking/Tasmania) = 0.21
C) Probability of a randomly selected household living in Victoria can have access to internet
for formal educational purpose is P (Formal education activities/Victoria) = 0.08
D) Probability of a randomly selected household can have access to internet for either
banking or entertainment is P (Banking) + P (Entertainment) = 0.41
tabler-icon-diamond-filled.svg

Paraphrase This Document

Need a fresh take? Get an instant paraphrase of this document with our AI Paraphraser
Document Page
10STATISTICS OF BUSINESS
Response to 4:
A) Given that, mean (x) = 51 minutes
Standard Deviation (SD) = 4 minutes.
The distribution is normal and the value of upper 5% has a z value = -1.96.
Therefore,
Z= x μ
σ
1.96=51μ
4
1.964=51μ
μ=58.84
Therefore, the mean is 58.84 minutes
B) The height third year students varies uniformly from 110 to 135 cm. Thus, P (Height of 3-
year < 121) is
P= ( 121110 )
( 135110 )
P= 11
25
P=0.44
C) As the participants cannot distinguish among brands that there is a chance that participants
select brands selected in equal way.
(i) Percentile of correct identification ( p0 ): 50% = 0.5
Document Page
11STATISTICS OF BUSINESS
Percentile of correct identification in the sample (p) = 65% =0.65
Z= pp 0
p 0(1 p 0)
n
Z= 0.650.5
0.5(10.5)
250
Z= 0.15
0.0316
Z = 4.75
P (p > 0.65)
= P (z > 4.75)
= 0.0001
(ii) Probability of the sample lying between 60% and 70% of the correct identification is
P (0.6 < p < 0.7)
= P (
p p 0
p 0(1 p 0)
n
< p <
p p 0
p 0(1 p 0)
n
)
P (
0.650.5
0.5(10.5)
250
< p <
0.70.5
0.5(10.5)
250
)
= P ( 0.60.5
0.0316 < p <0.70.5
0.0316 )
¿ P(3.16< z <6.33)
P (z<6.33) – P (z<3.16)
chevron_up_icon
1 out of 16
circle_padding
hide_on_mobile
zoom_out_icon
[object Object]