Business Statistics Assignment: Frequency, Percentiles, and Confidence
VerifiedAdded on 2020/02/24
|8
|867
|222
Homework Assignment
AI Summary
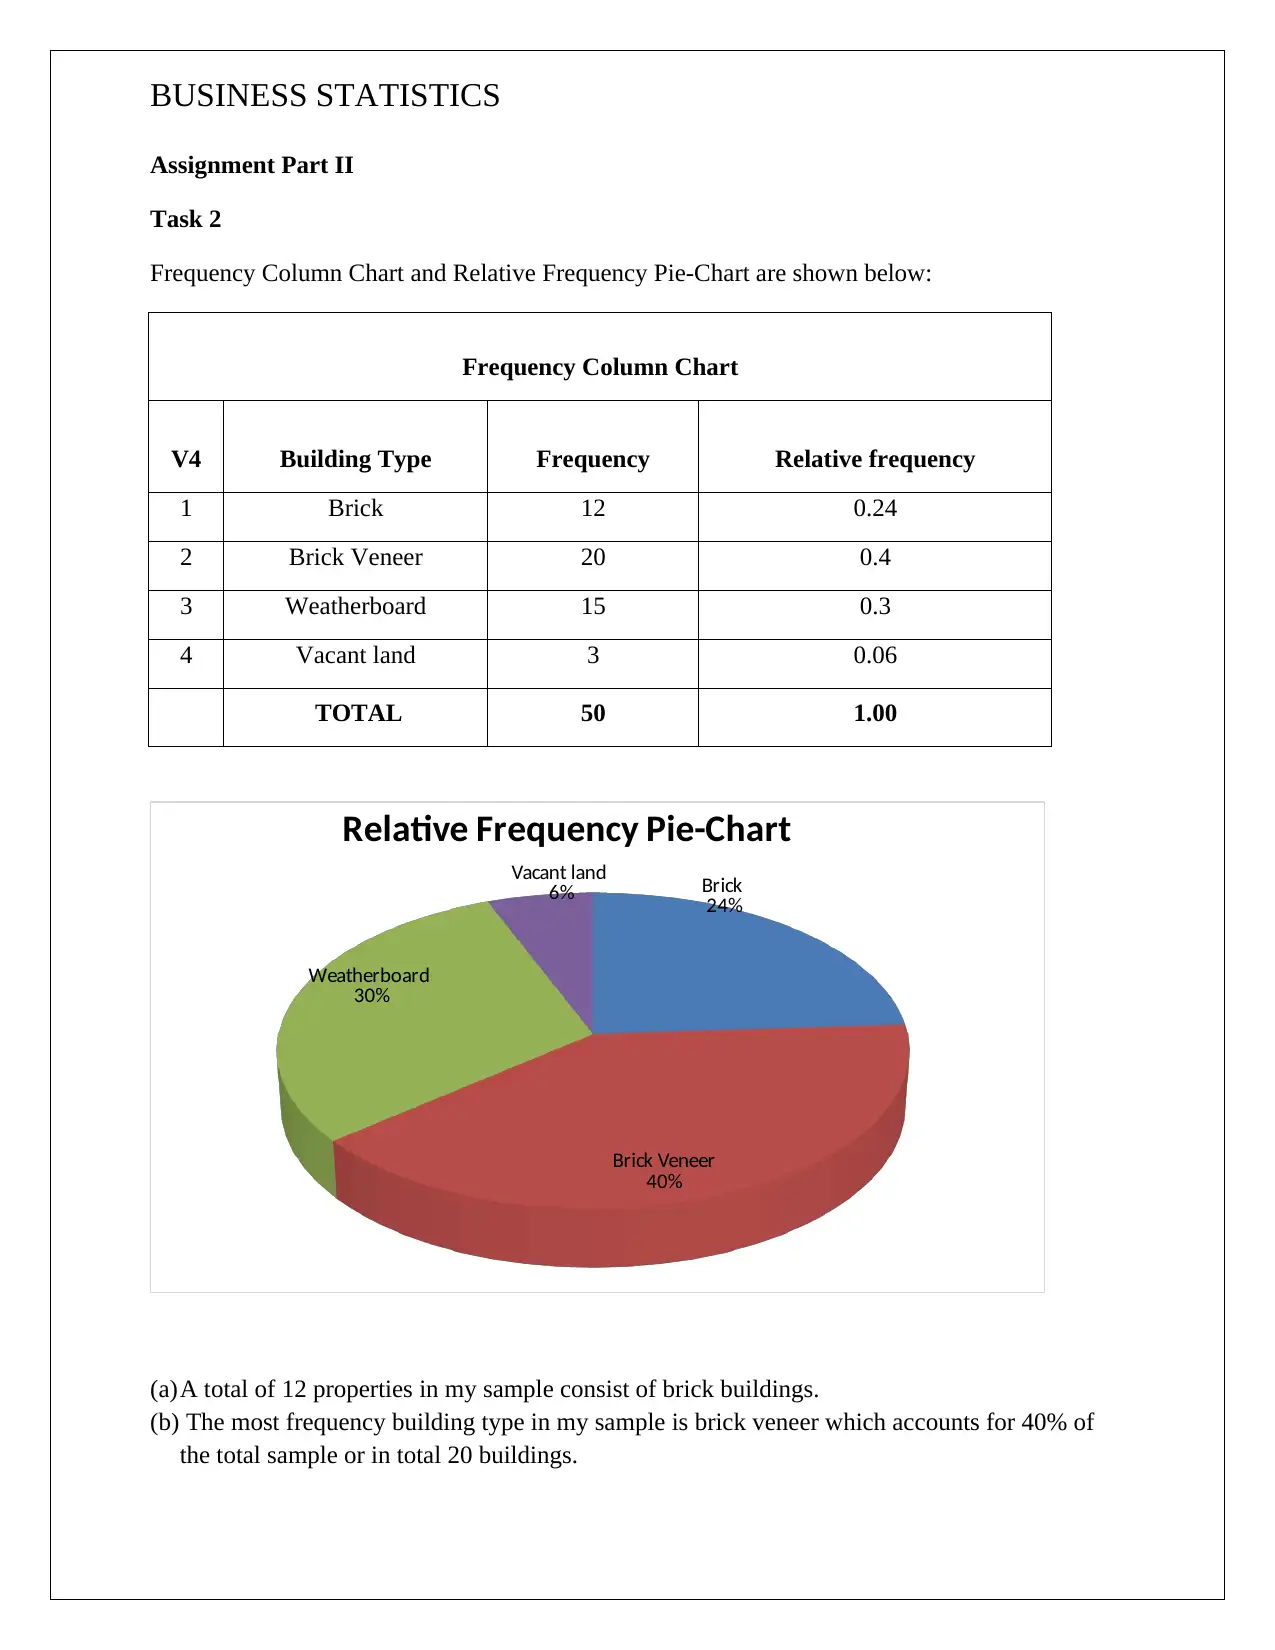
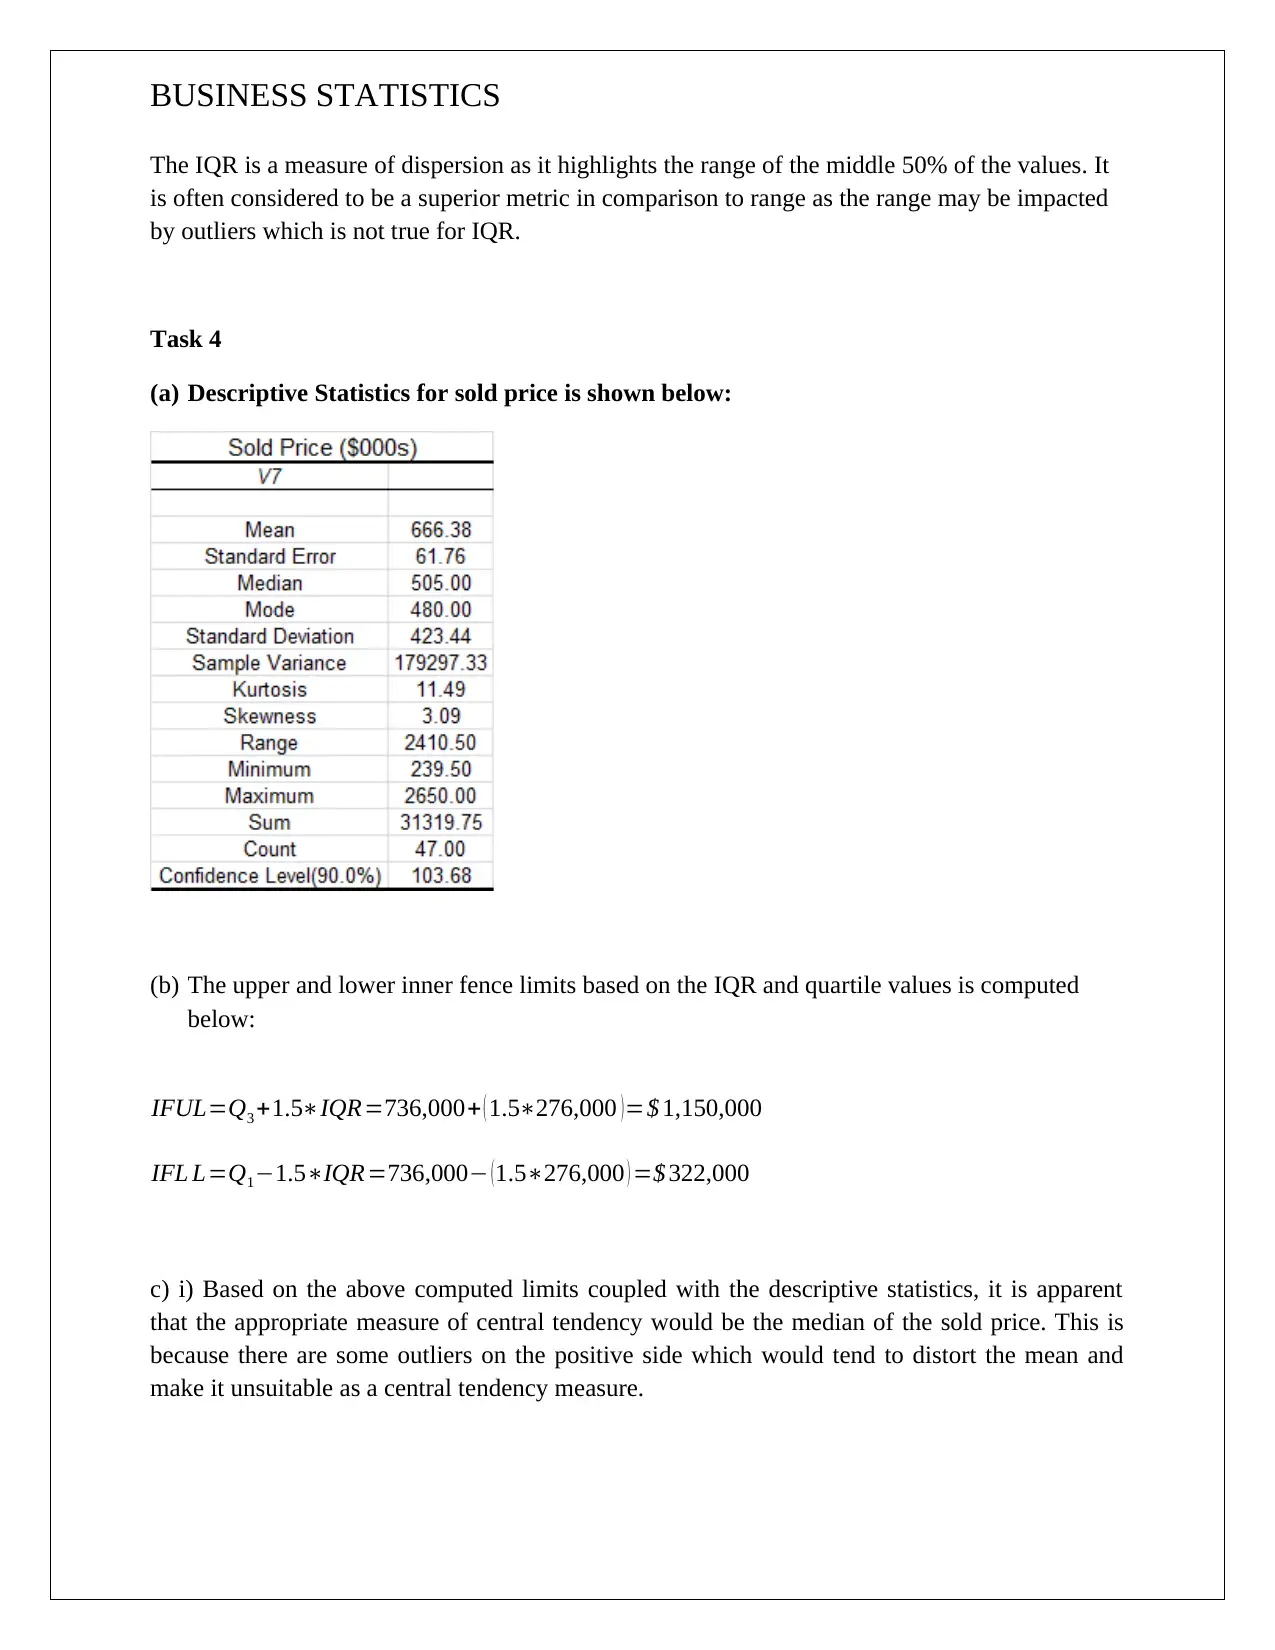
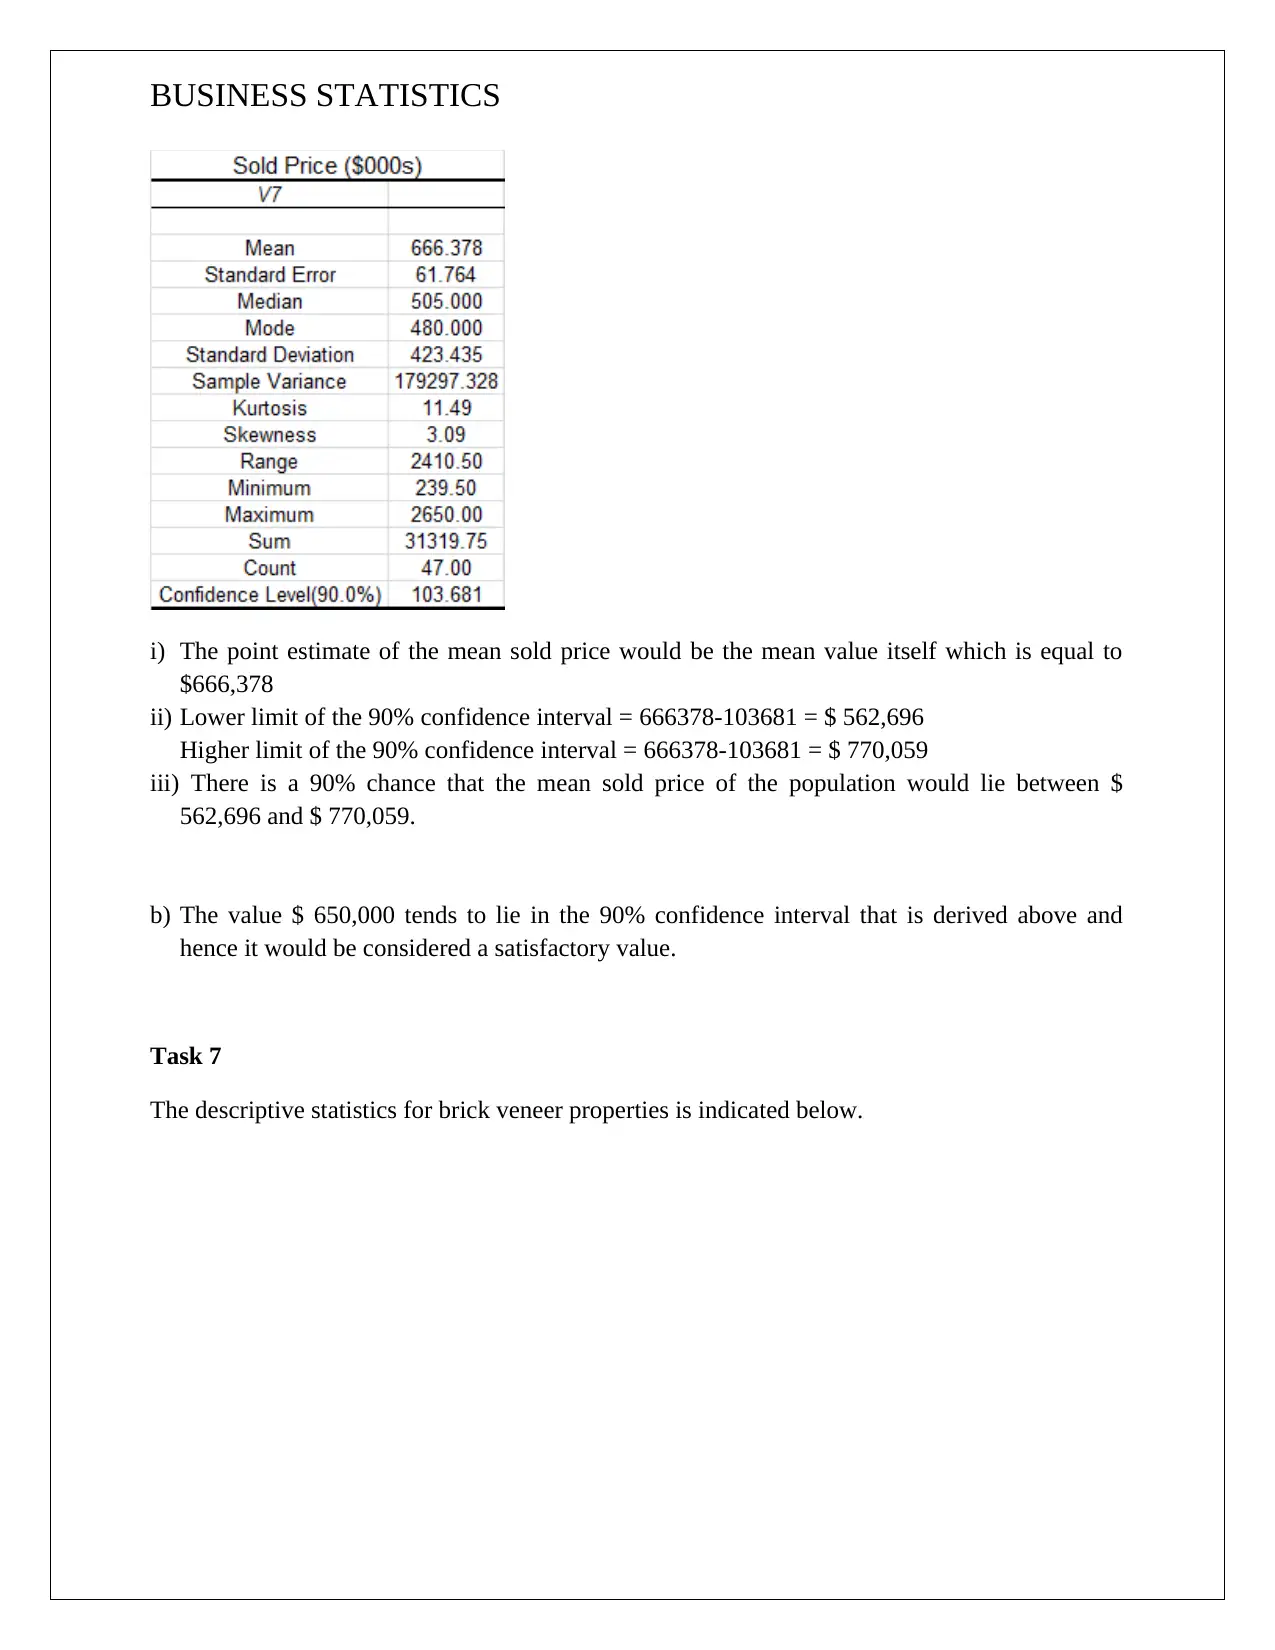
This business statistics assignment solution provides a comprehensive analysis of a dataset. It begins with frequency and relative frequency analysis, including the creation of a frequency column chart and a relative frequency pie chart. The solution then calculates percentiles, quartiles, and the interquartile range (IQR) for sold price data, interpreting their meaning and significance. Descriptive statistics are computed, and the appropriate measures of central tendency and variation are identified, along with an analysis of the data's distribution, including skewness and kurtosis. Further, the assignment includes calculations and interpretations of confidence intervals for the mean sold price and the proportion of brick veneer properties. The solution demonstrates the application of statistical concepts to real-world data and provides insightful interpretations of the results.


1 out of 8
Related Documents


Your All-in-One AI-Powered Toolkit for Academic Success.
+13062052269
info@desklib.com
Available 24*7 on WhatsApp / Email
![[object Object]](/_next/static/media/star-bottom.7253800d.svg)
Copyright © 2020–2026 A2Z Services. All Rights Reserved. Developed and managed by ZUCOL.