Business Statistics Assignment: Laptop Market Analysis and Insights

Verified

Added on  2023/03/17

|10
|1767
|91
Homework Assignment
AI Summary
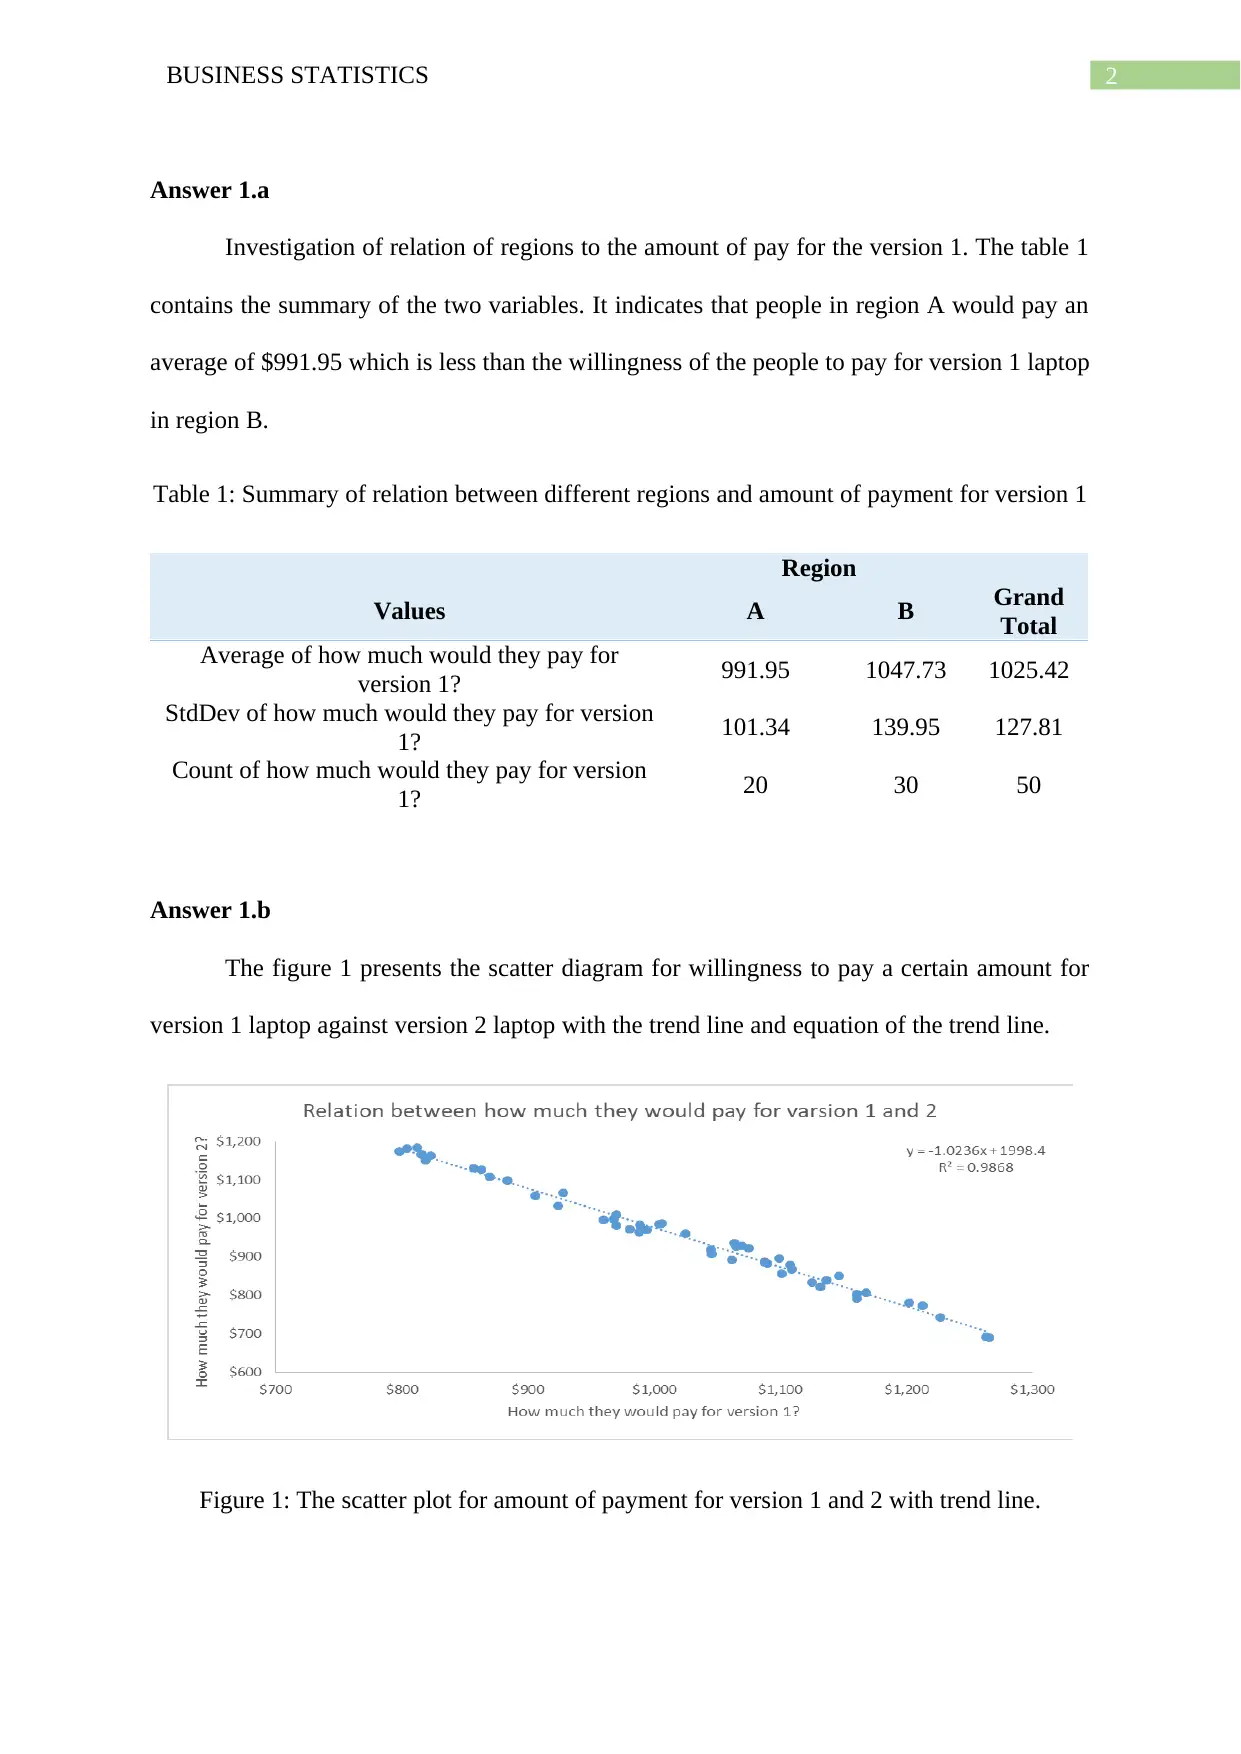
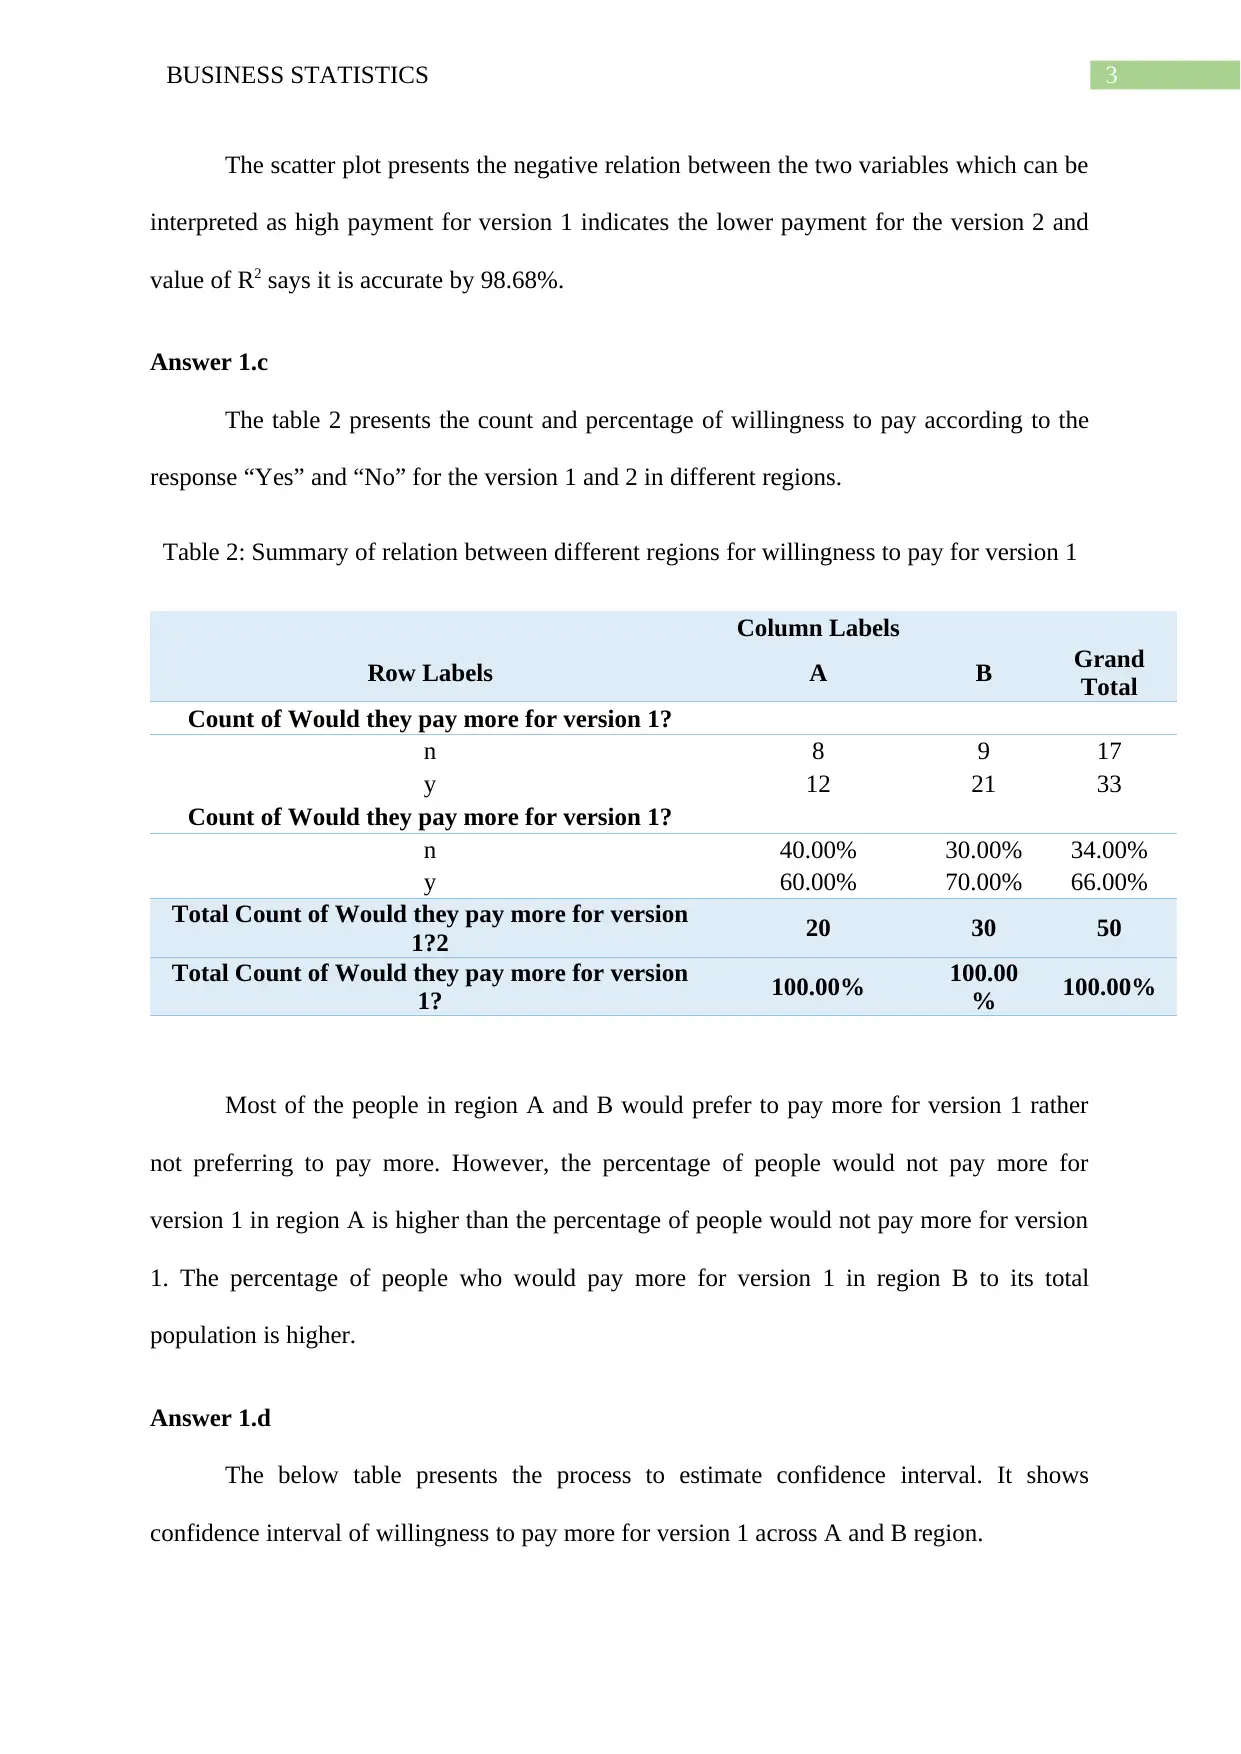
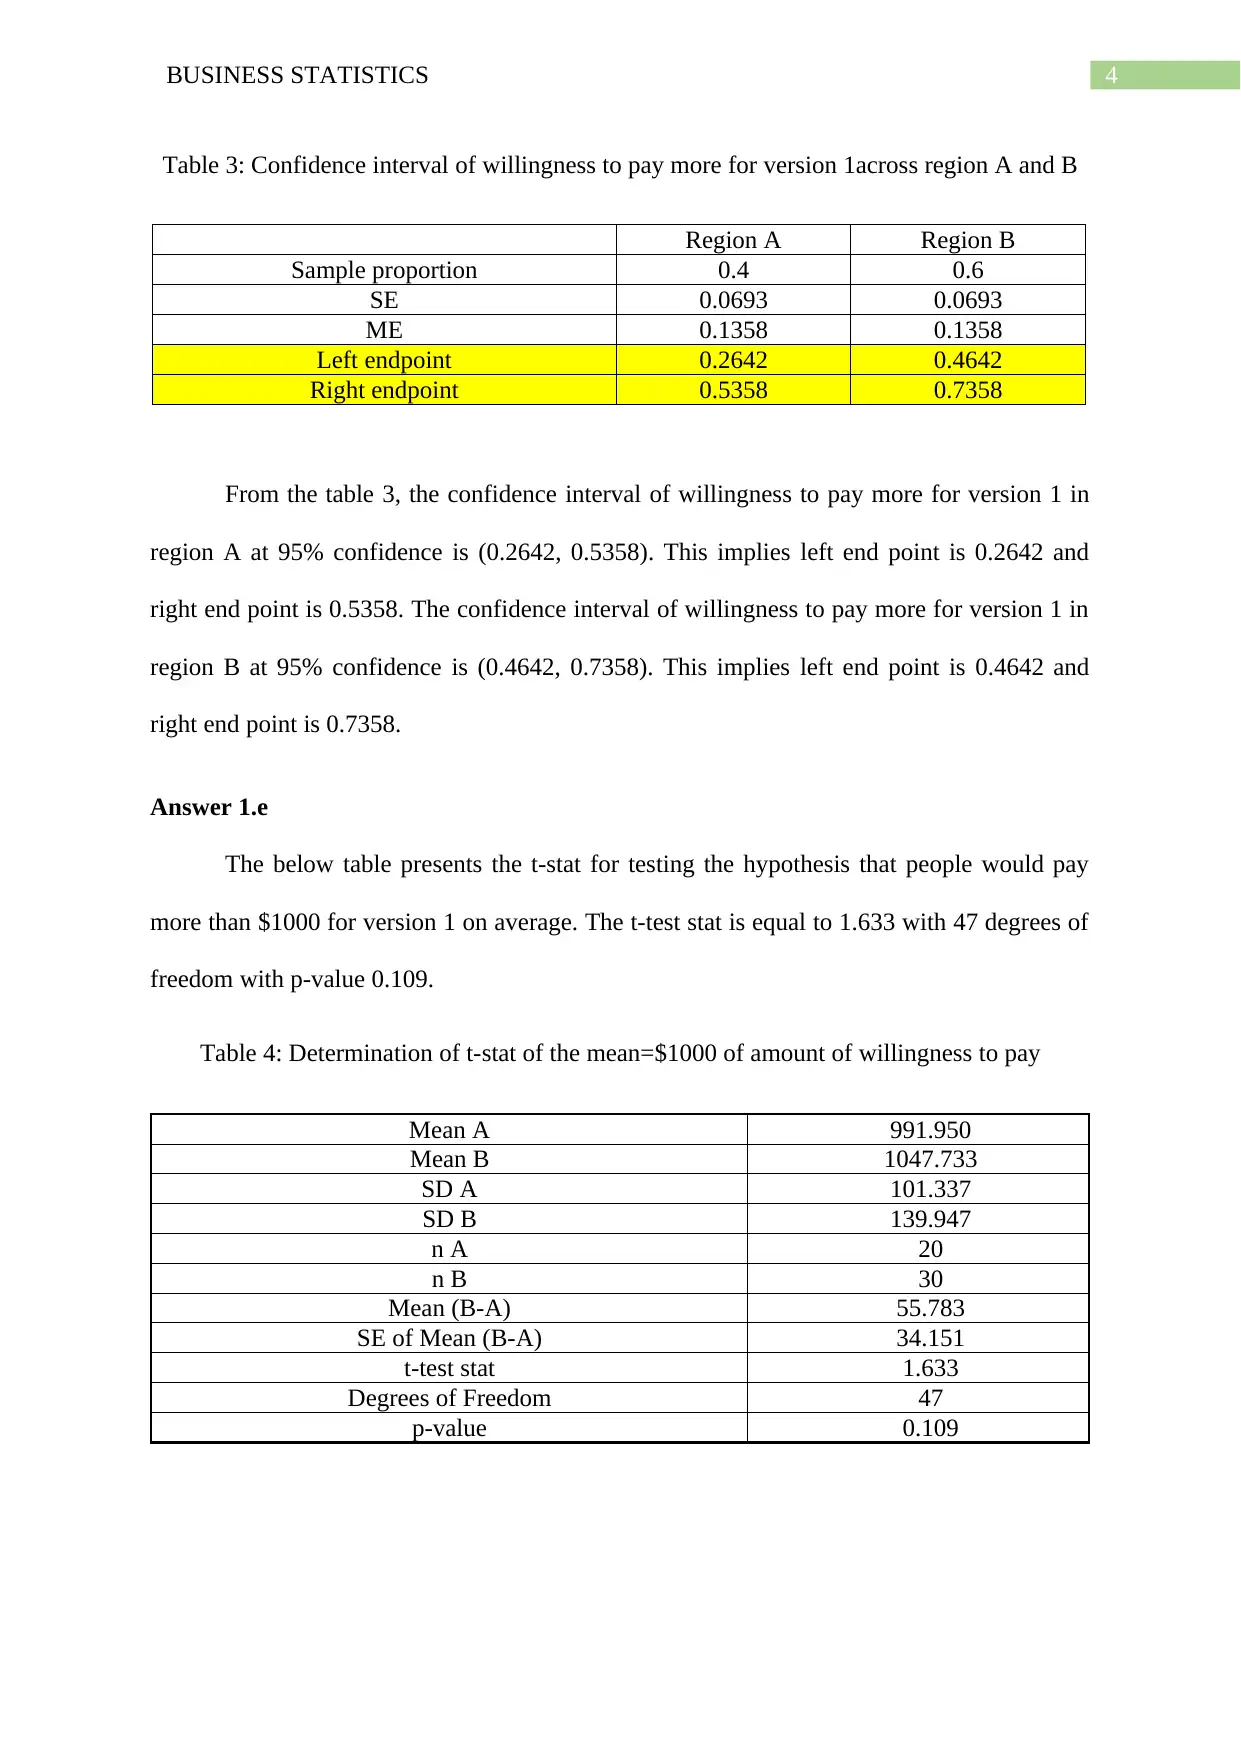
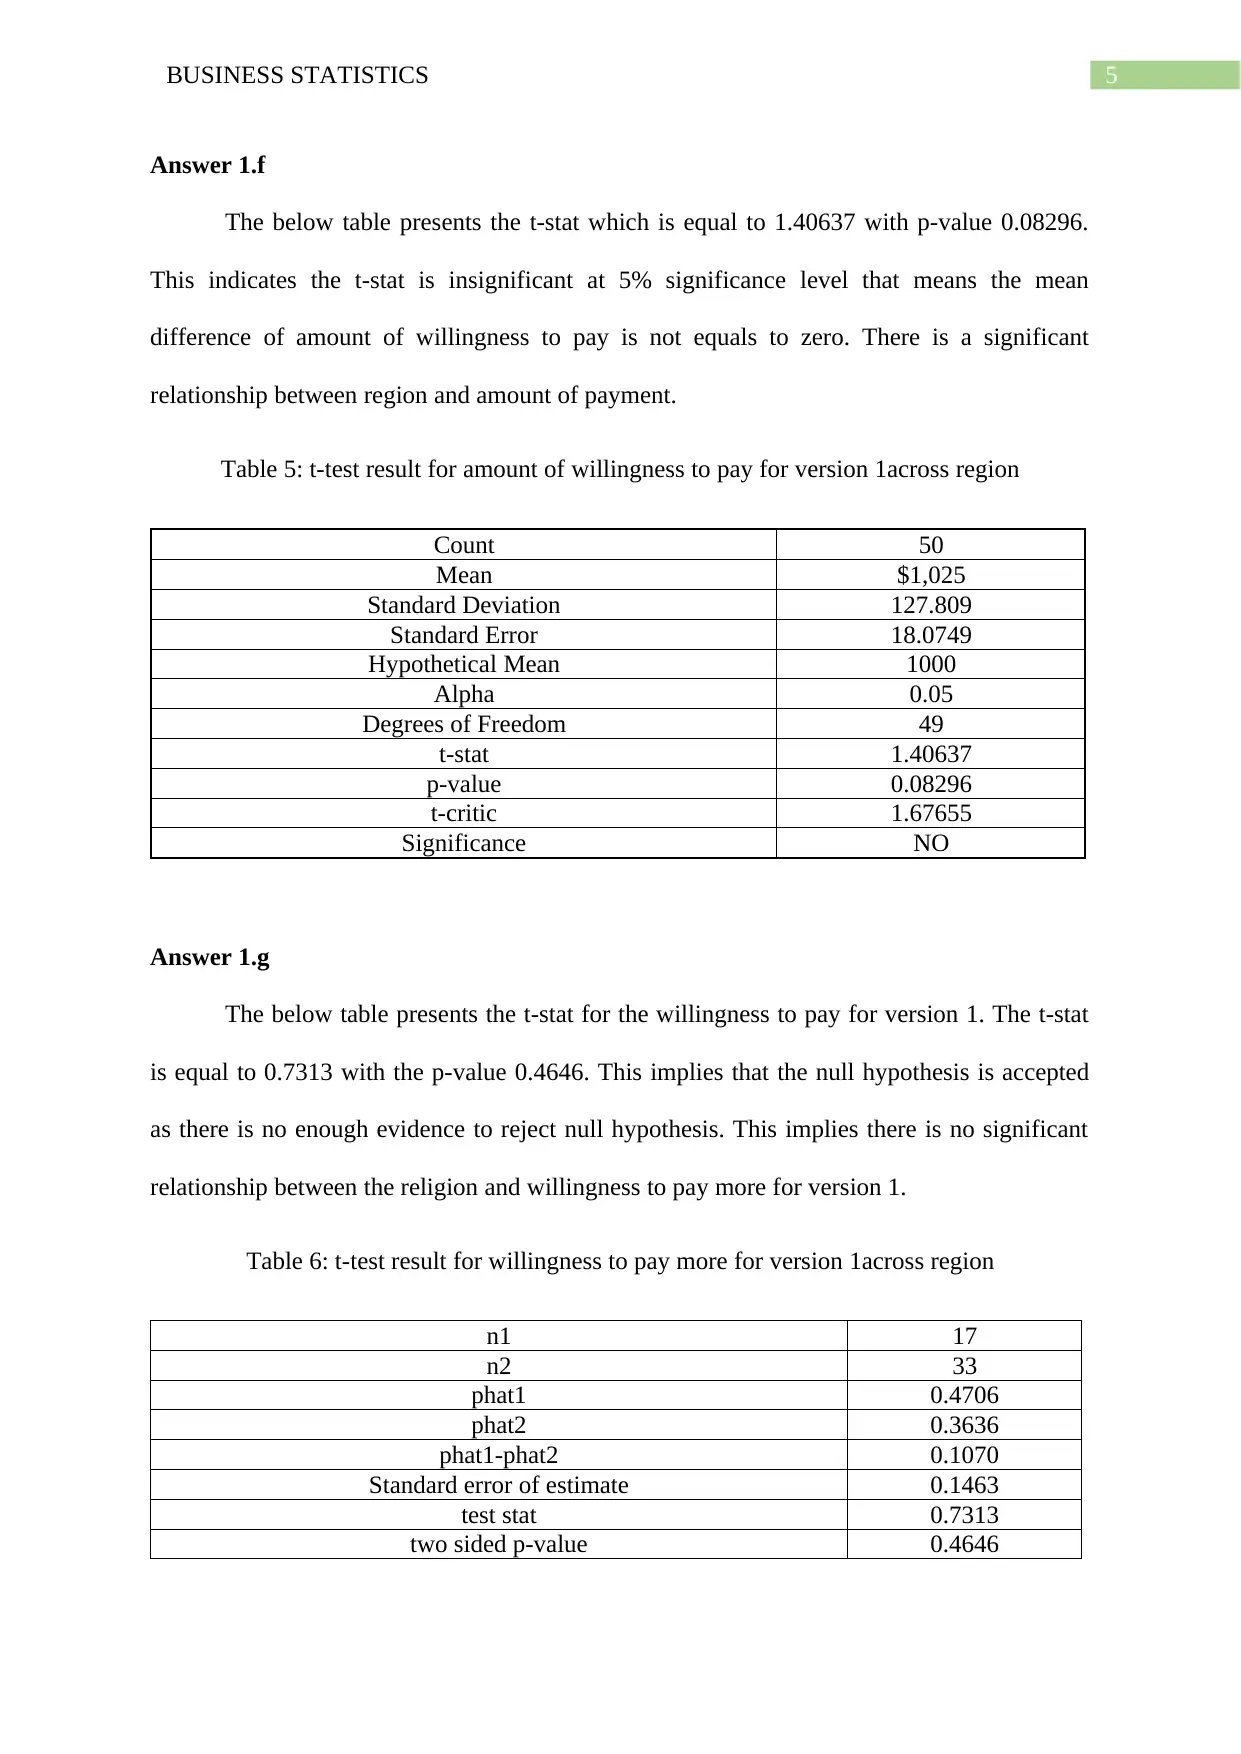
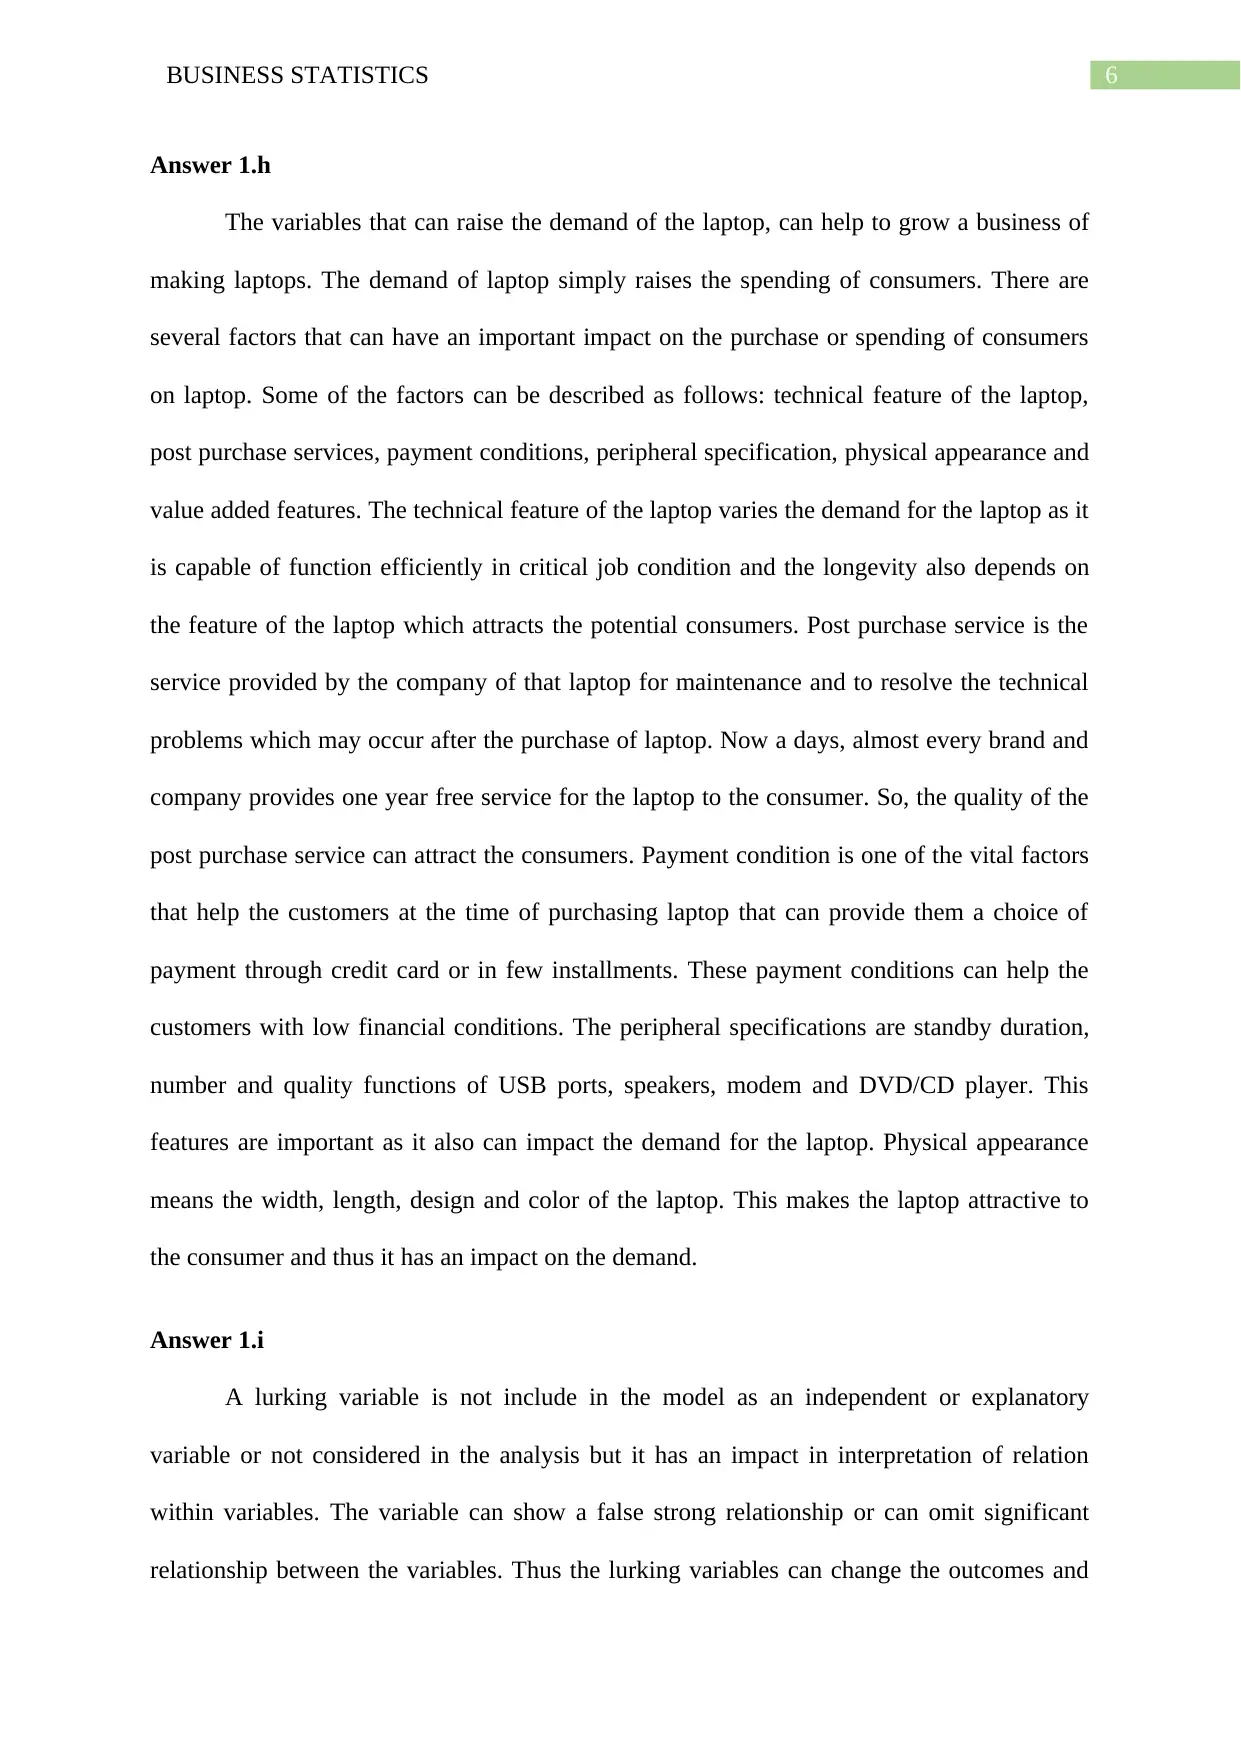
This business statistics assignment analyzes market research data on consumer preferences for two laptop versions across different regions (A and B). The analysis includes descriptive statistics, such as average willingness to pay, standard deviations, and counts. The assignment investigates the relationship between the regions and the amount consumers are willing to pay for each laptop version, using scatter plots and trend lines. It further explores consumer willingness to pay more for version 1, calculating confidence intervals and performing t-tests to determine the significance of mean differences. The analysis also examines factors influencing laptop demand, like technical specifications, post-purchase services, and payment options, and addresses lurking variables that could skew interpretations. Finally, it suggests additional variables for a more comprehensive market analysis, such as consumer demographics, and emphasizes the importance of defining variables accurately to avoid misinterpretations.
Document Page
Running head: BUSINESS STATISTICS
Business Statistics
Name of the Student:
Name of the University:
Author Note:
tabler-icon-diamond-filled.svg

Paraphrase This Document

Need a fresh take? Get an instant paraphrase of this document with our AI Paraphraser
Document Page
1BUSINESS STATISTICS
Table of Contents
Answer 1.a..................................................................................................................................2
Answer 1.b.................................................................................................................................2
Answer 1.c..................................................................................................................................3
Answer 1.d.................................................................................................................................3
Answer 1.e..................................................................................................................................4
Answer 1.f..................................................................................................................................5
Answer 1.g.................................................................................................................................5
Answer 1.h.................................................................................................................................6
Answer 1.i..................................................................................................................................6
Answer 1.j..................................................................................................................................7
Document Page
2BUSINESS STATISTICS
Answer 1.a
Investigation of relation of regions to the amount of pay for the version 1. The table 1
contains the summary of the two variables. It indicates that people in region A would pay an
average of $991.95 which is less than the willingness of the people to pay for version 1 laptop
in region B.
Table 1: Summary of relation between different regions and amount of payment for version 1
Region
Values A B Grand
Total
Average of how much would they pay for
version 1? 991.95 1047.73 1025.42
StdDev of how much would they pay for version
1? 101.34 139.95 127.81
Count of how much would they pay for version
1? 20 30 50
Answer 1.b
The figure 1 presents the scatter diagram for willingness to pay a certain amount for
version 1 laptop against version 2 laptop with the trend line and equation of the trend line.
Figure 1: The scatter plot for amount of payment for version 1 and 2 with trend line.
Document Page
3BUSINESS STATISTICS
The scatter plot presents the negative relation between the two variables which can be
interpreted as high payment for version 1 indicates the lower payment for the version 2 and
value of R2 says it is accurate by 98.68%.
Answer 1.c
The table 2 presents the count and percentage of willingness to pay according to the
response “Yes” and “No” for the version 1 and 2 in different regions.
Table 2: Summary of relation between different regions for willingness to pay for version 1
Column Labels
Row Labels A B Grand
Total
Count of Would they pay more for version 1?
n 8 9 17
y 12 21 33
Count of Would they pay more for version 1?
n 40.00% 30.00% 34.00%
y 60.00% 70.00% 66.00%
Total Count of Would they pay more for version
1?2 20 30 50
Total Count of Would they pay more for version
1? 100.00% 100.00
% 100.00%
Most of the people in region A and B would prefer to pay more for version 1 rather
not preferring to pay more. However, the percentage of people would not pay more for
version 1 in region A is higher than the percentage of people would not pay more for version
1. The percentage of people who would pay more for version 1 in region B to its total
population is higher.
Answer 1.d
The below table presents the process to estimate confidence interval. It shows
confidence interval of willingness to pay more for version 1 across A and B region.
tabler-icon-diamond-filled.svg

Paraphrase This Document

Need a fresh take? Get an instant paraphrase of this document with our AI Paraphraser
Document Page
4BUSINESS STATISTICS
Table 3: Confidence interval of willingness to pay more for version 1across region A and B
Region A Region B
Sample proportion 0.4 0.6
SE 0.0693 0.0693
ME 0.1358 0.1358
Left endpoint 0.2642 0.4642
Right endpoint 0.5358 0.7358
From the table 3, the confidence interval of willingness to pay more for version 1 in
region A at 95% confidence is (0.2642, 0.5358). This implies left end point is 0.2642 and
right end point is 0.5358. The confidence interval of willingness to pay more for version 1 in
region B at 95% confidence is (0.4642, 0.7358). This implies left end point is 0.4642 and
right end point is 0.7358.
Answer 1.e
The below table presents the t-stat for testing the hypothesis that people would pay
more than $1000 for version 1 on average. The t-test stat is equal to 1.633 with 47 degrees of
freedom with p-value 0.109.
Table 4: Determination of t-stat of the mean=$1000 of amount of willingness to pay
Mean A 991.950
Mean B 1047.733
SD A 101.337
SD B 139.947
n A 20
n B 30
Mean (B-A) 55.783
SE of Mean (B-A) 34.151
t-test stat 1.633
Degrees of Freedom 47
p-value 0.109
Document Page
5BUSINESS STATISTICS
Answer 1.f
The below table presents the t-stat which is equal to 1.40637 with p-value 0.08296.
This indicates the t-stat is insignificant at 5% significance level that means the mean
difference of amount of willingness to pay is not equals to zero. There is a significant
relationship between region and amount of payment.
Table 5: t-test result for amount of willingness to pay for version 1across region
Count 50
Mean $1,025
Standard Deviation 127.809
Standard Error 18.0749
Hypothetical Mean 1000
Alpha 0.05
Degrees of Freedom 49
t-stat 1.40637
p-value 0.08296
t-critic 1.67655
Significance NO
Answer 1.g
The below table presents the t-stat for the willingness to pay for version 1. The t-stat
is equal to 0.7313 with the p-value 0.4646. This implies that the null hypothesis is accepted
as there is no enough evidence to reject null hypothesis. This implies there is no significant
relationship between the religion and willingness to pay more for version 1.
Table 6: t-test result for willingness to pay more for version 1across region
n1 17
n2 33
phat1 0.4706
phat2 0.3636
phat1-phat2 0.1070
Standard error of estimate 0.1463
test stat 0.7313
two sided p-value 0.4646
Document Page
6BUSINESS STATISTICS
Answer 1.h
The variables that can raise the demand of the laptop, can help to grow a business of
making laptops. The demand of laptop simply raises the spending of consumers. There are
several factors that can have an important impact on the purchase or spending of consumers
on laptop. Some of the factors can be described as follows: technical feature of the laptop,
post purchase services, payment conditions, peripheral specification, physical appearance and
value added features. The technical feature of the laptop varies the demand for the laptop as it
is capable of function efficiently in critical job condition and the longevity also depends on
the feature of the laptop which attracts the potential consumers. Post purchase service is the
service provided by the company of that laptop for maintenance and to resolve the technical
problems which may occur after the purchase of laptop. Now a days, almost every brand and
company provides one year free service for the laptop to the consumer. So, the quality of the
post purchase service can attract the consumers. Payment condition is one of the vital factors
that help the customers at the time of purchasing laptop that can provide them a choice of
payment through credit card or in few installments. These payment conditions can help the
customers with low financial conditions. The peripheral specifications are standby duration,
number and quality functions of USB ports, speakers, modem and DVD/CD player. This
features are important as it also can impact the demand for the laptop. Physical appearance
means the width, length, design and color of the laptop. This makes the laptop attractive to
the consumer and thus it has an impact on the demand.
Answer 1.i
A lurking variable is not include in the model as an independent or explanatory
variable or not considered in the analysis but it has an impact in interpretation of relation
within variables. The variable can show a false strong relationship or can omit significant
relationship between the variables. Thus the lurking variables can change the outcomes and
tabler-icon-diamond-filled.svg

Paraphrase This Document

Need a fresh take? Get an instant paraphrase of this document with our AI Paraphraser
Document Page
7BUSINESS STATISTICS
the interpretation of an analysis and it will be very difficult to conclude. The conclusion of
the analysis will be wrong if these variables are not considered in the analysis. There are
three ways to consider the lurking variables. That are explained as follows:
1. The lurking variables should be omitted from the analysis.
2. The lurking variables should be made constant in thee analysis.
3. The lurking variables should be included in the analysis.
There are few steps and ways to identify the lurking variables. One of the best way to
identify the effect of lurking variables is to observe the data but is very difficult. The error
term can also identify the lurking variable in the analysis. To identify the lurking variable one
have to take time to understand the variables that are present in data set and discover the
important variables. One more way to identify the variable is to plot the data set to observe
any non-linear trend that can be the evidence of presence of lurking variable.
Answer 1.j
To analyze the market for the business of making laptops there needs to be added
more significant variables. So the variable like technical feature of the laptop, post purchase
services, payment conditions, peripheral specification, physical appearance and value added
features can be added. There will be indices to measure these variables or proxies can be
used. Then the process of analysis can be started to analyze the demand for the laptop of
version 1 and laptop of version 2. If the age, gender, education and occupation status of the
consumer is added then there will be more specific results. But in this cases, it needs to be
ensured that the variables are defined well like age is a categorical variable, education and
occupation is an ordinal variable. This can also have impact on the demand for the laptops
like demand for consumers at various educational level is different. Hence, the variables
needs to be defined and the analysis should proceed accordingly otherwise these variables
Document Page
8BUSINESS STATISTICS
could be proved as a lurking variable. Though, there is enough possible ways to deal with
lurking variable. At the end of the analysis there will be results on specific demand for
different version of laptops across different regions, age groups, educational level, technical
feature, peripheral feature and post purchase services.
Document Page
9BUSINESS STATISTICS
chevron_up_icon
1 out of 10
circle_padding
hide_on_mobile
zoom_out_icon
[object Object]