Business Statistics Report: Global Corporation Data Analysis
VerifiedAdded on  2023/01/23
|8
|1152
|94
Report
AI Summary
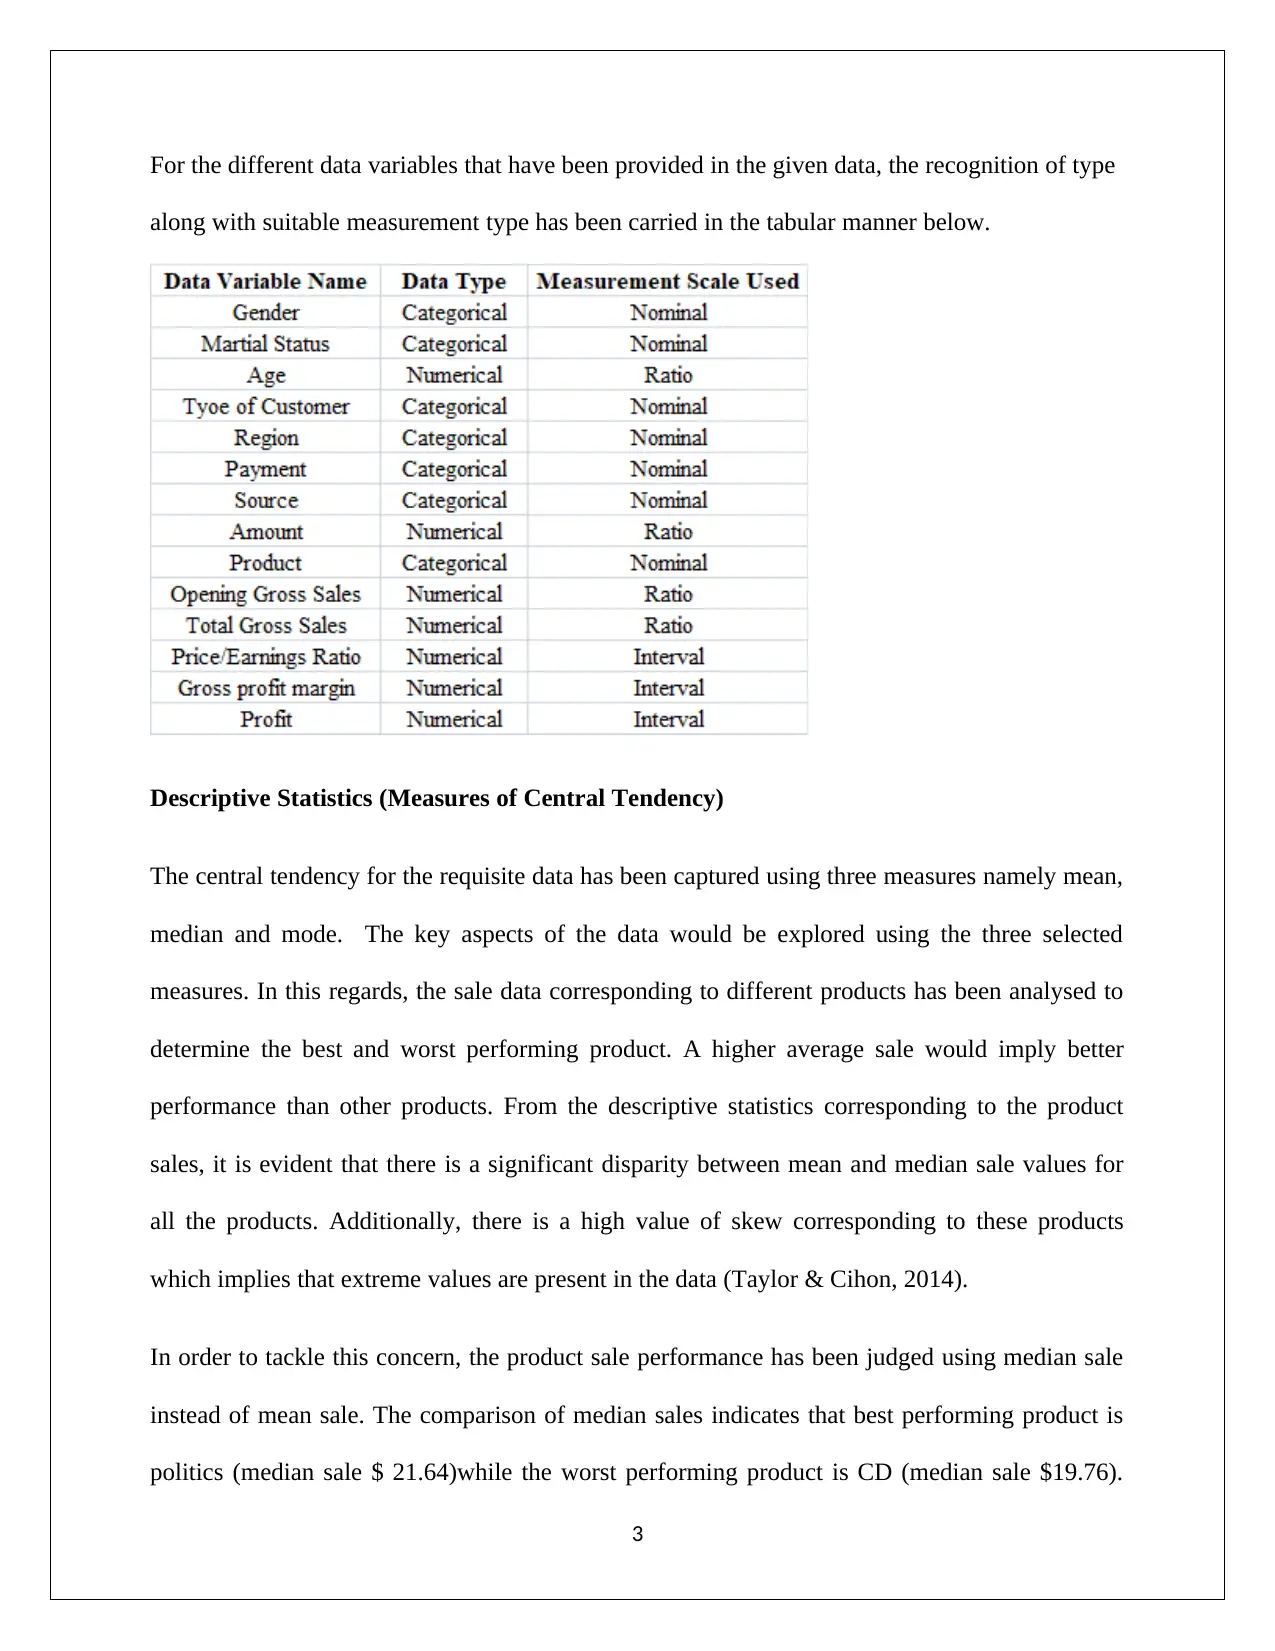
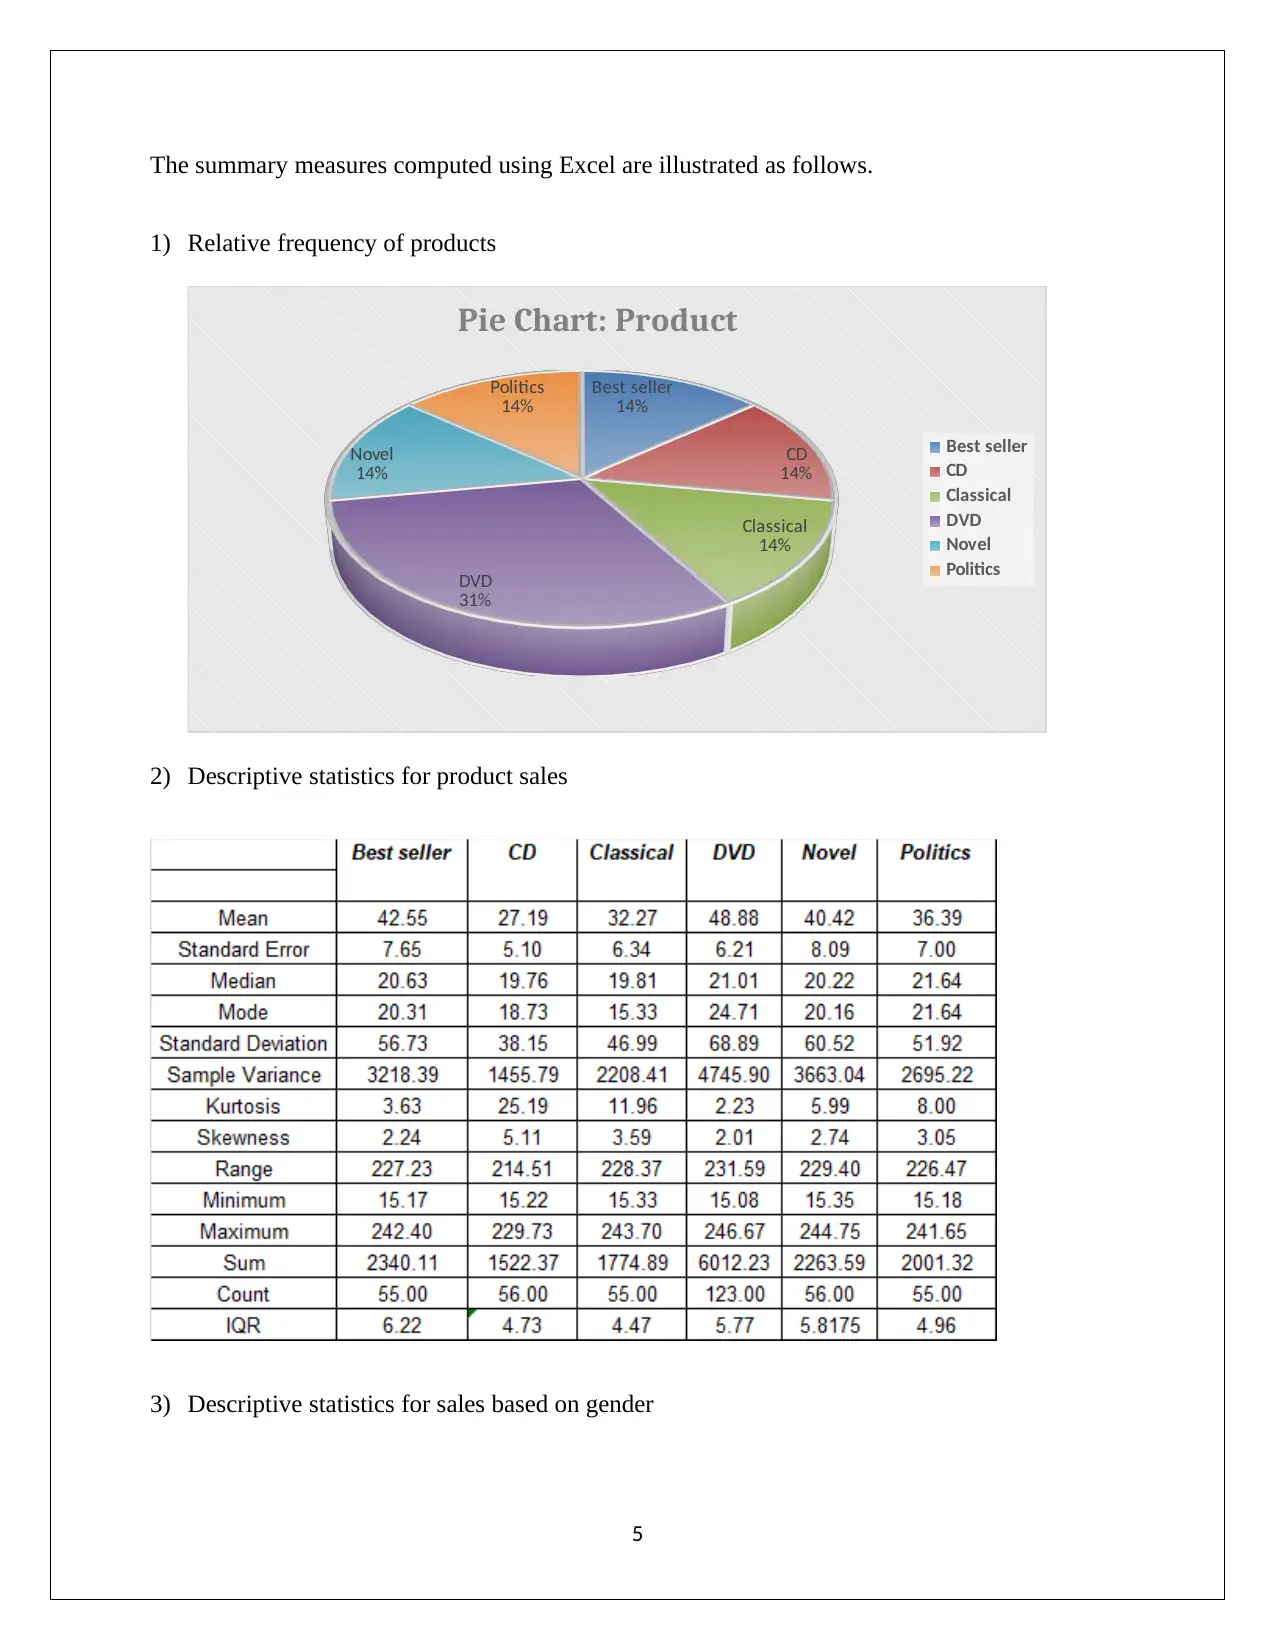
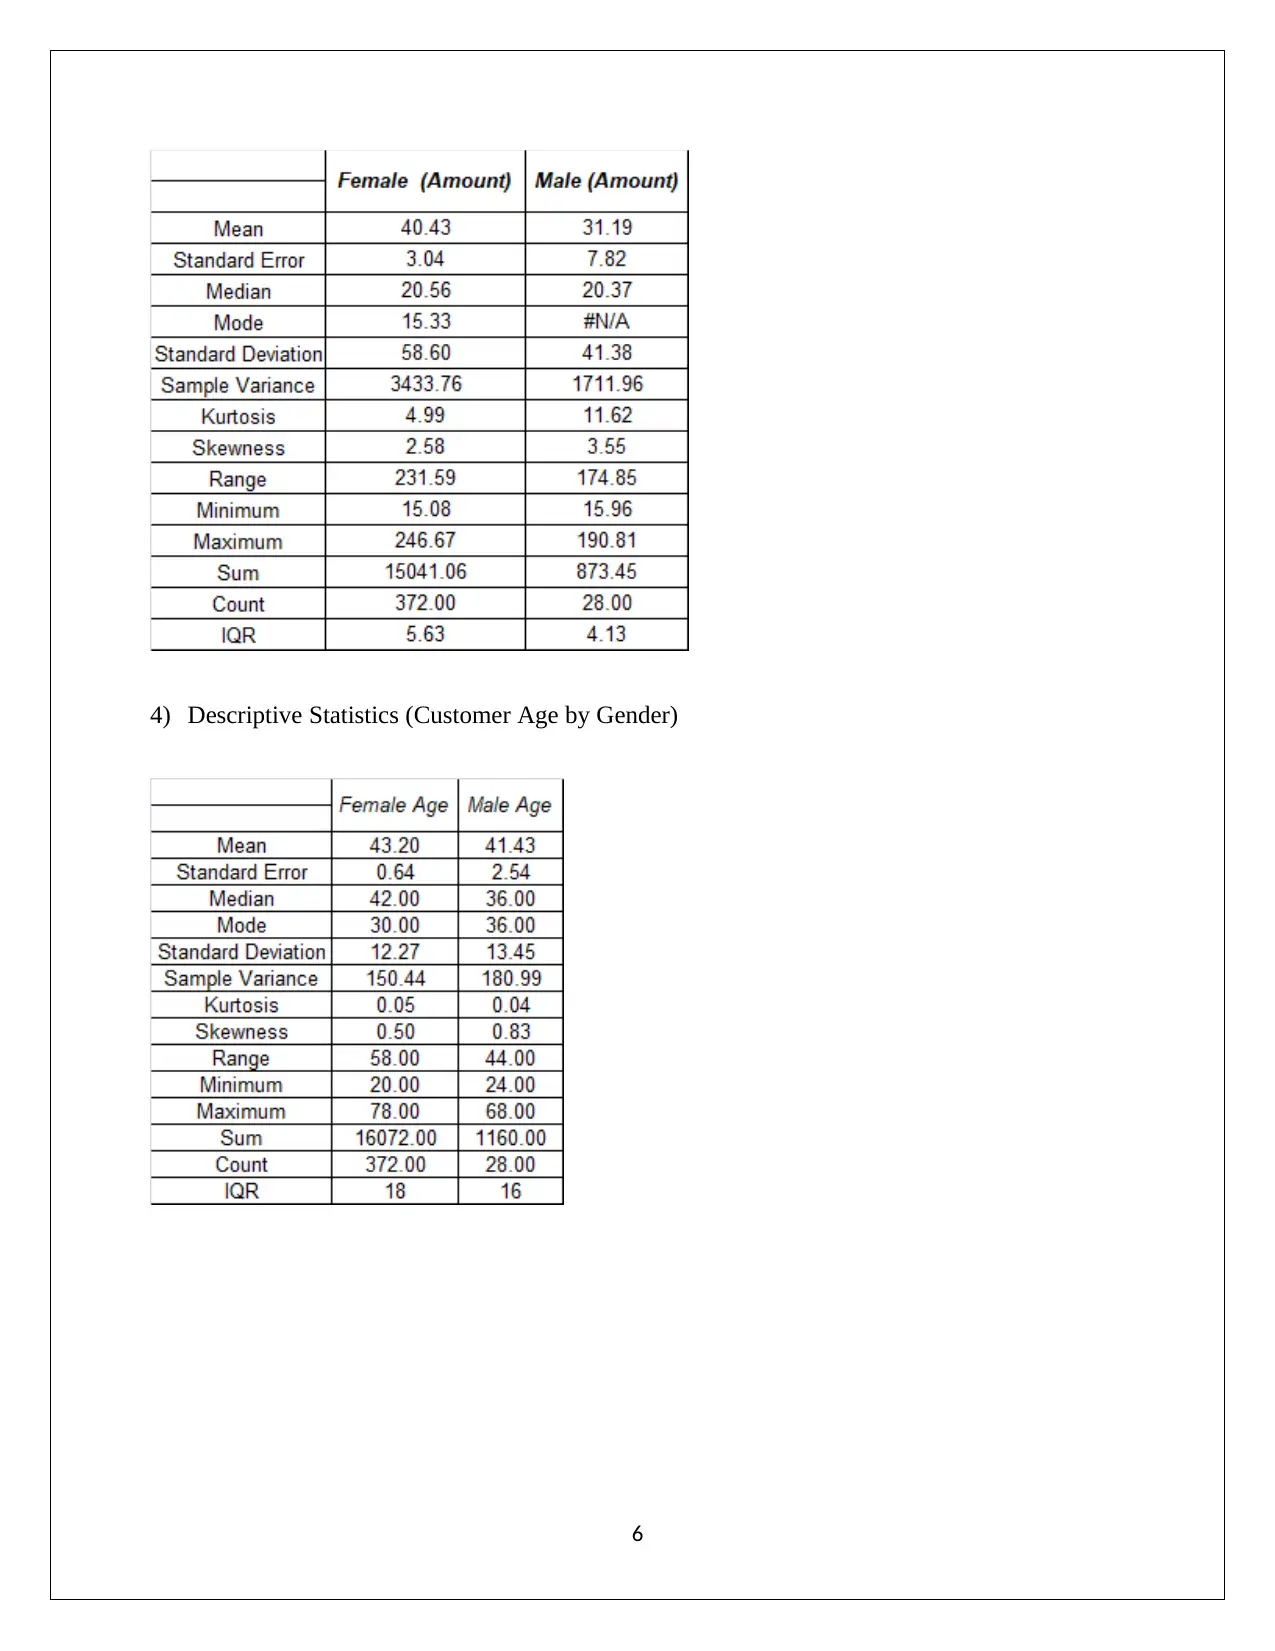
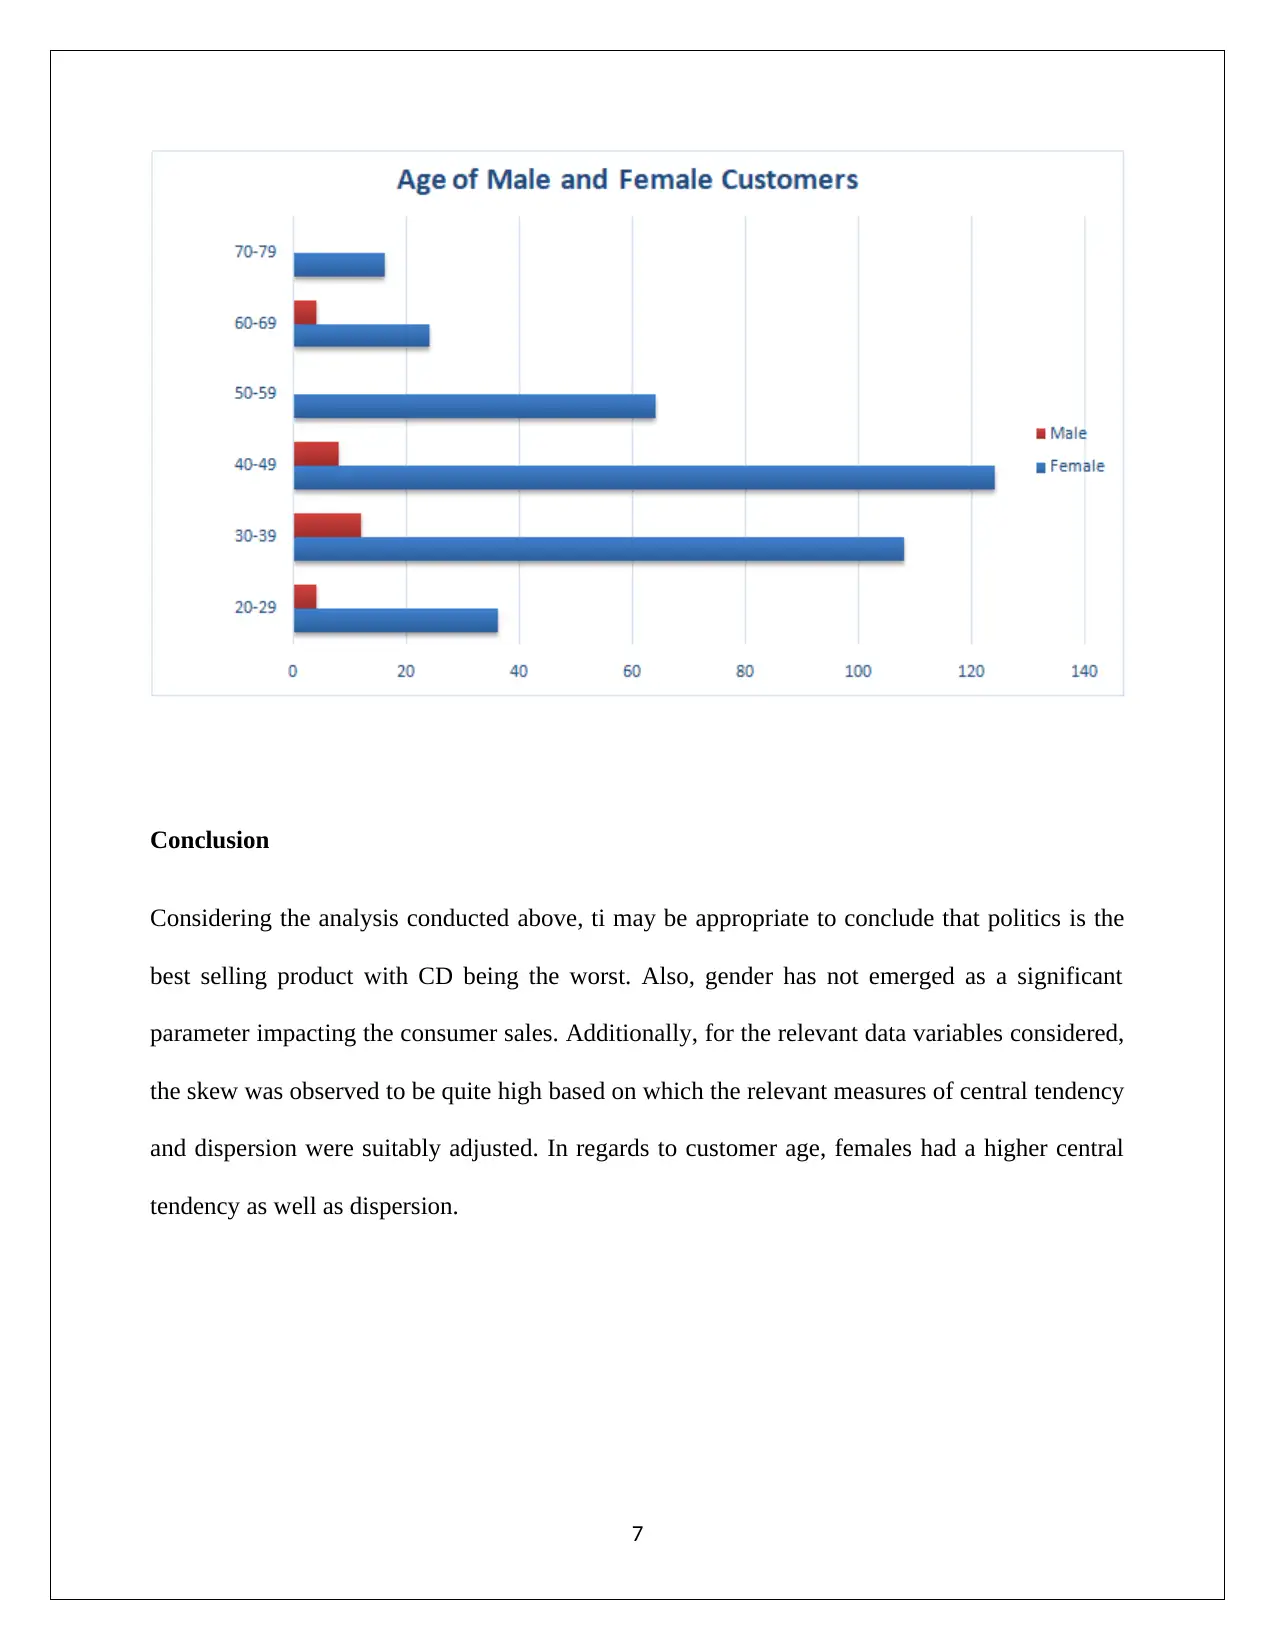
This report analyzes sales data and customer attributes for a global corporation to assess the relationship between sales and gender, as well as identify best and worst-performing products. The analysis utilizes descriptive statistics, including measures of central tendency (mean, median, mode) and dispersion (standard deviation, variance, IQR), to evaluate product sales, sales by gender, and customer age. The report finds that politics is the best-selling product and CD is the worst. There is no significant difference in average sales between genders, but females have a higher median age and greater dispersion in spending. The report highlights the importance of considering skewness in the data and using appropriate statistical measures like the median and IQR to avoid misleading conclusions. Visual aids, such as pie charts and descriptive statistics tables, are used to summarize the findings. The conclusion reiterates key insights and emphasizes the importance of aligning promotional activities and product mix based on customer analysis.

BUSINESS STATISTICS
STUDENT ID:
[Pick the date]
STUDENT ID:
[Pick the date]
Paraphrase This Document
Need a fresh take? Get an instant paraphrase of this document with our AI Paraphraser

Introduction
Customer analysis and sales analysis play a pivotal role in the success of global corporations
owing to product mix and customer targeting being influenced by the same. The given situation
pertains to a global corporation which has multiple product lines. Sample data has been provided
pertaining to the sale of various products along with the customer attributes linked to various
transactions. The objective of this report is to analyse the given data in order to outline if sales
tend to be dependent on the gender or not. Further, the analysis would also relate to any
significant difference in the age of male and female customers. Also, the best and the worst
performing products as per the sales data would also be identified.
Problem Definition and Business Intelligence Required
The global corporation wishes to analyse the customers especially with regards to gender so that
the focus on the promotional activities and also the product mix can be suitable aligned. Also, it
wants to analyse the sales performance of the various available products so that more focus can
be paid on those which tend to be popular with customers and thereby maximize sales. The
smaple data provided has been analysed with the aid of Excel and focus has been on presenting
the summary of key variables along with the descriptive statistics. In relation to descriptive
statistics, the two types of measures form the focus which relate to central tendency measures
along with dispersion measures that have been used to analyse the data and provide useful
information.
Data Variables and Data Types
2

For the different data variables that have been provided in the given data, the recognition of type
along with suitable measurement type has been carried in the tabular manner below.
Descriptive Statistics (Measures of Central Tendency)
The central tendency for the requisite data has been captured using three measures namely mean,
median and mode. The key aspects of the data would be explored using the three selected
measures. In this regards, the sale data corresponding to different products has been analysed to
determine the best and worst performing product. A higher average sale would imply better
performance than other products. From the descriptive statistics corresponding to the product
sales, it is evident that there is a significant disparity between mean and median sale values for
all the products. Additionally, there is a high value of skew corresponding to these products
which implies that extreme values are present in the data (Taylor & Cihon, 2014).
In order to tackle this concern, the product sale performance has been judged using median sale
instead of mean sale. The comparison of median sales indicates that best performing product is
politics (median sale $ 21.64)while the worst performing product is CD (median sale $19.76).
3
⊘ This is a preview!⊘
Do you want full access?
Subscribe today to unlock all pages.

Trusted by 1+ million students worldwide

With regards to the sales comparison by gender, the problem of skew is again evident which
leads to high disparity between the mean and median sales. As a result, median values have been
preferred as a more faithful representation of central tendency (Medhi, 2015). On the basis of
median sale comparison of both genders, it can be concluded that there is not significant
difference in the average sales for the two genders as there is difference of only $0.19. The age
comparison using median indicates that there was a significant difference in the median age of
the two genders with females having a higher median age value.
Descriptive Statistics (Measures of dispersion)
The dispersion present in the data has been measured with the aid of standard deviation,
variance, range along with IQR (Inter-Quartile Range) (Hair, Wolfinbarger, Money, Samouel &
Page, 2015). Considering that the various variables under consideration have a high degree of
skew, it will not be appropriate to use standard deviation or variance as the extreme values will
overstate the dispersion in the data. Thus, IQR is a suitable measure of dispersion as it is not
impacted by the presence of extreme values (Lind, Marchal & Wathen, 2016).
In relation to dispersion of product categories, the lowest IQR has been witnessed for the
classical category while the highest IQR is observed for best seller. This is on expected lines as
sale of classical does not vary while the best sellers tend to fluctuate. In relation to spending by
gender dispersion comparison, IQR is a suitable choice considering the extent of skew that is
present in the spending distribution of both the genders. A higher dispersion in spending has
been observed for female customers when compared with male counterparts. Also, in the context
of customer age, dispersion is higher for female customers in comparison with male customers.
Summary Measures
4
Paraphrase This Document
Need a fresh take? Get an instant paraphrase of this document with our AI Paraphraser

The summary measures computed using Excel are illustrated as follows.
1) Relative frequency of products
Best seller
14%
CD
14%
Classical
14%
DVD
31%
Novel
14%
Politics
14%
Pie Chart: Product
Best seller
CD
Classical
DVD
Novel
Politics
2) Descriptive statistics for product sales
3) Descriptive statistics for sales based on gender
5
1) Relative frequency of products
Best seller
14%
CD
14%
Classical
14%
DVD
31%
Novel
14%
Politics
14%
Pie Chart: Product
Best seller
CD
Classical
DVD
Novel
Politics
2) Descriptive statistics for product sales
3) Descriptive statistics for sales based on gender
5

4) Descriptive Statistics (Customer Age by Gender)
6
6
⊘ This is a preview!⊘
Do you want full access?
Subscribe today to unlock all pages.

Trusted by 1+ million students worldwide

Conclusion
Considering the analysis conducted above, ti may be appropriate to conclude that politics is the
best selling product with CD being the worst. Also, gender has not emerged as a significant
parameter impacting the consumer sales. Additionally, for the relevant data variables considered,
the skew was observed to be quite high based on which the relevant measures of central tendency
and dispersion were suitably adjusted. In regards to customer age, females had a higher central
tendency as well as dispersion.
7
Paraphrase This Document
Need a fresh take? Get an instant paraphrase of this document with our AI Paraphraser

References
Hair, J. F., Wolfinbarger, M., Money, A. H., Samouel, P., & Page, M. J. (2015). Essentials of
business research methods (2nded.). New York: Routledge.
Lind, A.D., Marchal, G.W. & Wathen, A.S. (2016).Statistical Techniques in Business and
Economics (15thed.). New York : McGraw-Hill/Irwin.
Medhi, J. (2015). Statistical Methods: An Introductory Text (4thed.). Sydney: New Age
International.
Taylor, K. J. & Cihon, C. (2014).Statistical Techniques for Data Analysis (2nded.). Melbourne:
CRC Press
8
1 out of 8
Related Documents
Your All-in-One AI-Powered Toolkit for Academic Success.
 +13062052269
info@desklib.com
Available 24*7 on WhatsApp / Email
Unlock your academic potential
Copyright © 2020–2025 A2Z Services. All Rights Reserved. Developed and managed by ZUCOL.


