HI6007: Business Decision Making Using Statistical Tools Assignment
VerifiedAdded on 2022/12/22
|11
|1928
|2
Report
AI Summary
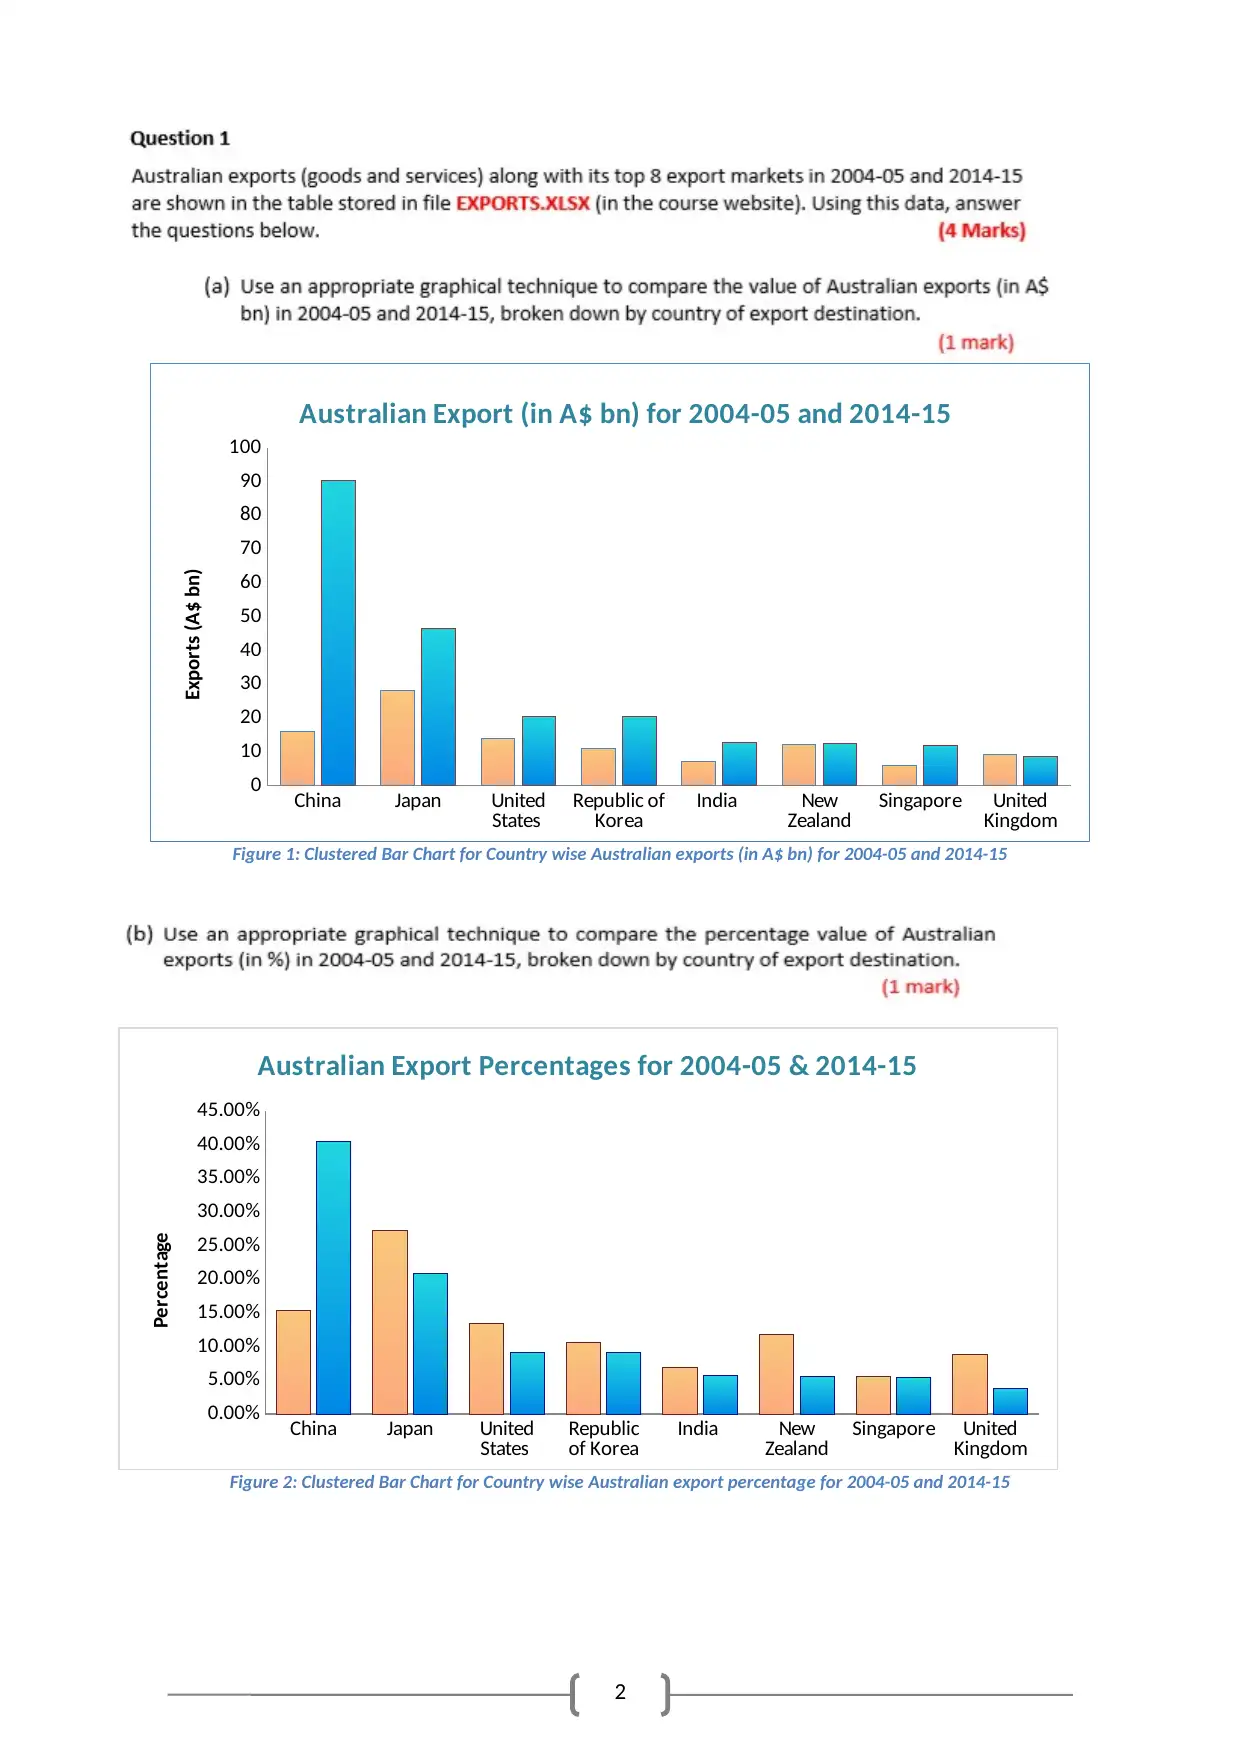
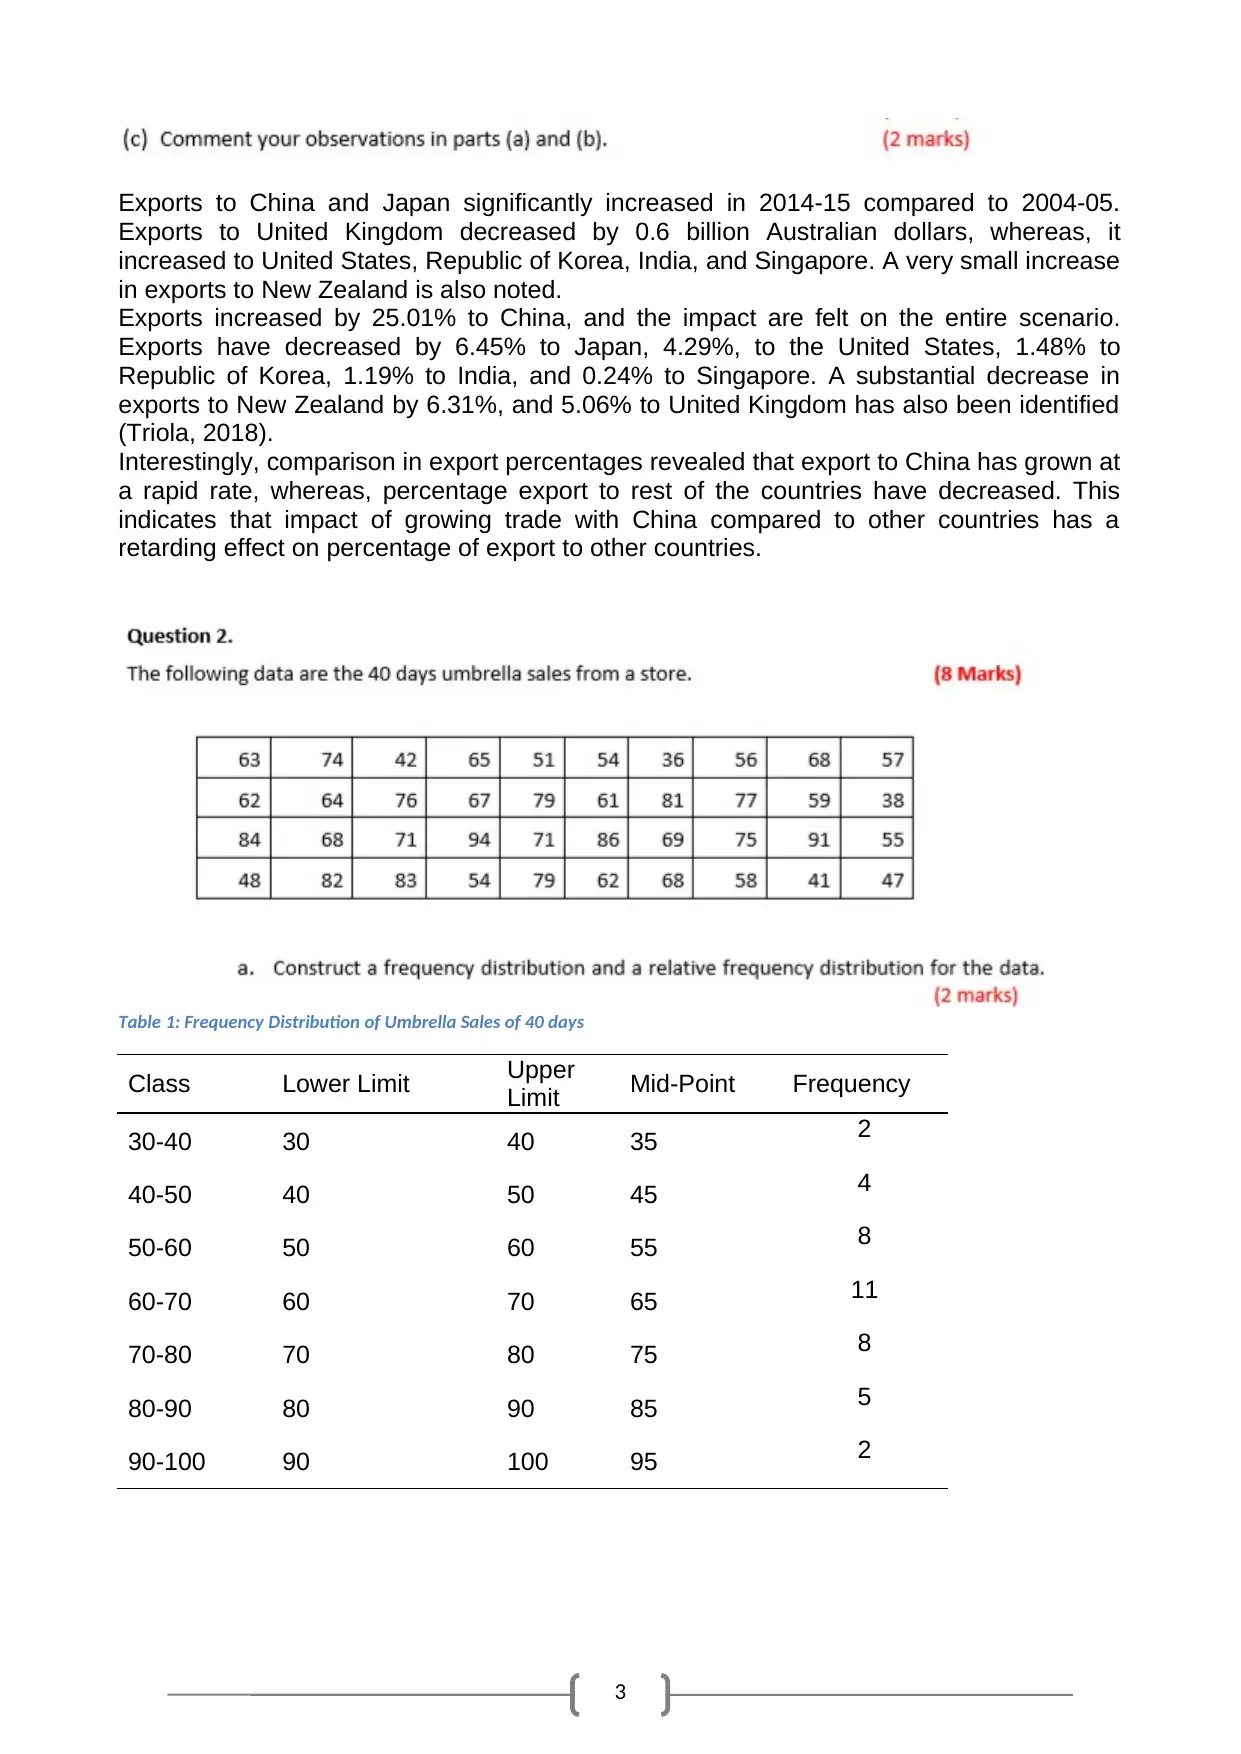
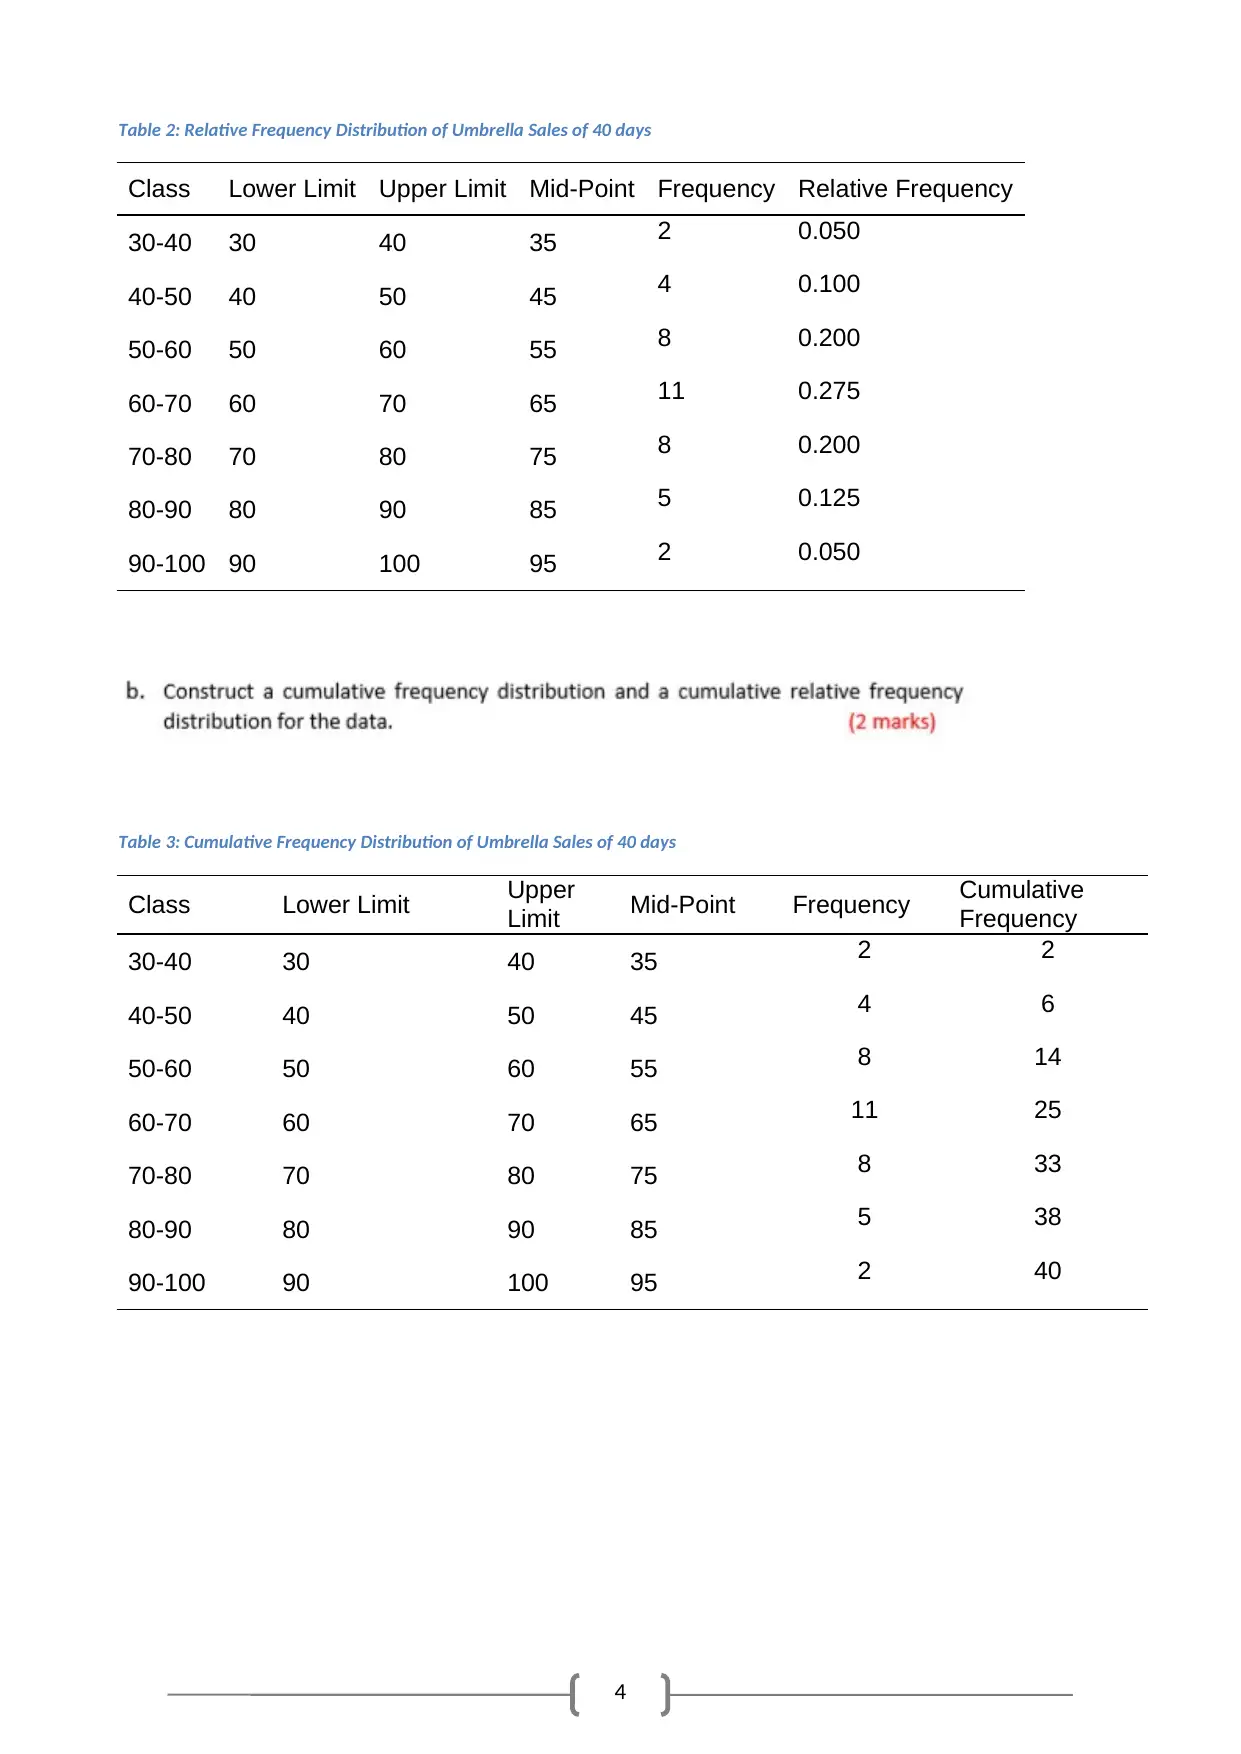
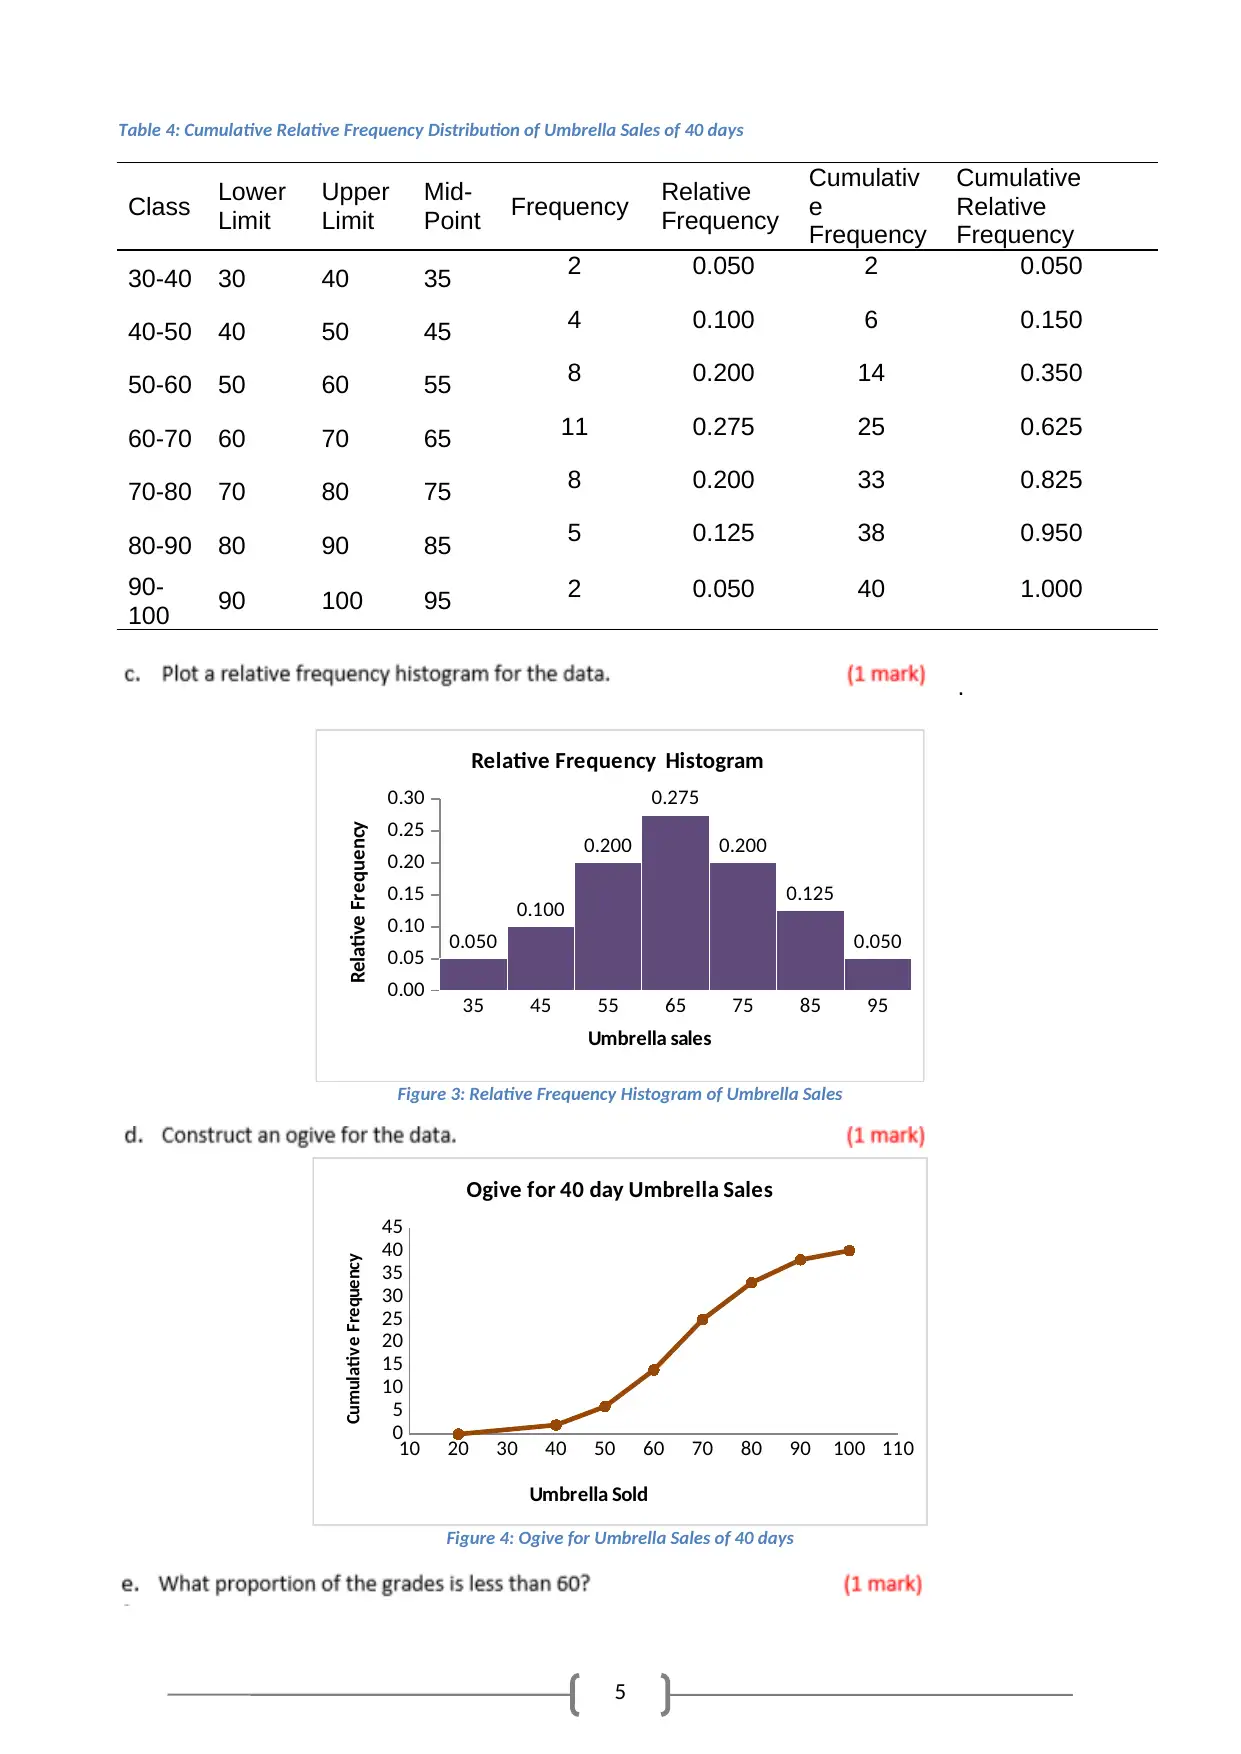
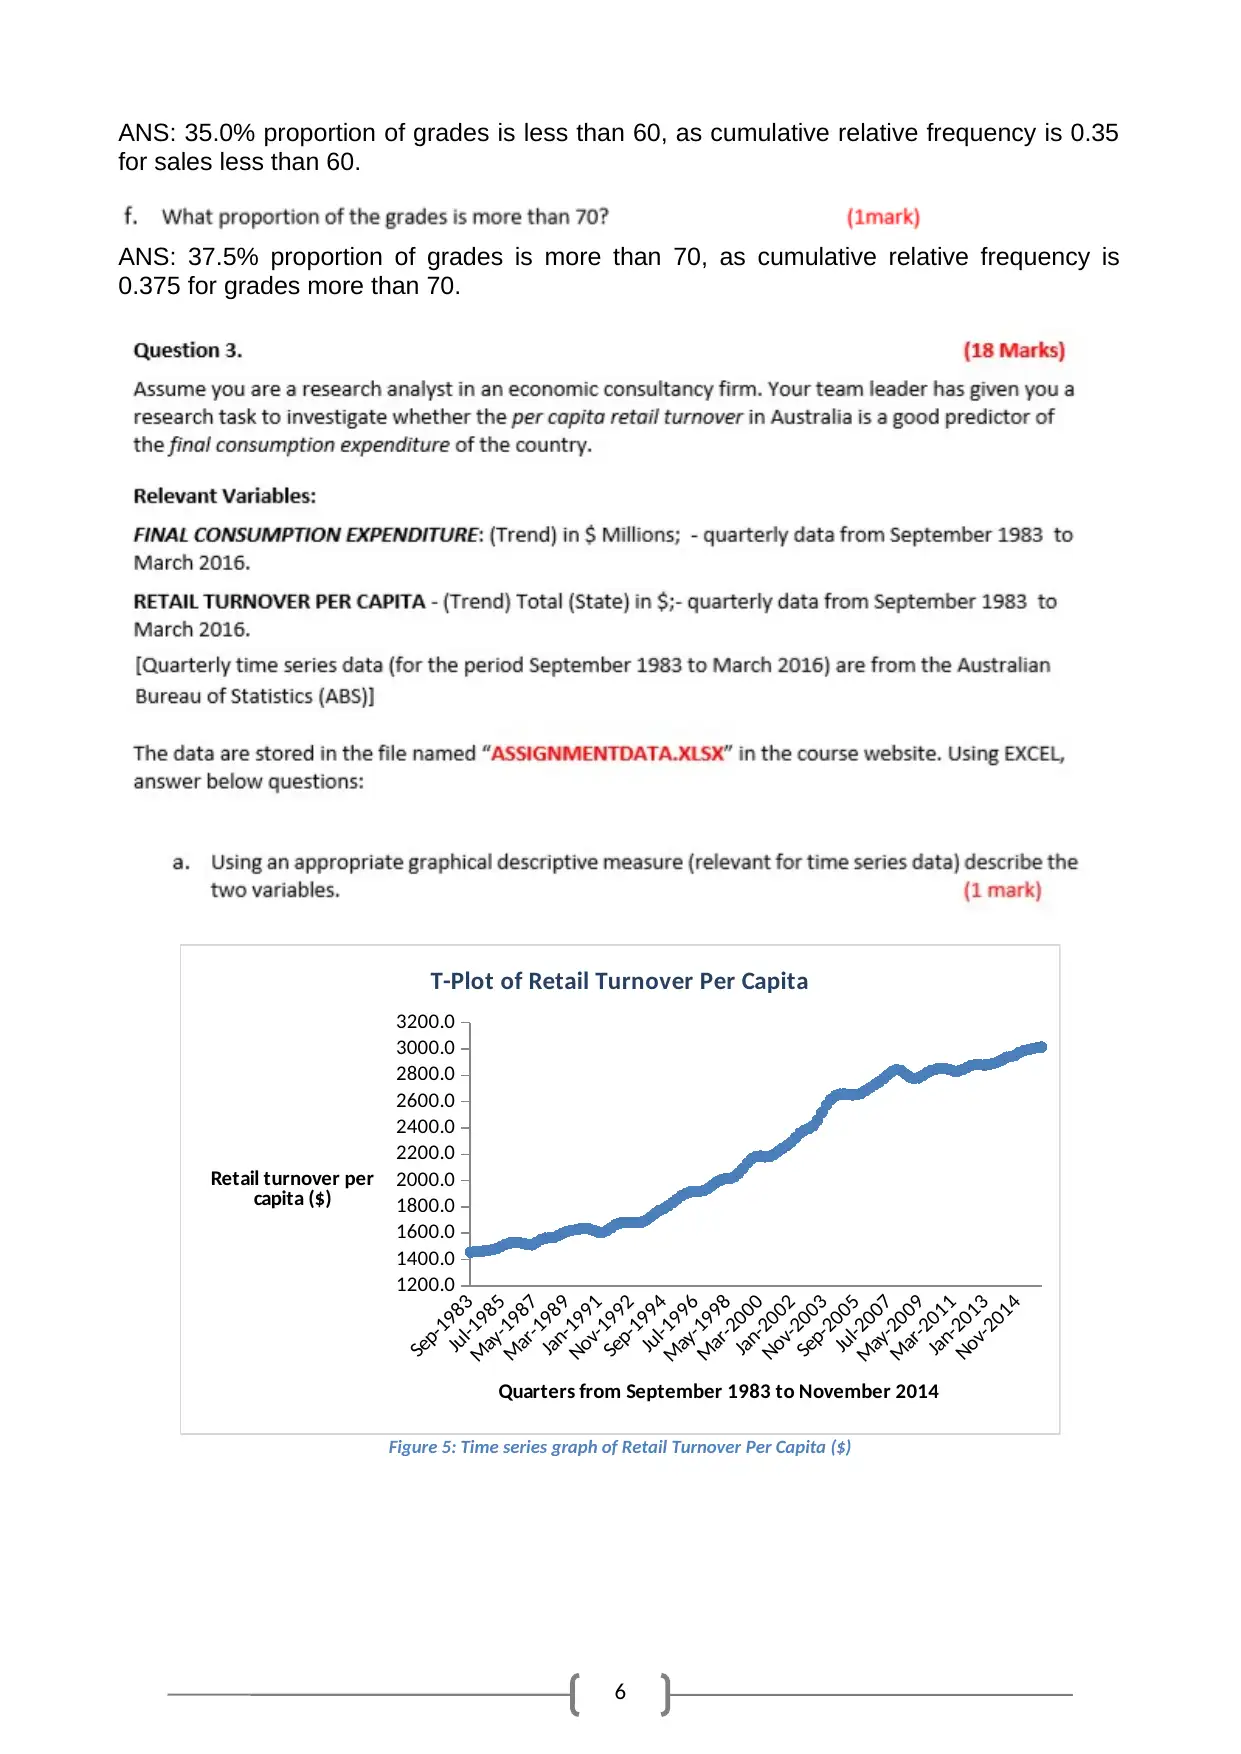
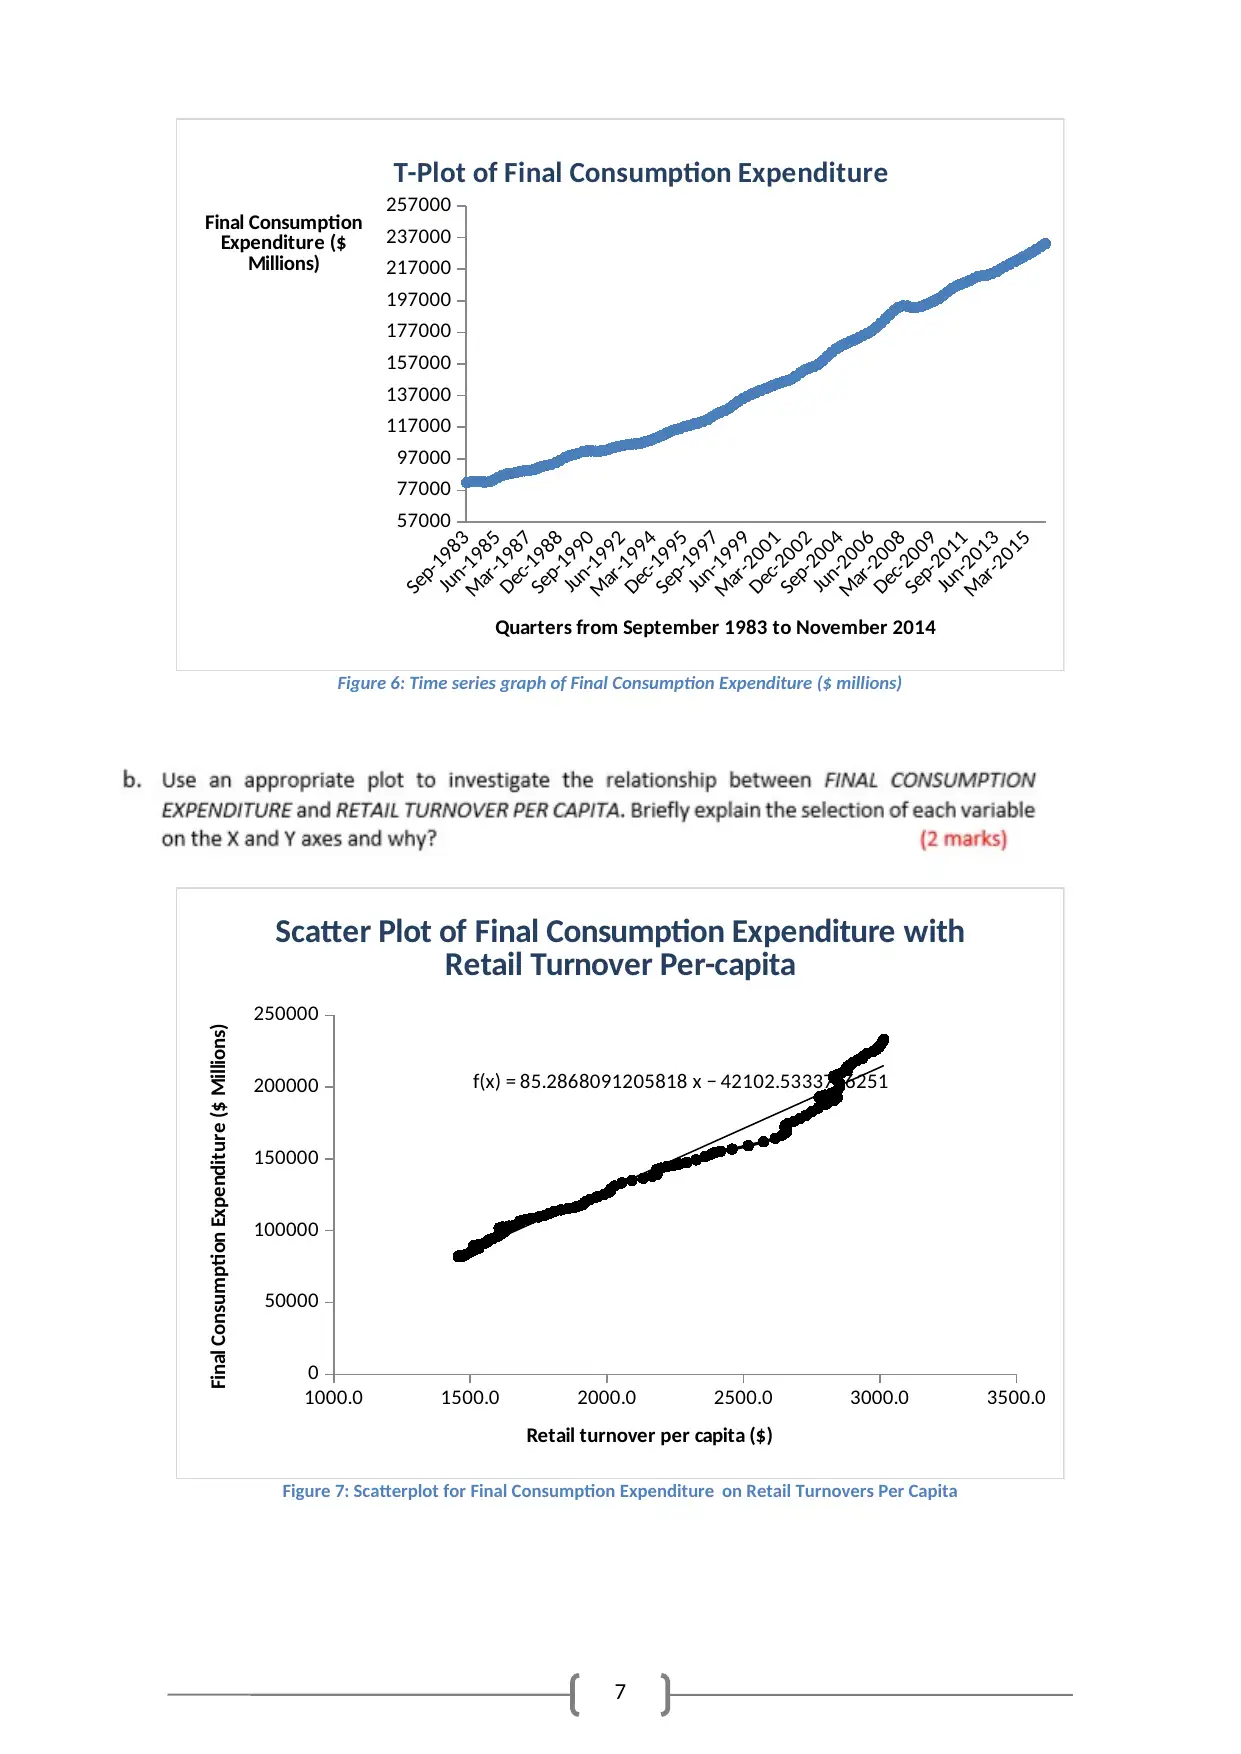
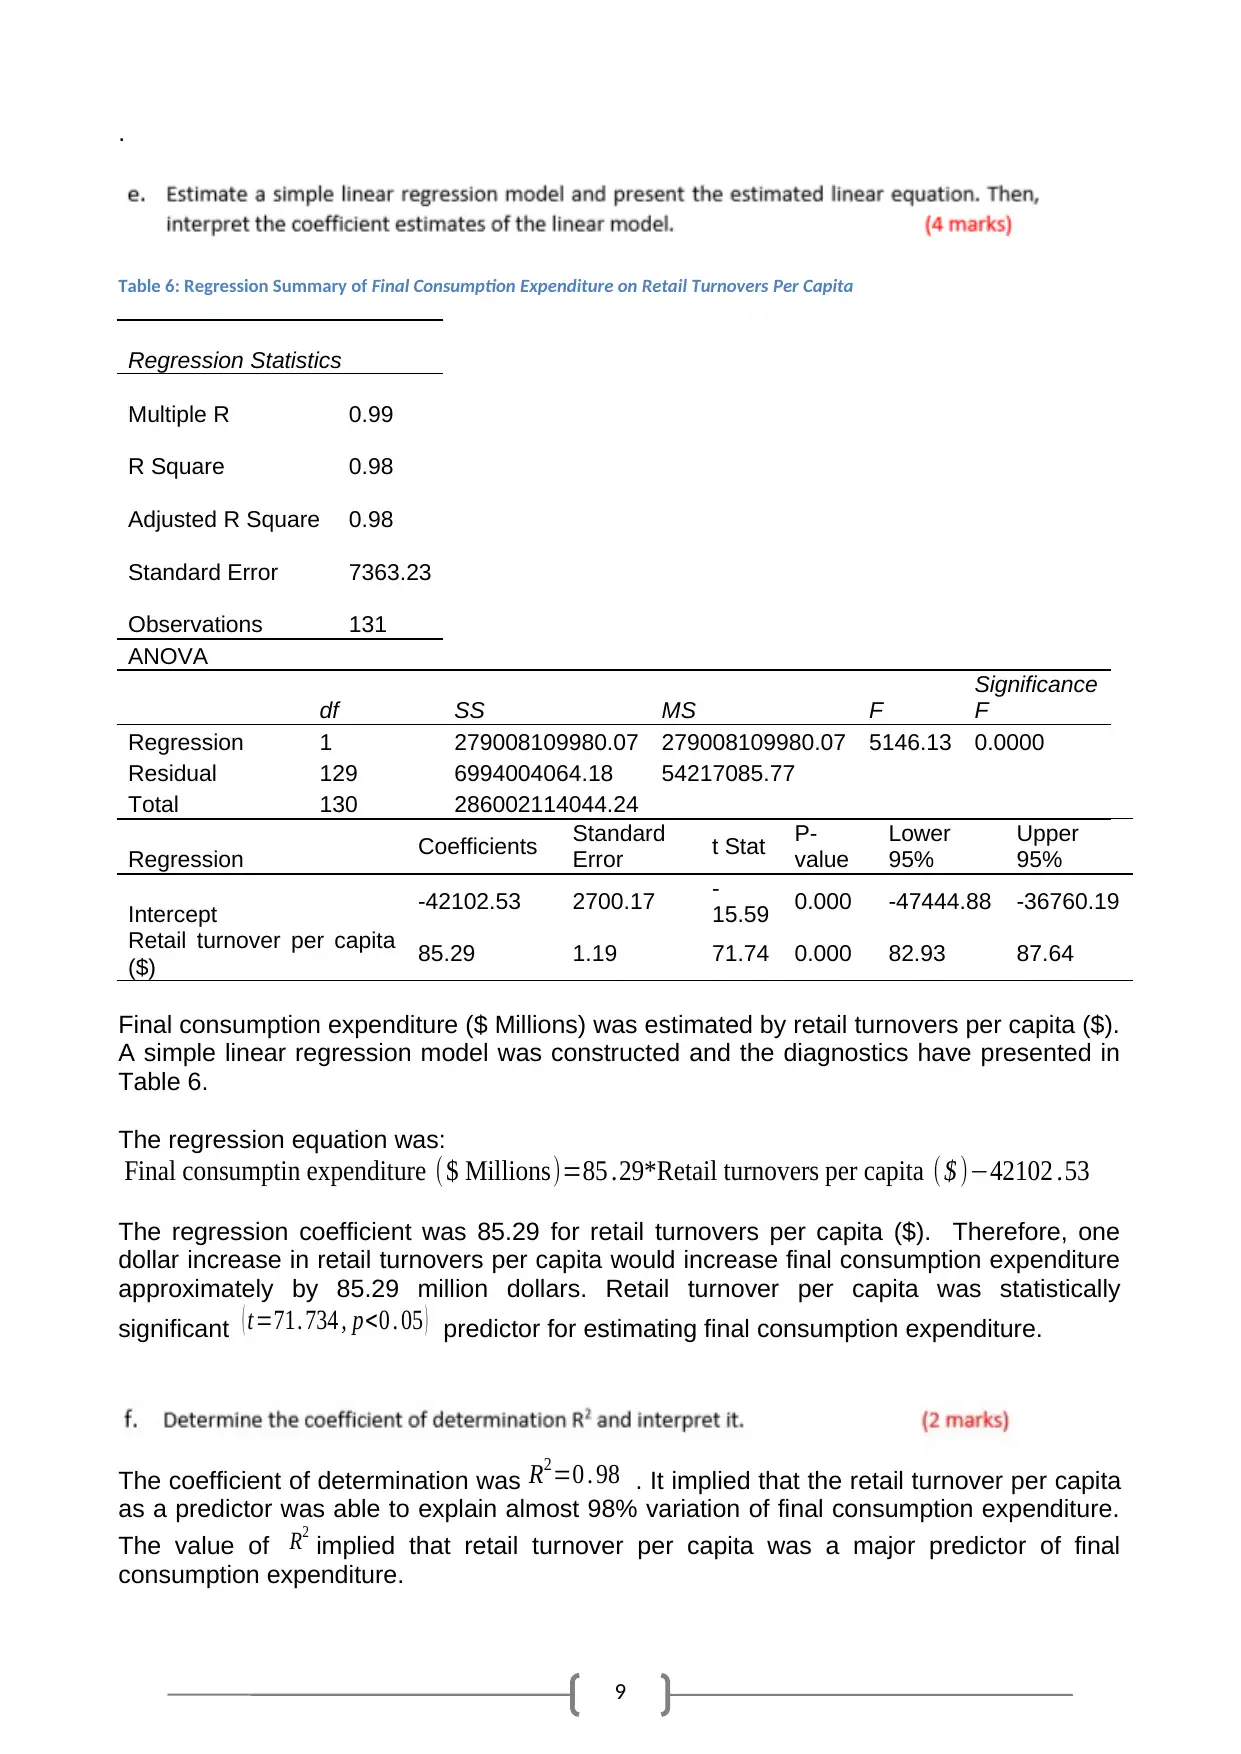
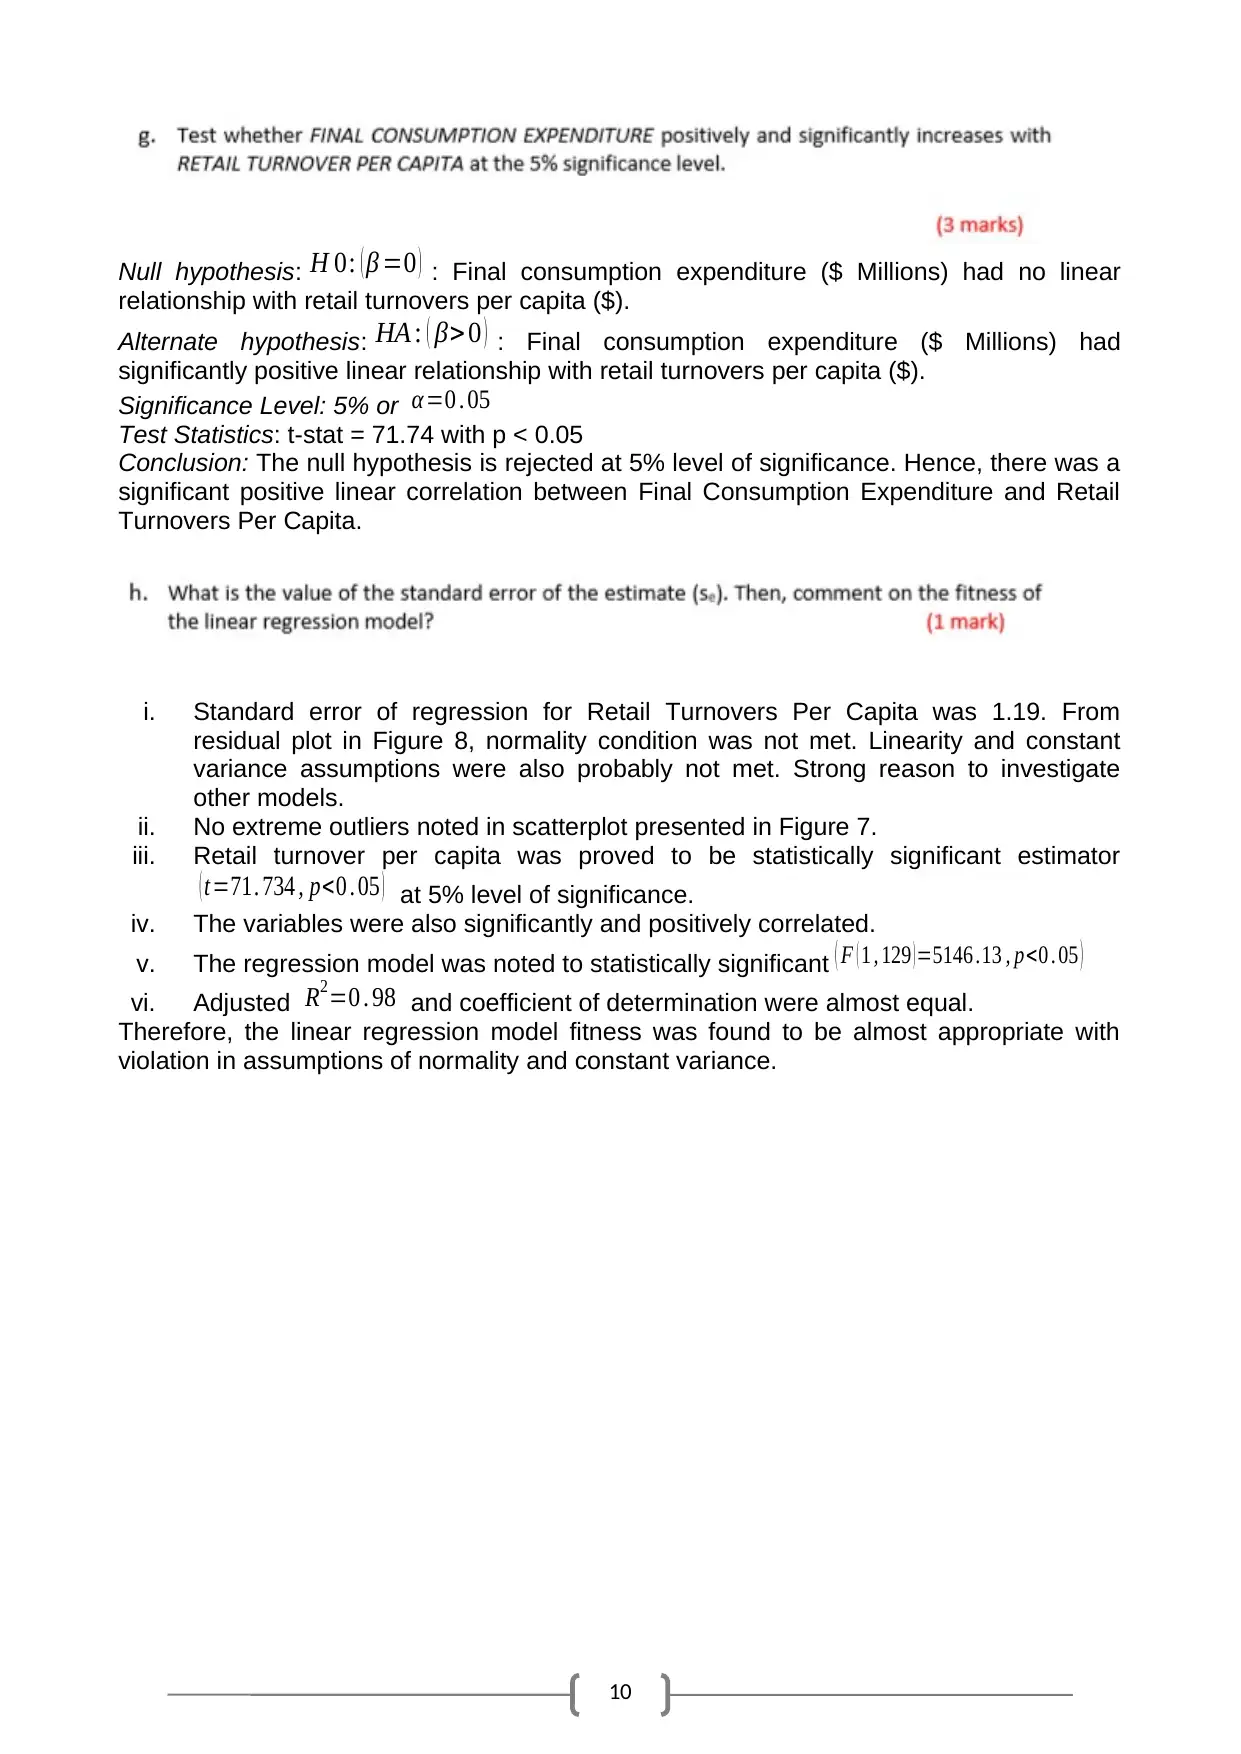
This report presents a statistical analysis of various business scenarios. It begins with an examination of Australian export data from 2004-05 to 2014-15, utilizing clustered bar charts to compare exports to different countries and analyzing percentage changes. The report then delves into frequency distributions, relative frequency, and cumulative frequency distributions, along with histograms and ogives, using umbrella sales data. Furthermore, the report includes a time series analysis of retail turnover per capita and final consumption expenditure, supported by a scatter plot and regression analysis. Key findings include the identification of a strong positive correlation between retail turnover and final consumption expenditure, along with the regression equation and associated statistical tests. The analysis highlights the significance of retail turnover per capita as a predictor of final consumption expenditure, while also acknowledging the limitations of the regression model and the need for further investigation into model assumptions. Finally, the report includes key descriptive statistics and regression results, providing insights into the relationships between the variables and the implications for business decision-making.
1 out of 11
Related Documents


Your All-in-One AI-Powered Toolkit for Academic Success.
+13062052269
info@desklib.com
Available 24*7 on WhatsApp / Email
![[object Object]](/_next/static/media/star-bottom.7253800d.svg)
Copyright © 2020–2026 A2Z Services. All Rights Reserved. Developed and managed by ZUCOL.