Business Statistics Report: Laptop Market Research and Analysis
VerifiedAdded on 2022/11/01
|11
|1917
|334
Report
AI Summary
This report analyzes a dataset from a market research company, XYZ, investigating potential buyers' willingness to pay for two laptop versions across two regions (A and B). The analysis includes descriptive statistics, scatter plots, and t-tests to examine the relationship between payment amounts, regions, and the willingness to pay more for version 1. The report presents confidence intervals, and p-values to support the findings. Furthermore, it explores factors influencing laptop demand, such as occupation, education, age, and social media involvement, and discusses the impact of lurking variables on the analysis. The key findings indicate that the average payment for version 1 laptop is higher in region B compared to region A. The report also provides insights into the importance of considering various factors and lurking variables to predict laptop demand accurately. The report also includes references to relevant literature.
Running head: BUSINESS STATISTICS
Business Statistics
Name of the Student:
Name of the University:
Author Note:
Business Statistics
Name of the Student:
Name of the University:
Author Note:
Paraphrase This Document
Need a fresh take? Get an instant paraphrase of this document with our AI Paraphraser
1BUSINESS STATISTICS
Table of Contents
Answer 1.a..................................................................................................................................2
Answer 1.b.................................................................................................................................2
Answer 1.c..................................................................................................................................3
Answer 1.d.................................................................................................................................3
Answer 1.e..................................................................................................................................4
Answer 1.f..................................................................................................................................5
Answer 1.g.................................................................................................................................6
Answer 1.h.................................................................................................................................6
Answer 1.i..................................................................................................................................7
Answer 1.j..................................................................................................................................8
Reference....................................................................................................................................9
2BUSINESS STATISTICS
Answer 1.a
The relationship between region and average payment for version 1 laptop is
described in the table 1. The table presents the summary statistic for the variables. The
average value of payment for version 1 in region A and B are $1002.91 and $1071.55
respectively. Simply, the average payment for version 1 in region is minimum. The standard
deviation is lesser than in region B for the average payment which implies less variance in
payment for version 1.
Table 1: Relationship between payments for 2 versions of laptop in 2 regions
Column Labels
Values A B Grand Total
Average of how much would they pay for version 1? 1002.914894 1071.54717 1039.29
StdDev of how much would they pay for version 1?2 110.4155065 125.8267238 123.4122719
Count of how much would they pay for version 1? 94 106 200
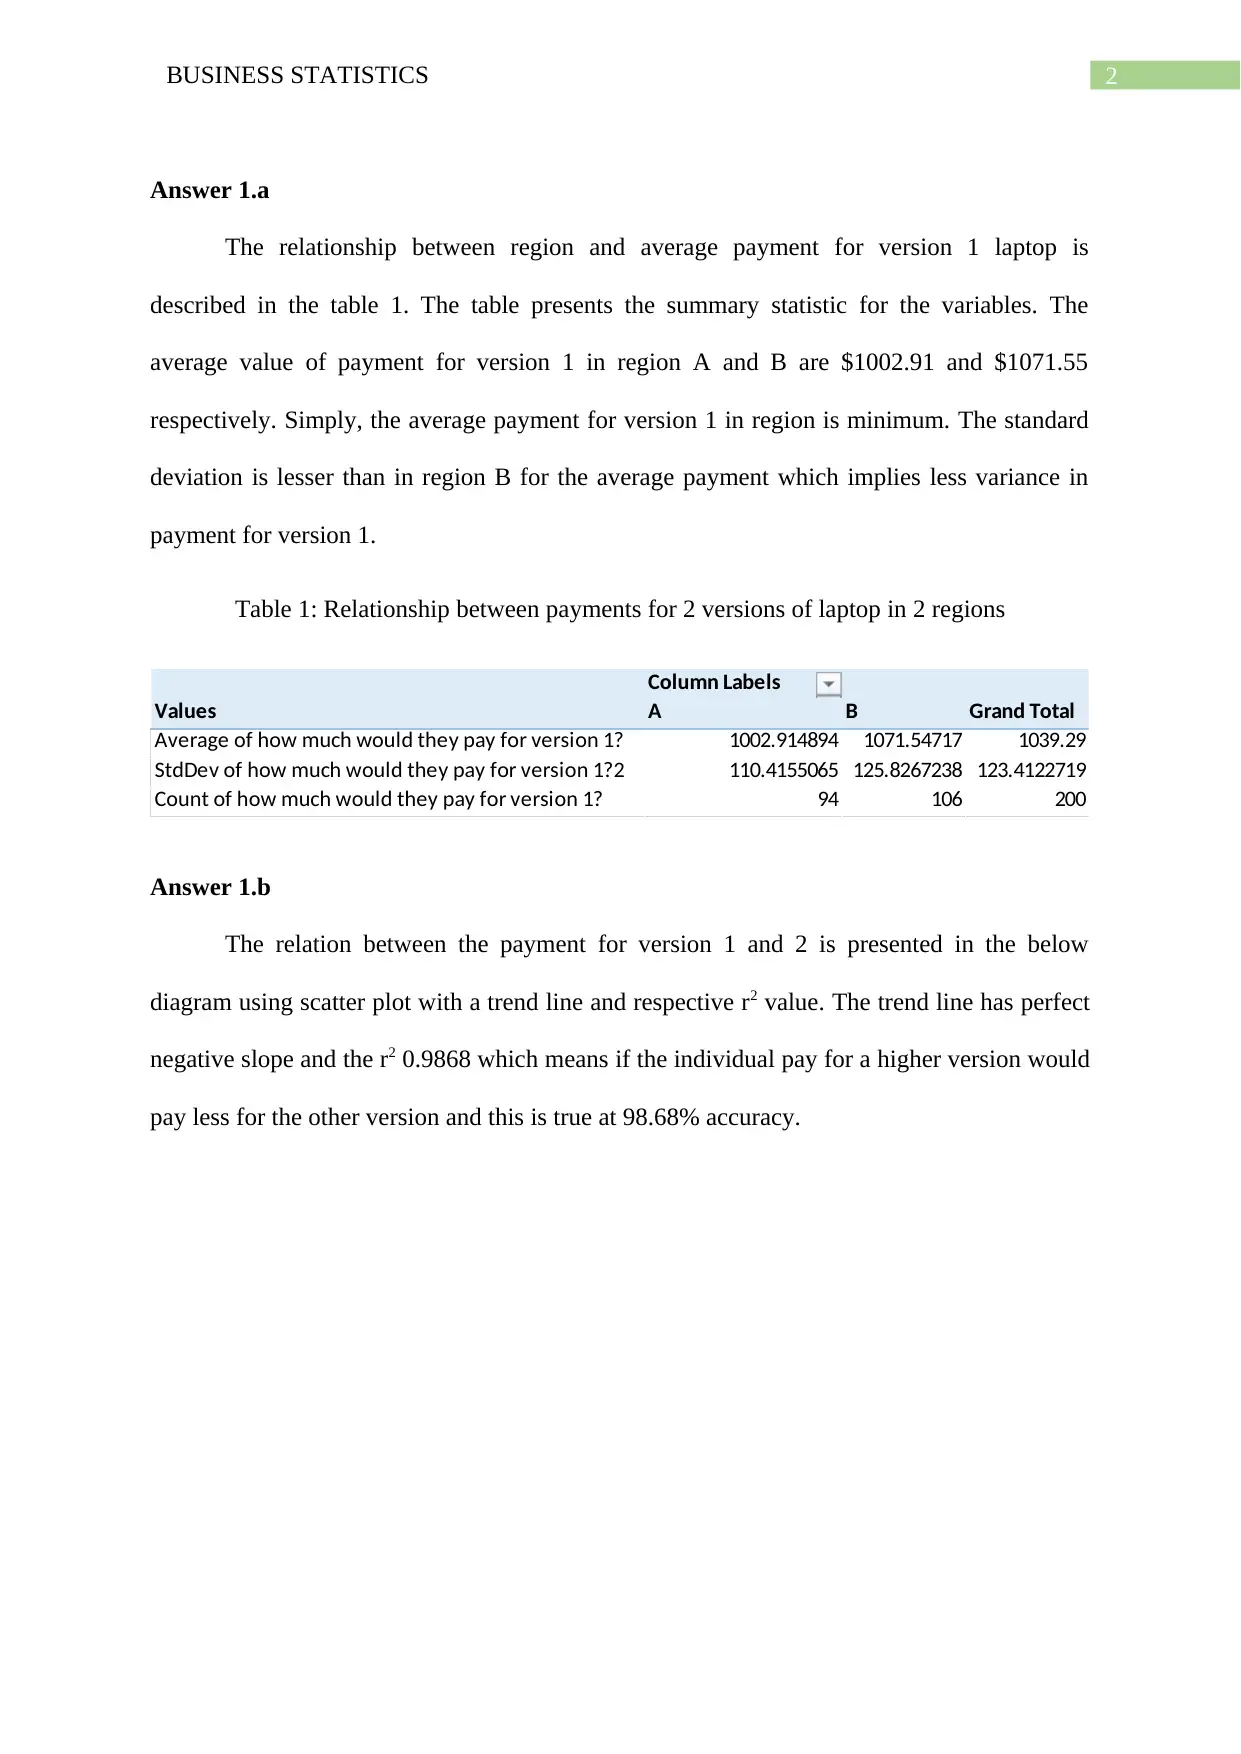
Answer 1.b
The relation between the payment for version 1 and 2 is presented in the below
diagram using scatter plot with a trend line and respective r2 value. The trend line has perfect
negative slope and the r2 0.9868 which means if the individual pay for a higher version would
pay less for the other version and this is true at 98.68% accuracy.
Answer 1.a
The relationship between region and average payment for version 1 laptop is
described in the table 1. The table presents the summary statistic for the variables. The
average value of payment for version 1 in region A and B are $1002.91 and $1071.55
respectively. Simply, the average payment for version 1 in region is minimum. The standard
deviation is lesser than in region B for the average payment which implies less variance in
payment for version 1.
Table 1: Relationship between payments for 2 versions of laptop in 2 regions
Column Labels
Values A B Grand Total
Average of how much would they pay for version 1? 1002.914894 1071.54717 1039.29
StdDev of how much would they pay for version 1?2 110.4155065 125.8267238 123.4122719
Count of how much would they pay for version 1? 94 106 200
Answer 1.b
The relation between the payment for version 1 and 2 is presented in the below
diagram using scatter plot with a trend line and respective r2 value. The trend line has perfect
negative slope and the r2 0.9868 which means if the individual pay for a higher version would
pay less for the other version and this is true at 98.68% accuracy.
⊘ This is a preview!⊘
Do you want full access?
Subscribe today to unlock all pages.
Trusted by 1+ million students worldwide
3BUSINESS STATISTICS
Figure 1: The scatter plot for amount of payment for version 1 and 2 with trend line.
The scatter plot presents the negative relation between the two variables which can be
interpreted as high payment for version 1 indicates the lower payment for the version 2 and
value of R2 says it is accurate by 98.68%.
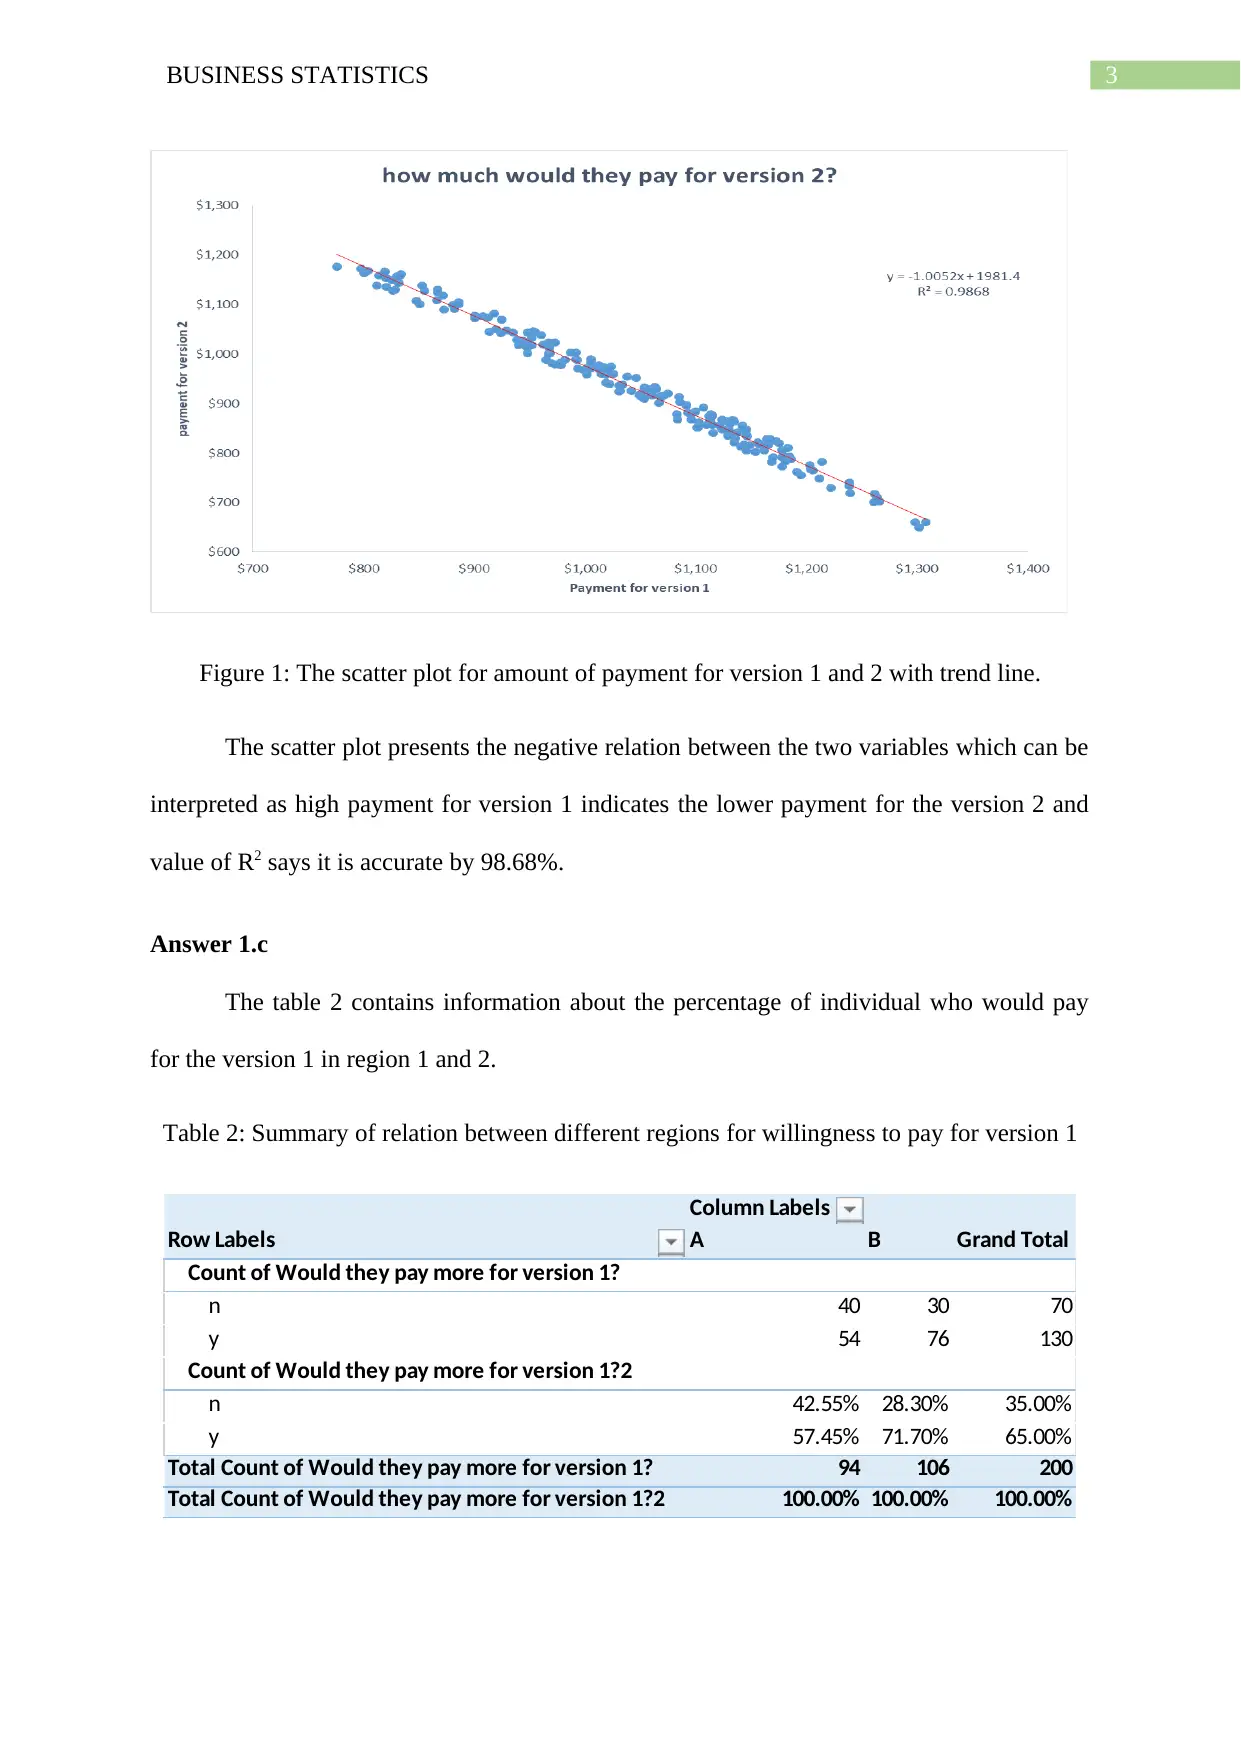
Answer 1.c
The table 2 contains information about the percentage of individual who would pay
for the version 1 in region 1 and 2.
Table 2: Summary of relation between different regions for willingness to pay for version 1
Column Labels
Row Labels A B Grand Total
Count of Would they pay more for version 1?
n 40 30 70
y 54 76 130
Count of Would they pay more for version 1?2
n 42.55% 28.30% 35.00%
y 57.45% 71.70% 65.00%
Total Count of Would they pay more for version 1? 94 106 200
Total Count of Would they pay more for version 1?2 100.00% 100.00% 100.00%
Figure 1: The scatter plot for amount of payment for version 1 and 2 with trend line.
The scatter plot presents the negative relation between the two variables which can be
interpreted as high payment for version 1 indicates the lower payment for the version 2 and
value of R2 says it is accurate by 98.68%.
Answer 1.c
The table 2 contains information about the percentage of individual who would pay
for the version 1 in region 1 and 2.
Table 2: Summary of relation between different regions for willingness to pay for version 1
Column Labels
Row Labels A B Grand Total
Count of Would they pay more for version 1?
n 40 30 70
y 54 76 130
Count of Would they pay more for version 1?2
n 42.55% 28.30% 35.00%
y 57.45% 71.70% 65.00%
Total Count of Would they pay more for version 1? 94 106 200
Total Count of Would they pay more for version 1?2 100.00% 100.00% 100.00%
Paraphrase This Document
Need a fresh take? Get an instant paraphrase of this document with our AI Paraphraser
4BUSINESS STATISTICS
People from region 1 and 2 more like to pay for the version 1 against not to pay for
the version 1. 57.45% of the people in region prefer to pay more for the version 1 laptop and
71.70% of the people form region B prefer to pay for the version 2 laptop. Combining both
the regions, 65% of the people more likely to pay more for the version 1 laptop.
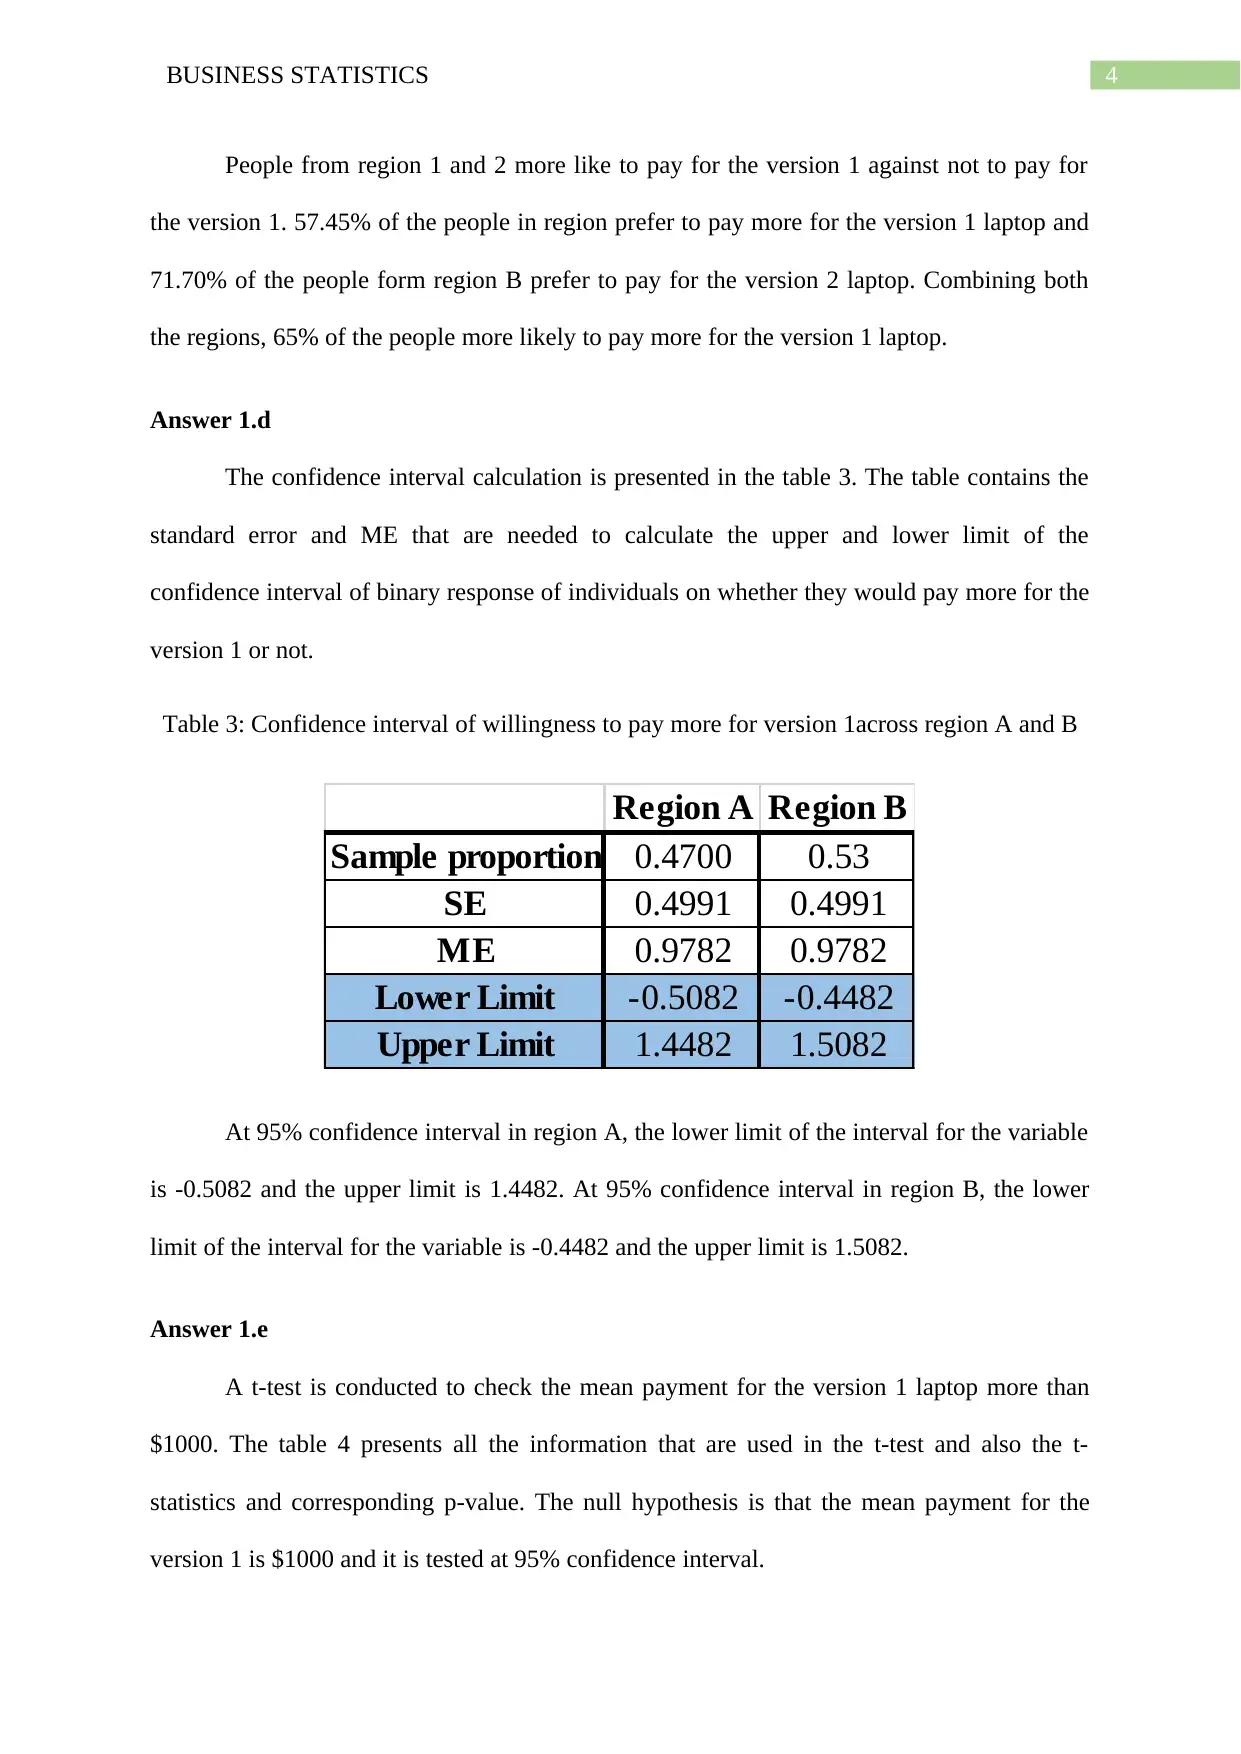
Answer 1.d
The confidence interval calculation is presented in the table 3. The table contains the
standard error and ME that are needed to calculate the upper and lower limit of the
confidence interval of binary response of individuals on whether they would pay more for the
version 1 or not.
Table 3: Confidence interval of willingness to pay more for version 1across region A and B
Region A Region B
Sample proportion 0.4700 0.53
SE 0.4991 0.4991
ME 0.9782 0.9782
Lower Limit -0.5082 -0.4482
Upper Limit 1.4482 1.5082
At 95% confidence interval in region A, the lower limit of the interval for the variable
is -0.5082 and the upper limit is 1.4482. At 95% confidence interval in region B, the lower
limit of the interval for the variable is -0.4482 and the upper limit is 1.5082.
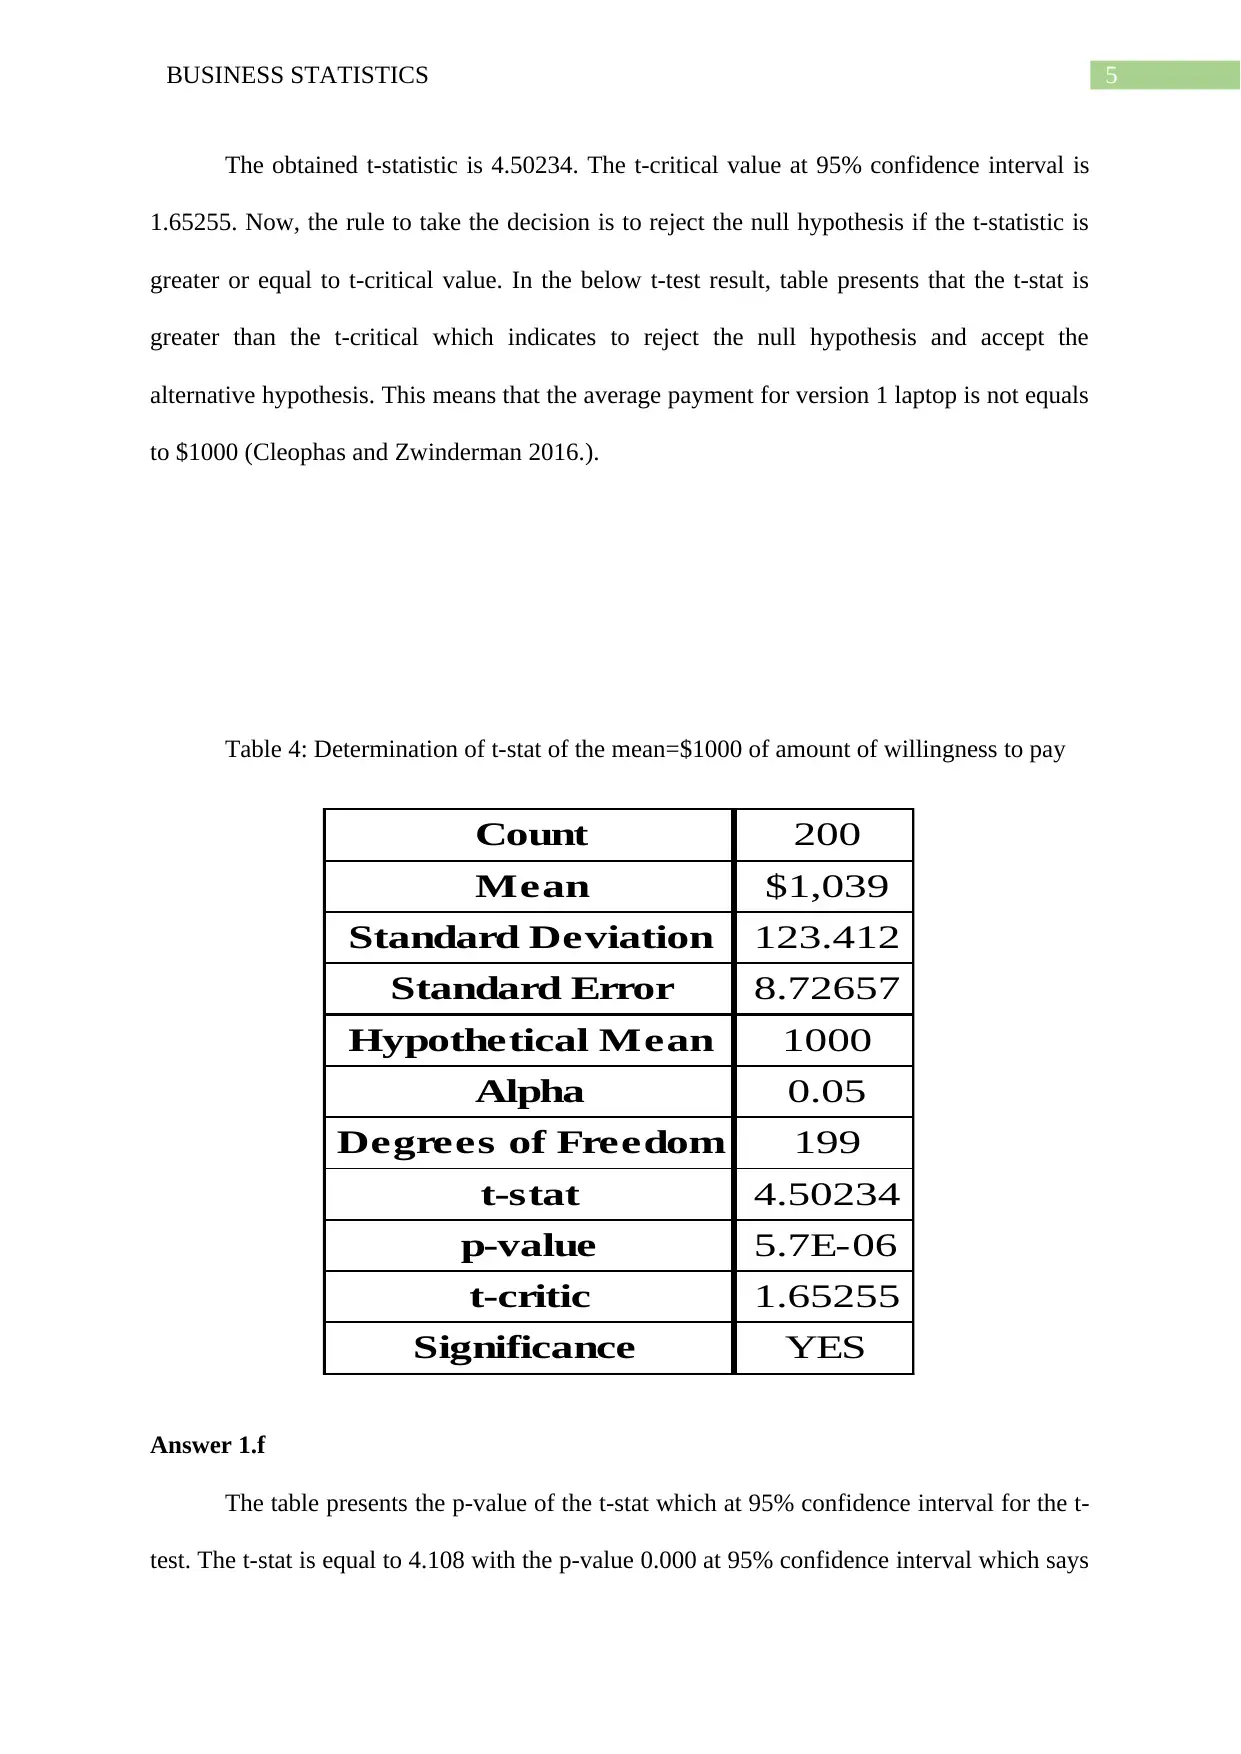
Answer 1.e
A t-test is conducted to check the mean payment for the version 1 laptop more than
$1000. The table 4 presents all the information that are used in the t-test and also the t-
statistics and corresponding p-value. The null hypothesis is that the mean payment for the
version 1 is $1000 and it is tested at 95% confidence interval.
People from region 1 and 2 more like to pay for the version 1 against not to pay for
the version 1. 57.45% of the people in region prefer to pay more for the version 1 laptop and
71.70% of the people form region B prefer to pay for the version 2 laptop. Combining both
the regions, 65% of the people more likely to pay more for the version 1 laptop.
Answer 1.d
The confidence interval calculation is presented in the table 3. The table contains the
standard error and ME that are needed to calculate the upper and lower limit of the
confidence interval of binary response of individuals on whether they would pay more for the
version 1 or not.
Table 3: Confidence interval of willingness to pay more for version 1across region A and B
Region A Region B
Sample proportion 0.4700 0.53
SE 0.4991 0.4991
ME 0.9782 0.9782
Lower Limit -0.5082 -0.4482
Upper Limit 1.4482 1.5082
At 95% confidence interval in region A, the lower limit of the interval for the variable
is -0.5082 and the upper limit is 1.4482. At 95% confidence interval in region B, the lower
limit of the interval for the variable is -0.4482 and the upper limit is 1.5082.
Answer 1.e
A t-test is conducted to check the mean payment for the version 1 laptop more than
$1000. The table 4 presents all the information that are used in the t-test and also the t-
statistics and corresponding p-value. The null hypothesis is that the mean payment for the
version 1 is $1000 and it is tested at 95% confidence interval.
5BUSINESS STATISTICS
The obtained t-statistic is 4.50234. The t-critical value at 95% confidence interval is
1.65255. Now, the rule to take the decision is to reject the null hypothesis if the t-statistic is
greater or equal to t-critical value. In the below t-test result, table presents that the t-stat is
greater than the t-critical which indicates to reject the null hypothesis and accept the
alternative hypothesis. This means that the average payment for version 1 laptop is not equals
to $1000 (Cleophas and Zwinderman 2016.).
Table 4: Determination of t-stat of the mean=$1000 of amount of willingness to pay
Count 200
Mean $1,039
Standard Deviation 123.412
Standard Error 8.72657
Hypothetical Mean 1000
Alpha 0.05
Degrees of Freedom 199
t-stat 4.50234
p-value 5.7E-06
t-critic 1.65255
Significance YES
Answer 1.f
The table presents the p-value of the t-stat which at 95% confidence interval for the t-
test. The t-stat is equal to 4.108 with the p-value 0.000 at 95% confidence interval which says
⊘ This is a preview!⊘
Do you want full access?
Subscribe today to unlock all pages.
Trusted by 1+ million students worldwide
6BUSINESS STATISTICS
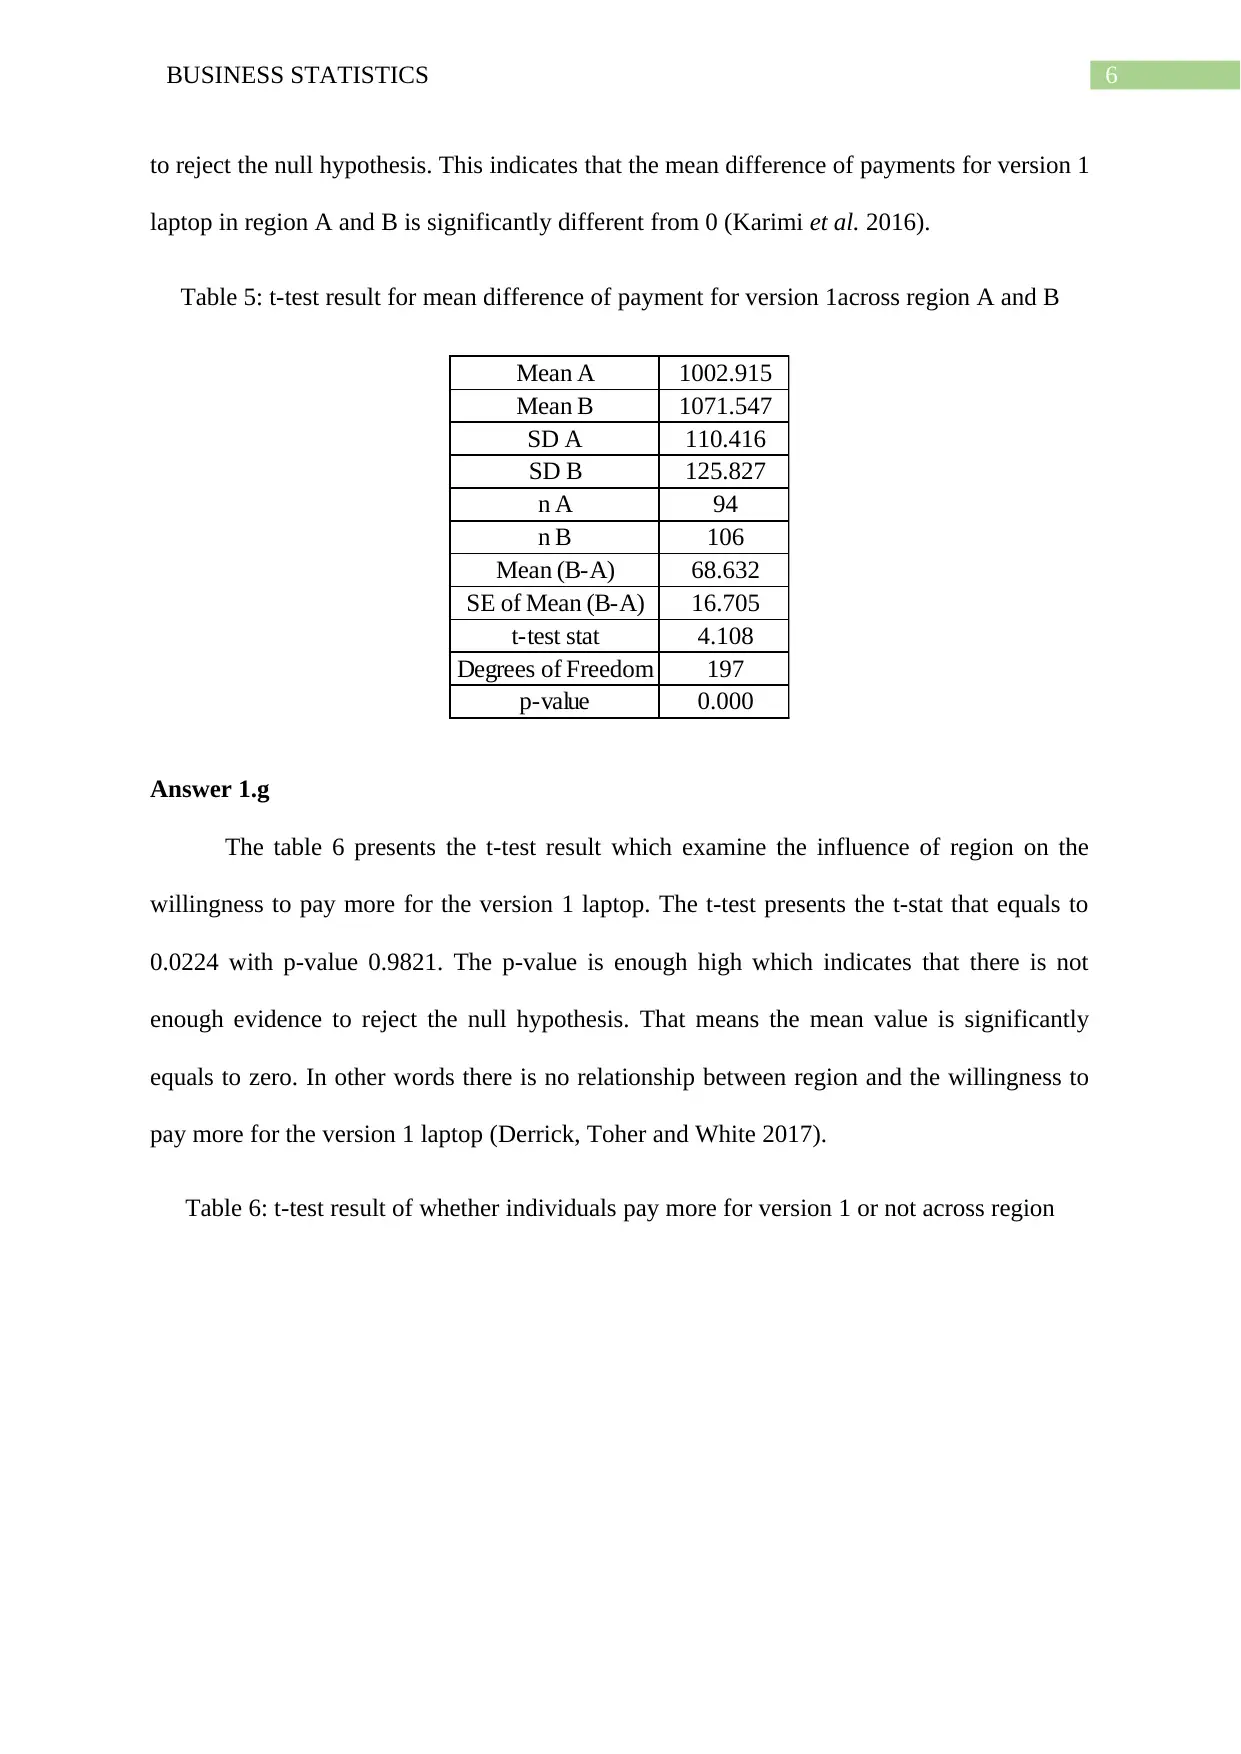
to reject the null hypothesis. This indicates that the mean difference of payments for version 1
laptop in region A and B is significantly different from 0 (Karimi et al. 2016).
Table 5: t-test result for mean difference of payment for version 1across region A and B
Mean A 1002.915
Mean B 1071.547
SD A 110.416
SD B 125.827
n A 94
n B 106
Mean (B-A) 68.632
SE of Mean (B-A) 16.705
t-test stat 4.108
Degrees of Freedom 197
p-value 0.000
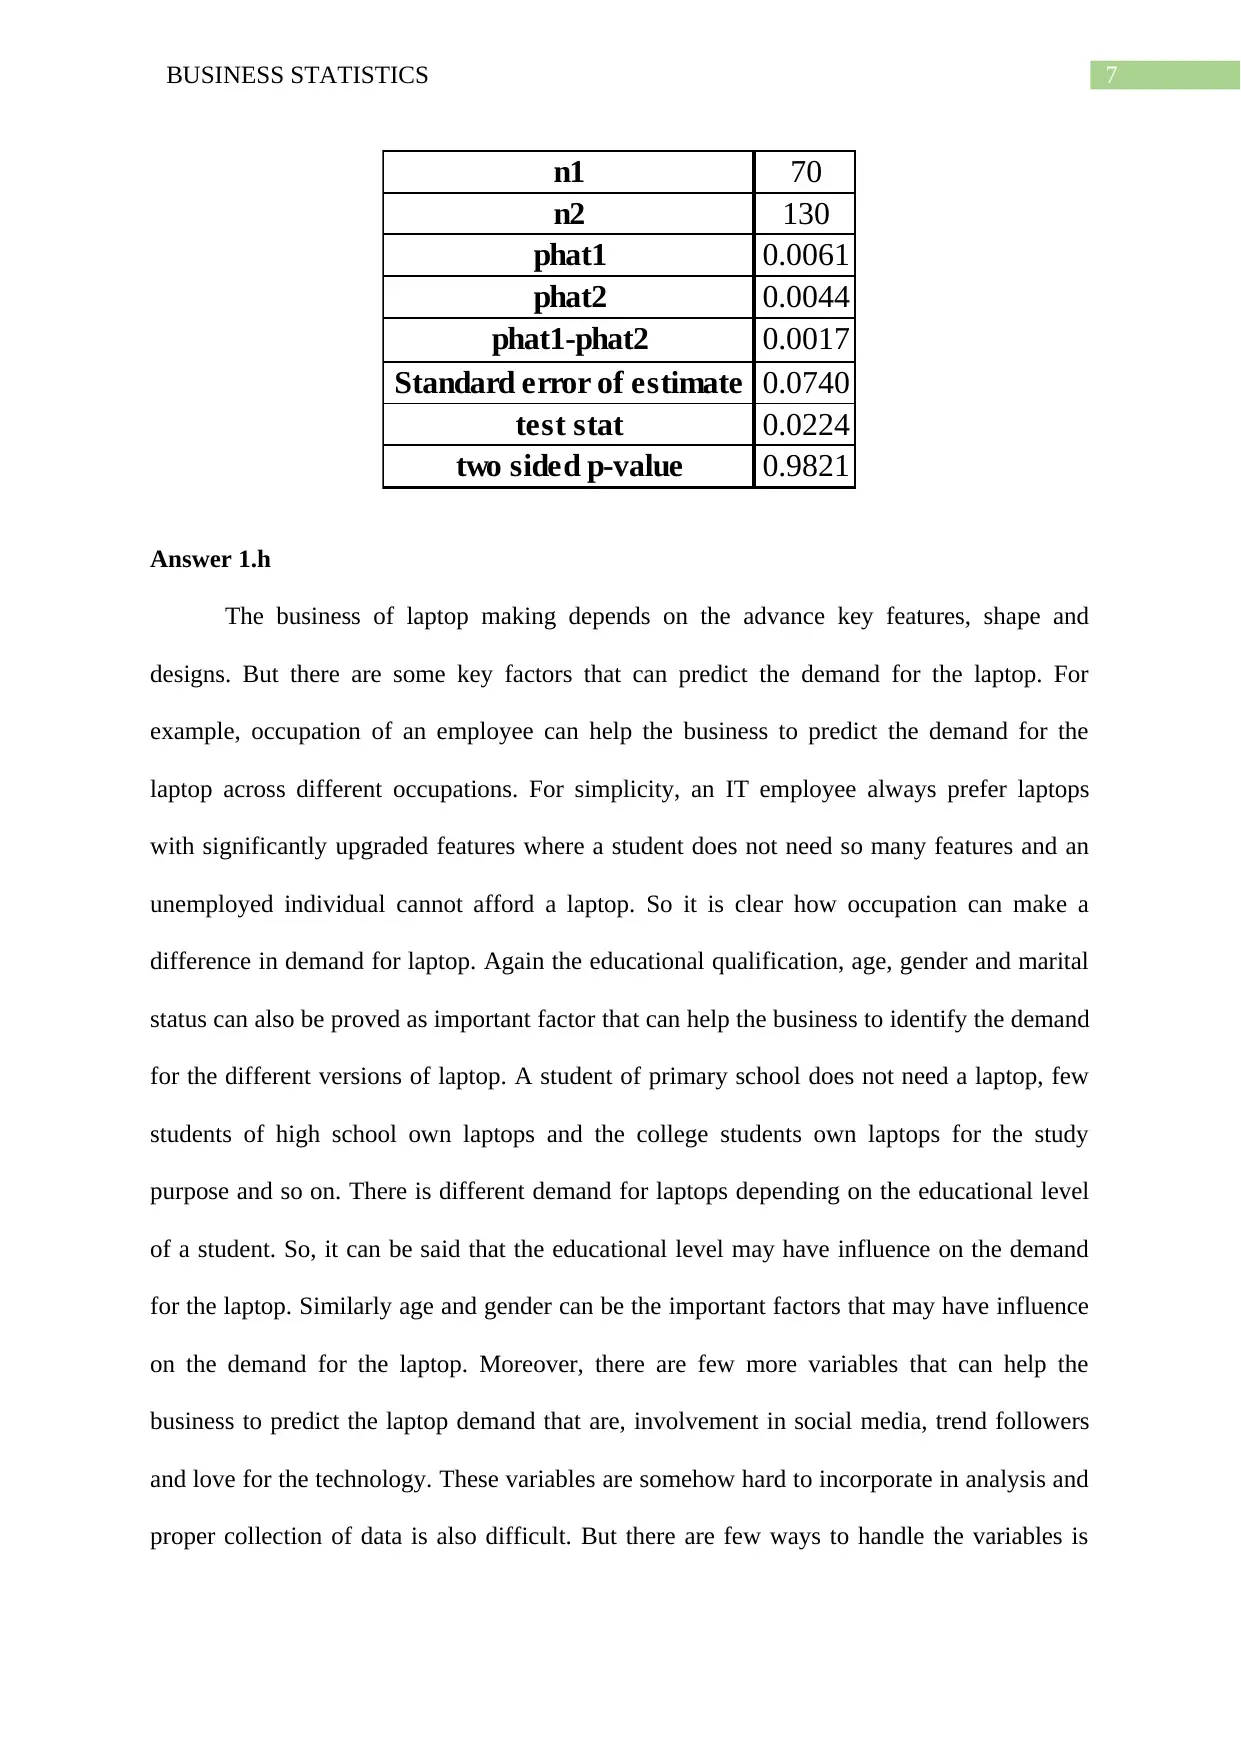
Answer 1.g
The table 6 presents the t-test result which examine the influence of region on the
willingness to pay more for the version 1 laptop. The t-test presents the t-stat that equals to
0.0224 with p-value 0.9821. The p-value is enough high which indicates that there is not
enough evidence to reject the null hypothesis. That means the mean value is significantly
equals to zero. In other words there is no relationship between region and the willingness to
pay more for the version 1 laptop (Derrick, Toher and White 2017).
Table 6: t-test result of whether individuals pay more for version 1 or not across region
to reject the null hypothesis. This indicates that the mean difference of payments for version 1
laptop in region A and B is significantly different from 0 (Karimi et al. 2016).
Table 5: t-test result for mean difference of payment for version 1across region A and B
Mean A 1002.915
Mean B 1071.547
SD A 110.416
SD B 125.827
n A 94
n B 106
Mean (B-A) 68.632
SE of Mean (B-A) 16.705
t-test stat 4.108
Degrees of Freedom 197
p-value 0.000
Answer 1.g
The table 6 presents the t-test result which examine the influence of region on the
willingness to pay more for the version 1 laptop. The t-test presents the t-stat that equals to
0.0224 with p-value 0.9821. The p-value is enough high which indicates that there is not
enough evidence to reject the null hypothesis. That means the mean value is significantly
equals to zero. In other words there is no relationship between region and the willingness to
pay more for the version 1 laptop (Derrick, Toher and White 2017).
Table 6: t-test result of whether individuals pay more for version 1 or not across region
Paraphrase This Document
Need a fresh take? Get an instant paraphrase of this document with our AI Paraphraser
7BUSINESS STATISTICS
n1 70
n2 130
phat1 0.0061
phat2 0.0044
phat1-phat2 0.0017
Standard error of estimate 0.0740
test stat 0.0224
two sided p-value 0.9821
Answer 1.h
The business of laptop making depends on the advance key features, shape and
designs. But there are some key factors that can predict the demand for the laptop. For
example, occupation of an employee can help the business to predict the demand for the
laptop across different occupations. For simplicity, an IT employee always prefer laptops
with significantly upgraded features where a student does not need so many features and an
unemployed individual cannot afford a laptop. So it is clear how occupation can make a
difference in demand for laptop. Again the educational qualification, age, gender and marital
status can also be proved as important factor that can help the business to identify the demand
for the different versions of laptop. A student of primary school does not need a laptop, few
students of high school own laptops and the college students own laptops for the study
purpose and so on. There is different demand for laptops depending on the educational level
of a student. So, it can be said that the educational level may have influence on the demand
for the laptop. Similarly age and gender can be the important factors that may have influence
on the demand for the laptop. Moreover, there are few more variables that can help the
business to predict the laptop demand that are, involvement in social media, trend followers
and love for the technology. These variables are somehow hard to incorporate in analysis and
proper collection of data is also difficult. But there are few ways to handle the variables is
8BUSINESS STATISTICS
like the variable for social media involvement will be the “number of social media platform
that has been used regularly by the individual”. This is a numerical value which can be
handled easily in any model.
Answer 1.i
A lurking variable is an explanatory variable which increases the fitness of the model
by raising the R2 value but the coefficient of the variable is insignificant in the model. Thus,
normally the variable is not incorporated in the model but it has significant effect in
interpretation of relation within the variables (Wu, You and Zou 2016). The variable is
enough strong to show a strong relationship and also can remove the significant relation
among the variables. This is how the lurking variable is able to change the outcome and the
interpretation of an analysis. These variables needs to be considered in the model or omitted
from the model to make the model better fit (del Rosario, Lee and Iaccarino 2019). There are
few ways to control the variable effect. These are mentioned below:
Removal of the lurking variables from the analysis.
Incorporation of the variable in the analysis as constants.
Proper inclusion of the variable in the analysis.
The identification is of lurking variable is quite difficult but there are few ways that can
be proved very helpful. The lurking variables cane be identified by the error terms, nature of
variables and plots to identify non-linear trends and incorporating the interaction variable.
Answer 1.j
The individuals from region B are more likely to pay more for version 1 laptop as the
average payment for version 1 laptop in region B is higher than the average payment for
version 1 laptop in region A. The average payment for version 1 laptop in region B is
$1071.55 while the average payment for the same version in region A is $1002.91. Most of
⊘ This is a preview!⊘
Do you want full access?
Subscribe today to unlock all pages.
Trusted by 1+ million students worldwide
9BUSINESS STATISTICS
the people from region A and B wants to pay more for version 1 laptop. 65% of the people
from region A and B prefer to pay more for version 1. Most important is that the region is not
able to influence the people to pay more for the version 1 laptop. The t-stat is not less than the
t-critical value at 95% confidence interval which is recorded in the corresponding t-test.
However, there are more variables that can influence the demand for version 1 laptop that are
age, gender, educational qualification, occupation and involvement in social media. The
educational qualification or the involvement in social media can influence the demand for the
laptop positively. In further studies on this topic needs to take care of lurking variables. The
lurking variables can influence the result in a wrong way. So, this variable needs to be
identified and removed from the model or incorporated in a proper way.
Paraphrase This Document
Need a fresh take? Get an instant paraphrase of this document with our AI Paraphraser
10BUSINESS STATISTICS
Reference
del Rosario, Z., Lee, M. and Iaccarino, G., 2019. Lurking Variable Detection via Dimensional
Analysis. SIAM/ASA Journal on Uncertainty Quantification, 7(1), pp.232-259.
Wu, M., You, P. and Zou, N., 2016. On spurious regressions with trending variables. arXiv
preprint arXiv:1606.05049.
Karimi, S., Biemans, H.J., Lans, T., Chizari, M. and Mulder, M., 2016. The impact of
entrepreneurship education: A study of Iranian students' entrepreneurial intentions and
opportunity identification. Journal of Small Business Management, 54(1), pp.187-209.
Derrick, B., Russ, B., Toher, D. and White, P., 2017. Test statistics for the comparison of
means for two samples that include both paired and independent observations. Journal of
Modern Applied Statistical Methods, 16(1), p.9.
Cleophas, T.J. and Zwinderman, A.H., 2016. Paired Continuous Data (Paired T-Test,
Wilcoxon Signed Rank Test, 10 Patients). In SPSS for Starters and 2nd Levelers (pp. 7-10).
Springer, Cham.
1 out of 11
Related Documents


Your All-in-One AI-Powered Toolkit for Academic Success.
+13062052269
info@desklib.com
Available 24*7 on WhatsApp / Email
![[object Object]](/_next/static/media/star-bottom.7253800d.svg)
Unlock your academic potential
Copyright © 2020–2026 A2Z Services. All Rights Reserved. Developed and managed by ZUCOL.