Basic Business Statistics Assignment: Spring 2020 Problems
VerifiedAdded on 2022/07/28
|12
|2266
|40
Homework Assignment
AI Summary
This document presents a comprehensive solution to a business statistics assignment. It includes solutions to multiple-choice questions covering foundational concepts like hypothesis testing, distributions, and sampling methods. The problem section delves into practical applications, such as chi-square tests for proportions, linear programming model formulation, and the calculation and interpretation of confidence intervals. Furthermore, the assignment addresses hypothesis testing using both z- and t-distributions, including paired sample tests. Regression analysis is explored, with interpretations of correlation coefficients and the development of regression equations. Finally, the assignment covers decision-making under uncertainty using payoff tables (Maximin and EMV) and ANOVA tests for comparing the reactions of different groups.

Basic Business Statistics:
Student Name:
Instructor Name:
Course Number:
17th April 2020
Student Name:
Instructor Name:
Course Number:
17th April 2020
Paraphrase This Document
Need a fresh take? Get an instant paraphrase of this document with our AI Paraphraser
PART A – Multiple Choice (1 mark per question) Please circle your answer on the test
paper
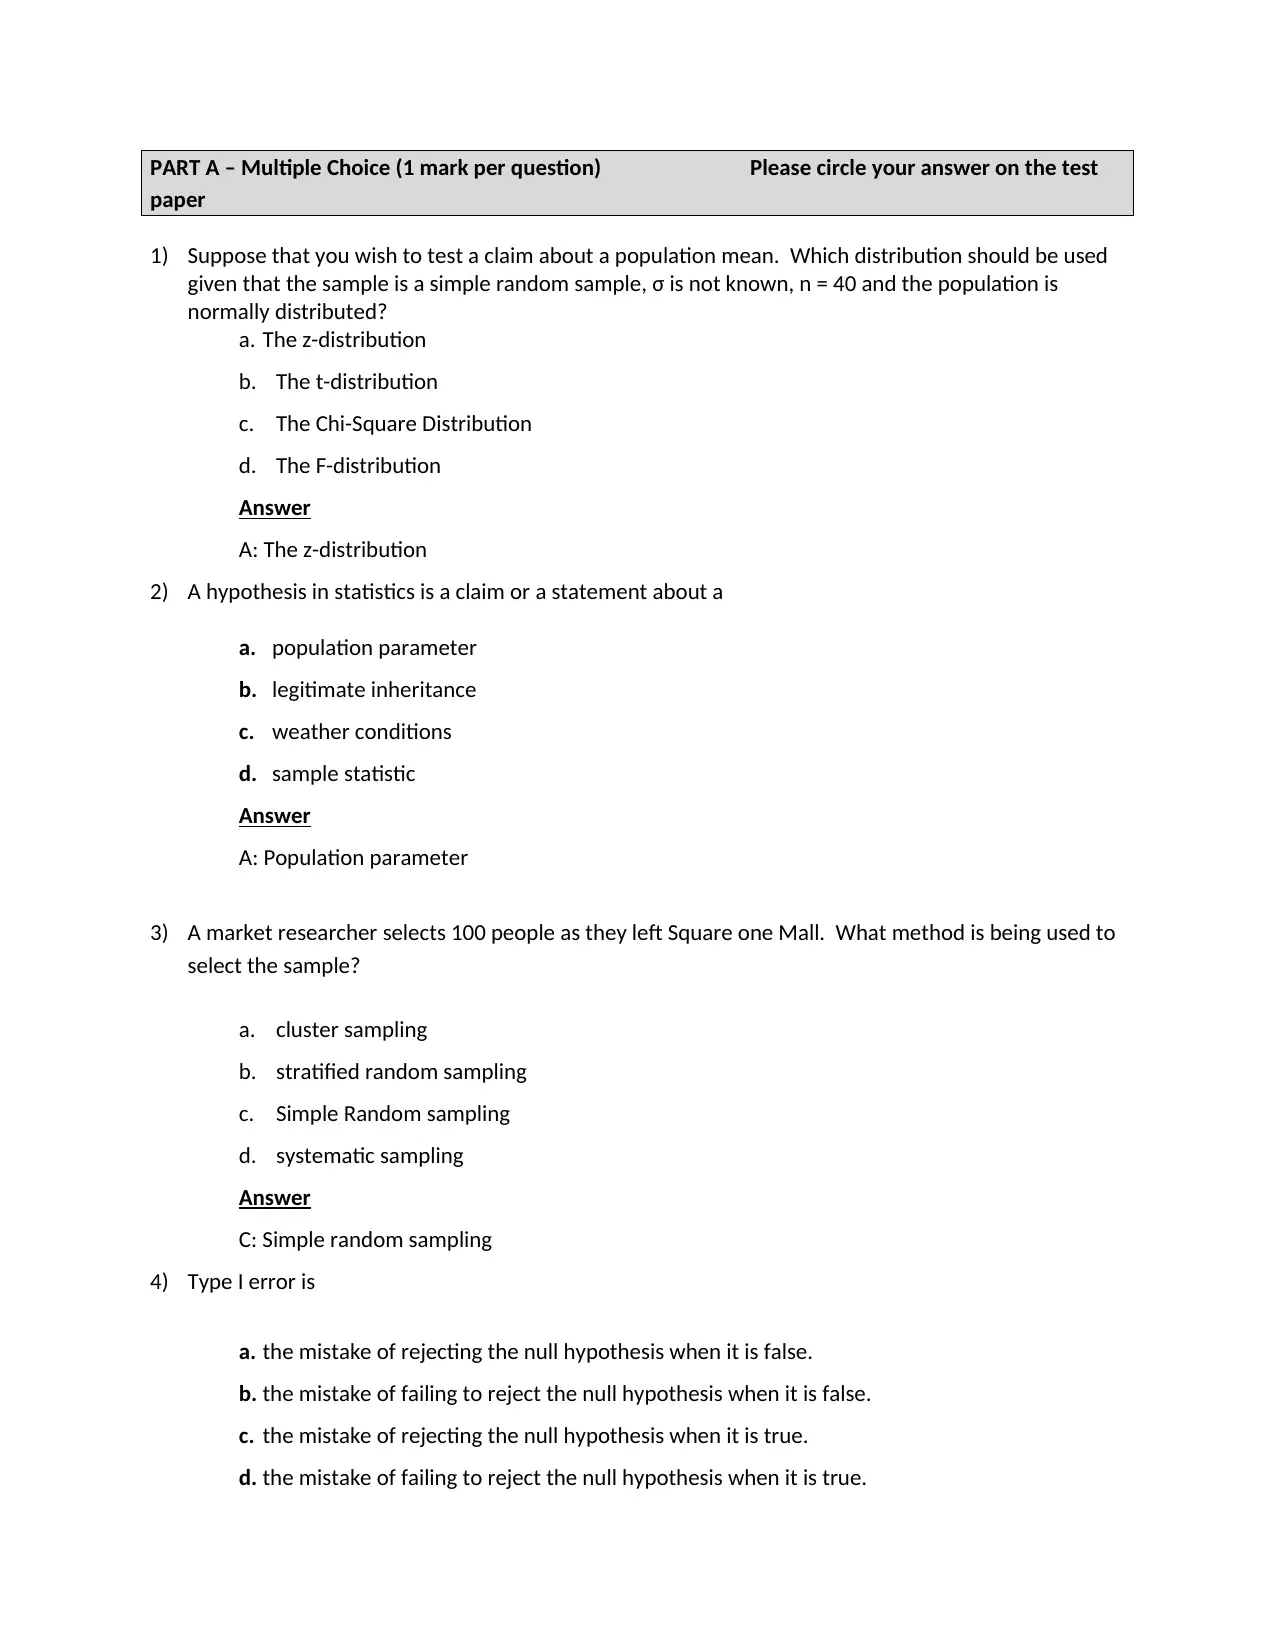
1) Suppose that you wish to test a claim about a population mean. Which distribution should be used
given that the sample is a simple random sample, σ is not known, n = 40 and the population is
normally distributed?
a. The z-distribution
b. The t-distribution
c. The Chi-Square Distribution
d. The F-distribution
Answer
A: The z-distribution
2) A hypothesis in statistics is a claim or a statement about a
a. population parameter
b. legitimate inheritance
c. weather conditions
d. sample statistic
Answer
A: Population parameter
3) A market researcher selects 100 people as they left Square one Mall. What method is being used to
select the sample?
a. cluster sampling
b. stratified random sampling
c. Simple Random sampling
d. systematic sampling
Answer
C: Simple random sampling
4) Type I error is
a. the mistake of rejecting the null hypothesis when it is false.
b. the mistake of failing to reject the null hypothesis when it is false.
c. the mistake of rejecting the null hypothesis when it is true.
d. the mistake of failing to reject the null hypothesis when it is true.
paper
1) Suppose that you wish to test a claim about a population mean. Which distribution should be used
given that the sample is a simple random sample, σ is not known, n = 40 and the population is
normally distributed?
a. The z-distribution
b. The t-distribution
c. The Chi-Square Distribution
d. The F-distribution
Answer
A: The z-distribution
2) A hypothesis in statistics is a claim or a statement about a
a. population parameter
b. legitimate inheritance
c. weather conditions
d. sample statistic
Answer
A: Population parameter
3) A market researcher selects 100 people as they left Square one Mall. What method is being used to
select the sample?
a. cluster sampling
b. stratified random sampling
c. Simple Random sampling
d. systematic sampling
Answer
C: Simple random sampling
4) Type I error is
a. the mistake of rejecting the null hypothesis when it is false.
b. the mistake of failing to reject the null hypothesis when it is false.
c. the mistake of rejecting the null hypothesis when it is true.
d. the mistake of failing to reject the null hypothesis when it is true.
Answer
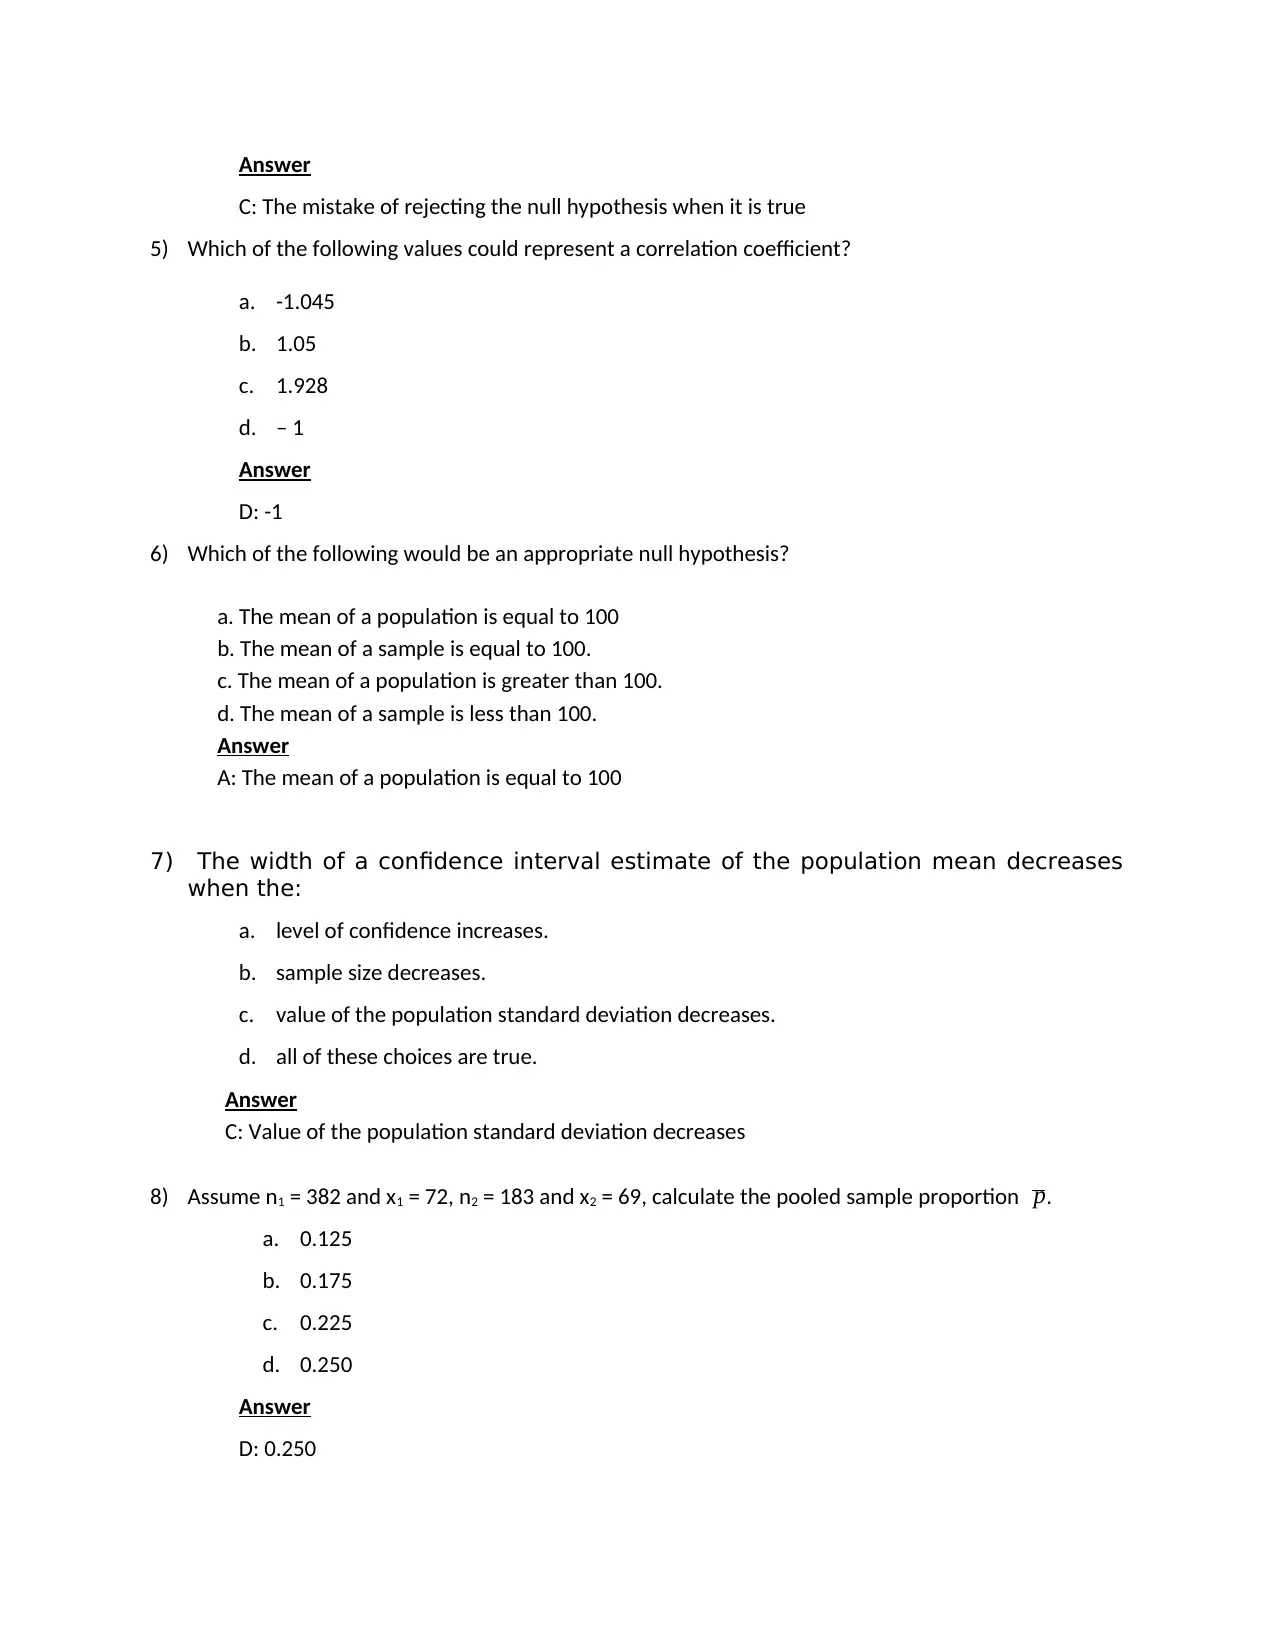
C: The mistake of rejecting the null hypothesis when it is true
5) Which of the following values could represent a correlation coefficient?
a. -1.045
b. 1.05
c. 1.928
d. – 1
Answer
D: -1
6) Which of the following would be an appropriate null hypothesis?
a. The mean of a population is equal to 100
b. The mean of a sample is equal to 100.
c. The mean of a population is greater than 100.
d. The mean of a sample is less than 100.
Answer
A: The mean of a population is equal to 100
7) The width of a confidence interval estimate of the population mean decreases
when the:
a. level of confidence increases.
b. sample size decreases.
c. value of the population standard deviation decreases.
d. all of these choices are true.
Answer
C: Value of the population standard deviation decreases
8) Assume n1 = 382 and x1 = 72, n2 = 183 and x2 = 69, calculate the pooled sample proportion p.
a. 0.125
b. 0.175
c. 0.225
d. 0.250
Answer
D: 0.250
⊘ This is a preview!⊘
Do you want full access?
Subscribe today to unlock all pages.
Trusted by 1+ million students worldwide
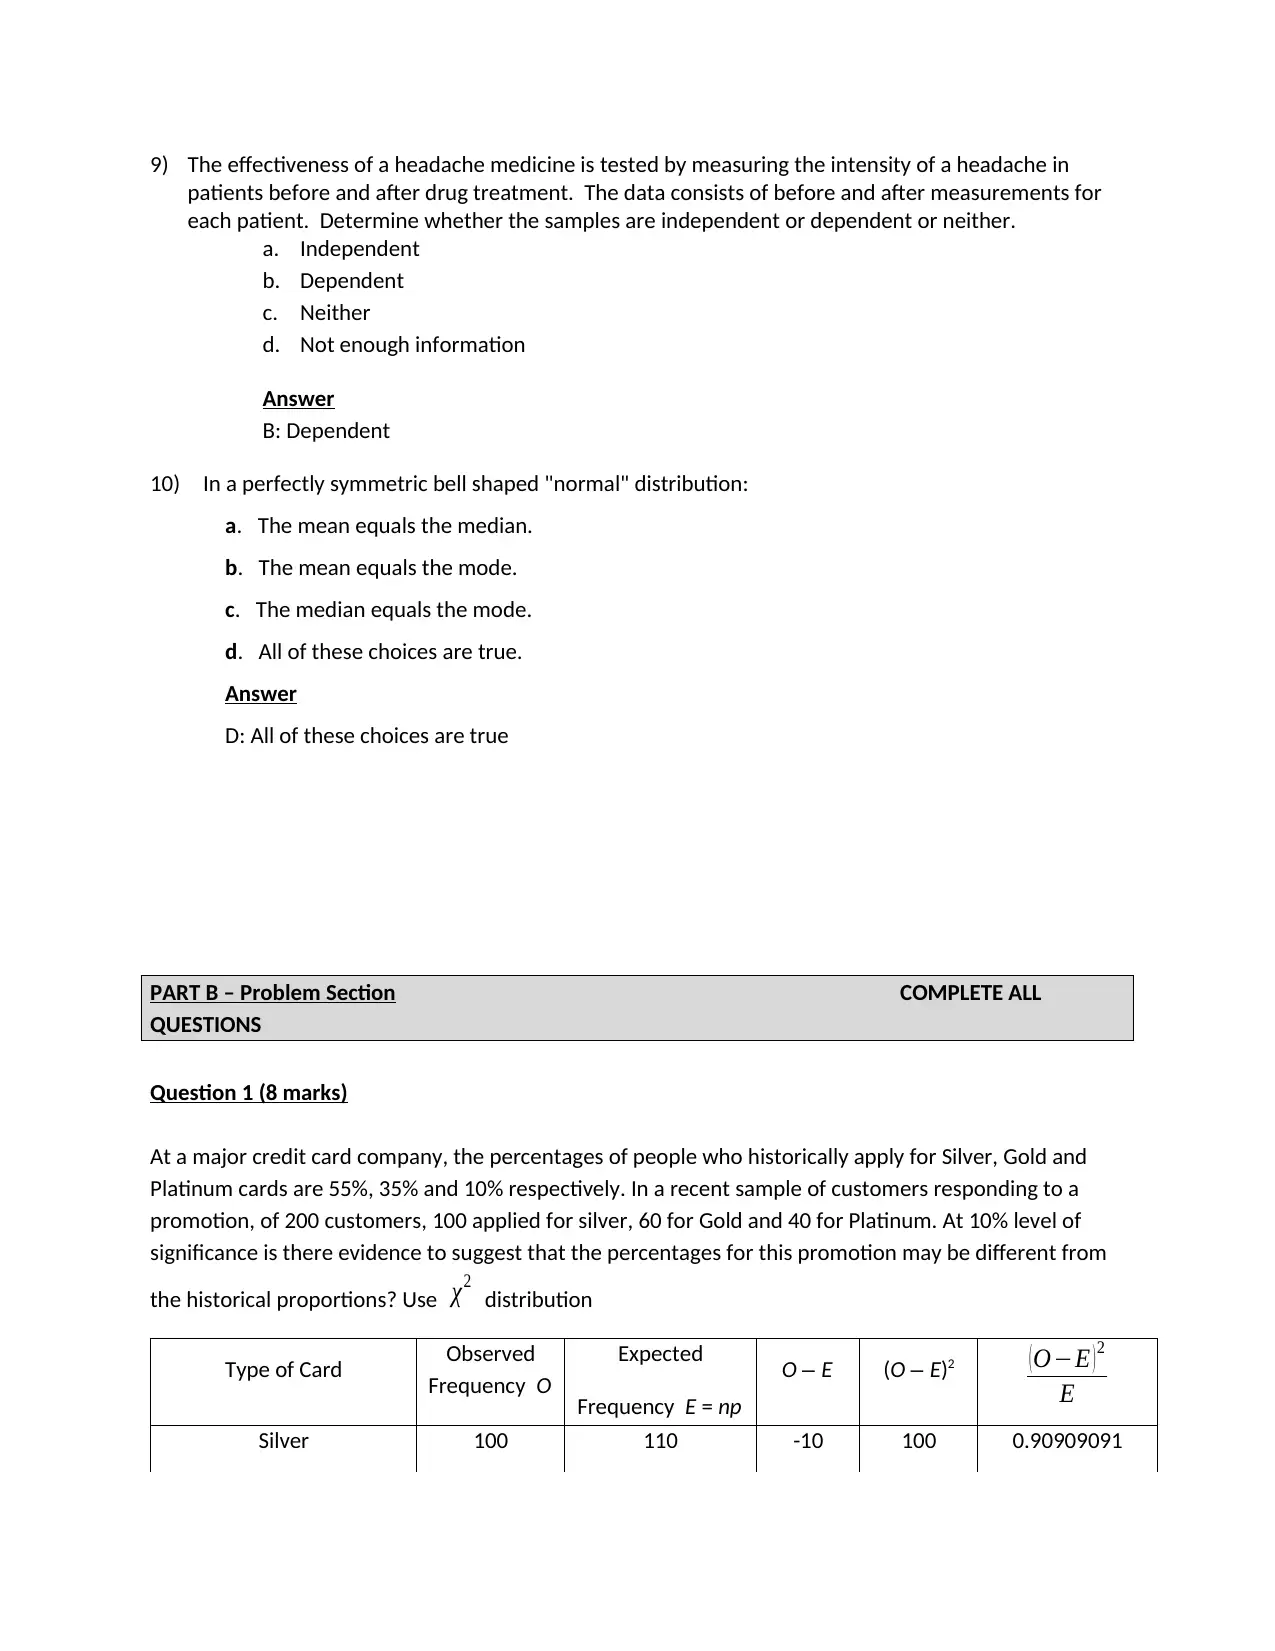
9) The effectiveness of a headache medicine is tested by measuring the intensity of a headache in
patients before and after drug treatment. The data consists of before and after measurements for
each patient. Determine whether the samples are independent or dependent or neither.
a. Independent
b. Dependent
c. Neither
d. Not enough information
Answer
B: Dependent
10) In a perfectly symmetric bell shaped "normal" distribution:
a. The mean equals the median.
b. The mean equals the mode.
c. The median equals the mode.
d. All of these choices are true.
Answer
D: All of these choices are true
PART B – Problem Section COMPLETE ALL
QUESTIONS
Question 1 (8 marks)
At a major credit card company, the percentages of people who historically apply for Silver, Gold and
Platinum cards are 55%, 35% and 10% respectively. In a recent sample of customers responding to a
promotion, of 200 customers, 100 applied for silver, 60 for Gold and 40 for Platinum. At 10% level of
significance is there evidence to suggest that the percentages for this promotion may be different from
the historical proportions? Use χ2
distribution
Type of Card Observed
Frequency O
Expected
Frequency E = np
O – E (O – E)2 ( O−E ) 2
E
Silver 100 110 -10 100 0.90909091
Paraphrase This Document
Need a fresh take? Get an instant paraphrase of this document with our AI Paraphraser
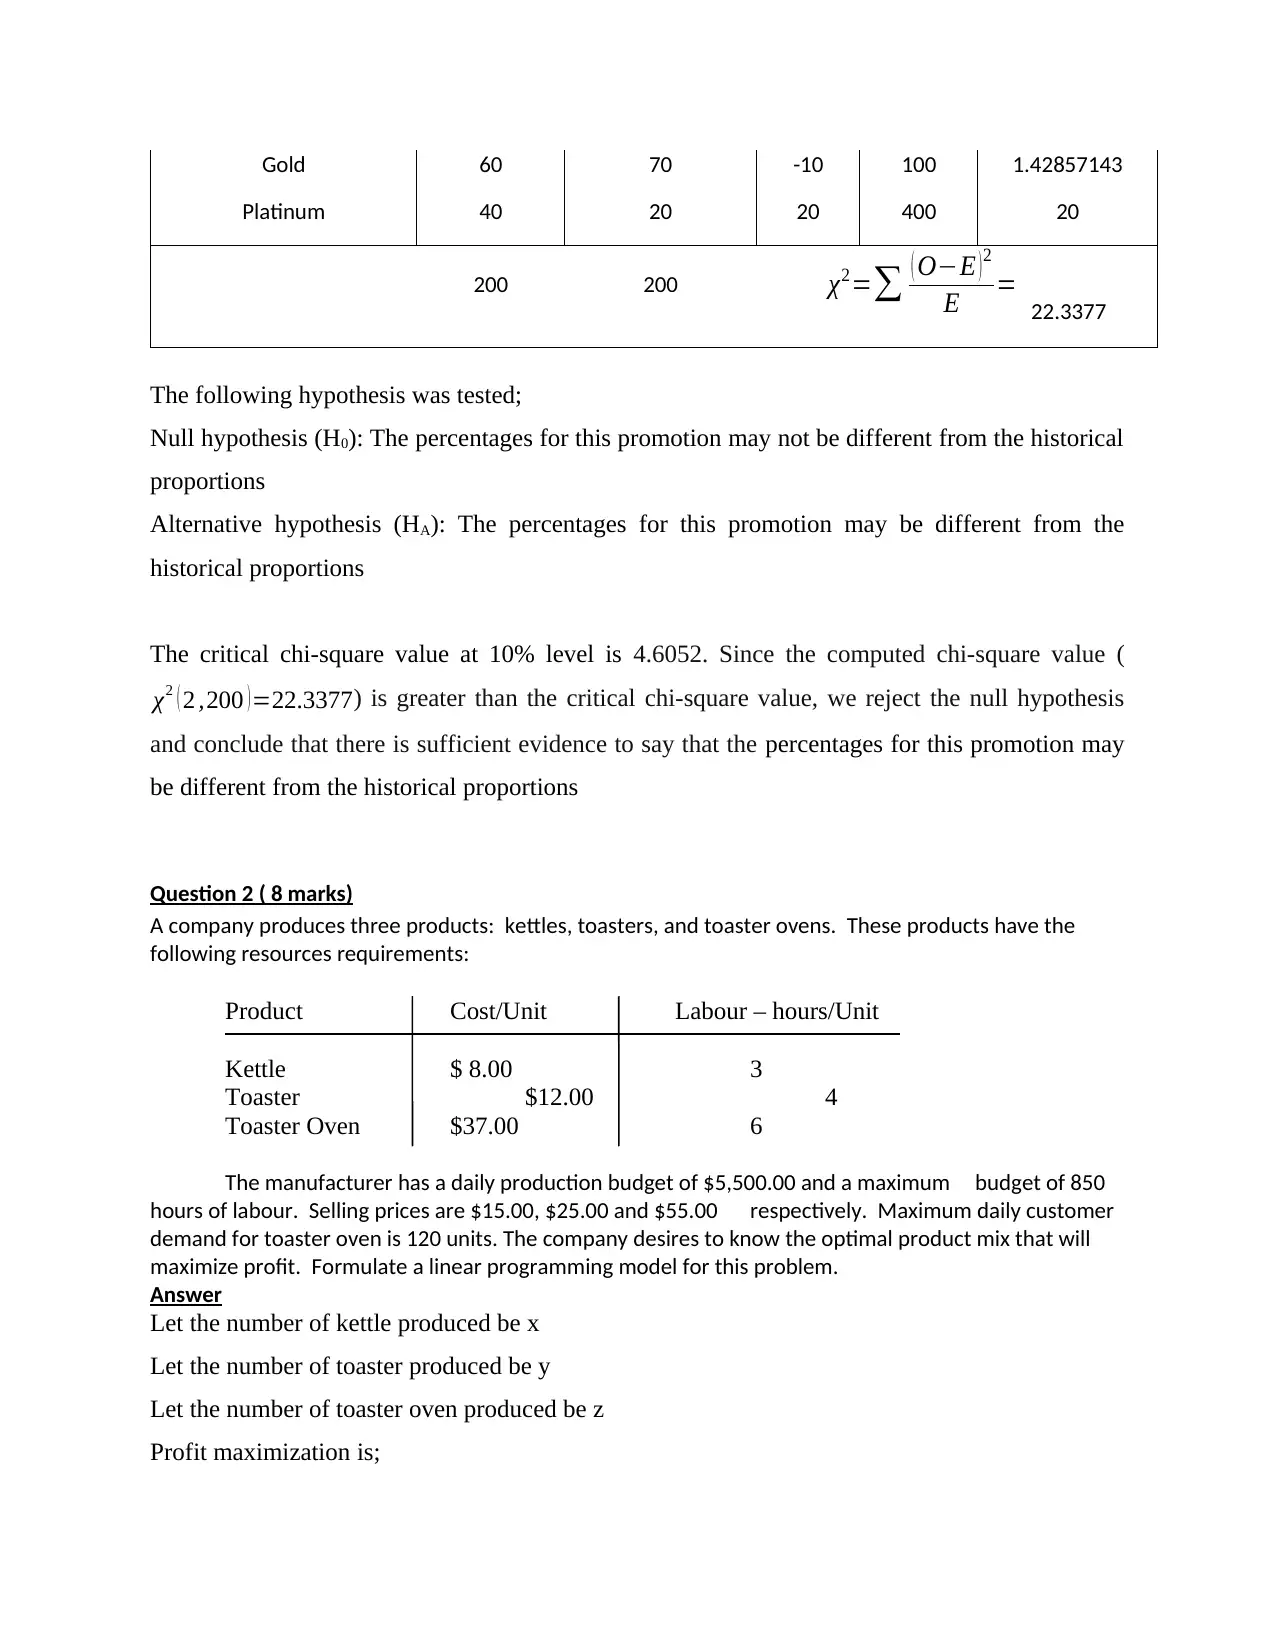
Gold 60 70 -10 100 1.42857143
Platinum 40 20 20 400 20
200 200 χ2=∑ ( O−E ) 2
E = 22.3377
The following hypothesis was tested;
Null hypothesis (H0): The percentages for this promotion may not be different from the historical
proportions
Alternative hypothesis (HA): The percentages for this promotion may be different from the
historical proportions
The critical chi-square value at 10% level is 4.6052. Since the computed chi-square value (
χ2 ( 2 ,200 )=22.3377) is greater than the critical chi-square value, we reject the null hypothesis
and conclude that there is sufficient evidence to say that the percentages for this promotion may
be different from the historical proportions
Question 2 ( 8 marks)
A company produces three products: kettles, toasters, and toaster ovens. These products have the
following resources requirements:
Product Cost/Unit Labour – hours/Unit
Kettle $ 8.00 3
Toaster $12.00 4
Toaster Oven $37.00 6
The manufacturer has a daily production budget of $5,500.00 and a maximum budget of 850
hours of labour. Selling prices are $15.00, $25.00 and $55.00 respectively. Maximum daily customer
demand for toaster oven is 120 units. The company desires to know the optimal product mix that will
maximize profit. Formulate a linear programming model for this problem.
Answer
Let the number of kettle produced be x
Let the number of toaster produced be y
Let the number of toaster oven produced be z
Profit maximization is;
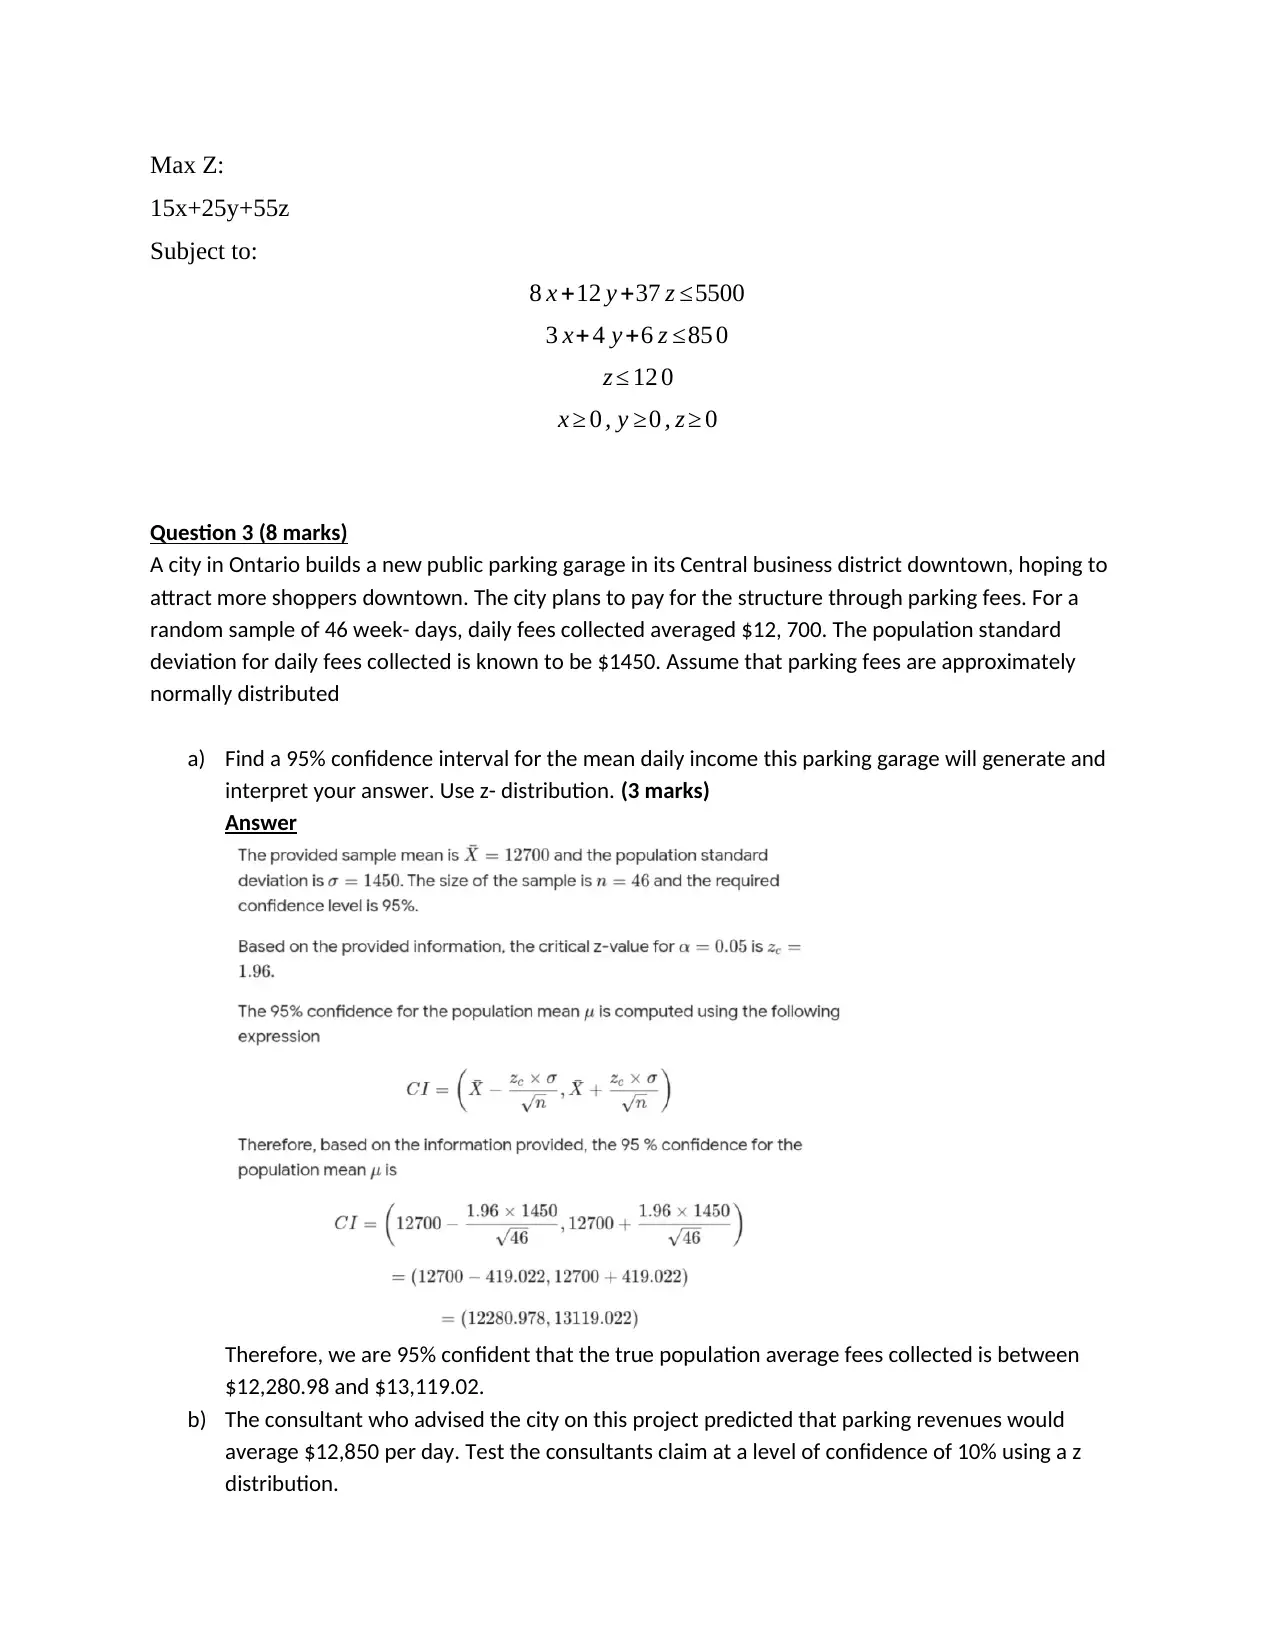
Max Z:
15x+25y+55z
Subject to:
8 x +12 y +37 z ≤5500
3 x+4 y +6 z ≤85 0
z ≤ 12 0
x ≥ 0 , y ≥0 , z ≥ 0
Question 3 (8 marks)
A city in Ontario builds a new public parking garage in its Central business district downtown, hoping to
attract more shoppers downtown. The city plans to pay for the structure through parking fees. For a
random sample of 46 week- days, daily fees collected averaged $12, 700. The population standard
deviation for daily fees collected is known to be $1450. Assume that parking fees are approximately
normally distributed
a) Find a 95% confidence interval for the mean daily income this parking garage will generate and
interpret your answer. Use z- distribution. (3 marks)
Answer
Therefore, we are 95% confident that the true population average fees collected is between
$12,280.98 and $13,119.02.
b) The consultant who advised the city on this project predicted that parking revenues would
average $12,850 per day. Test the consultants claim at a level of confidence of 10% using a z
distribution.
⊘ This is a preview!⊘
Do you want full access?
Subscribe today to unlock all pages.
Trusted by 1+ million students worldwide
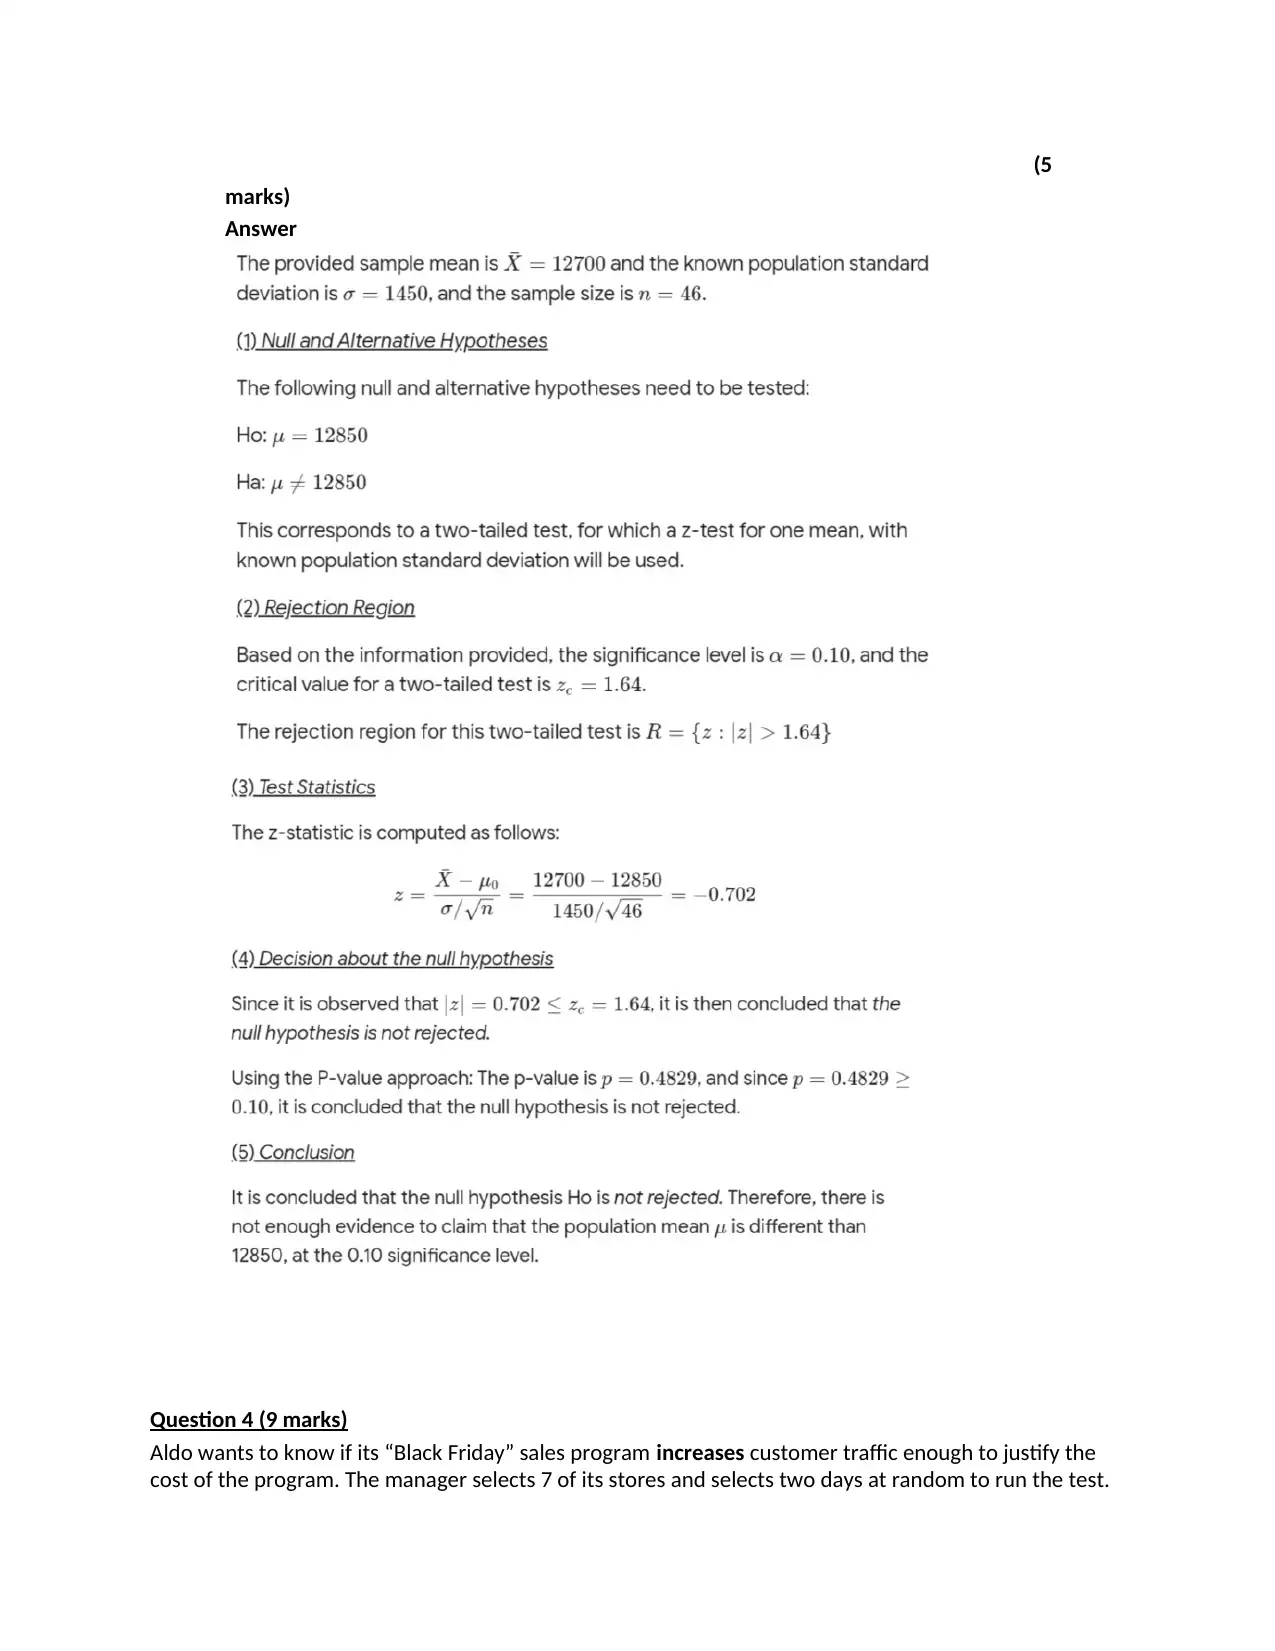
(5
marks)
Answer
Question 4 (9 marks)
Aldo wants to know if its “Black Friday” sales program increases customer traffic enough to justify the
cost of the program. The manager selects 7 of its stores and selects two days at random to run the test.
marks)
Answer
Question 4 (9 marks)
Aldo wants to know if its “Black Friday” sales program increases customer traffic enough to justify the
cost of the program. The manager selects 7 of its stores and selects two days at random to run the test.
Paraphrase This Document
Need a fresh take? Get an instant paraphrase of this document with our AI Paraphraser
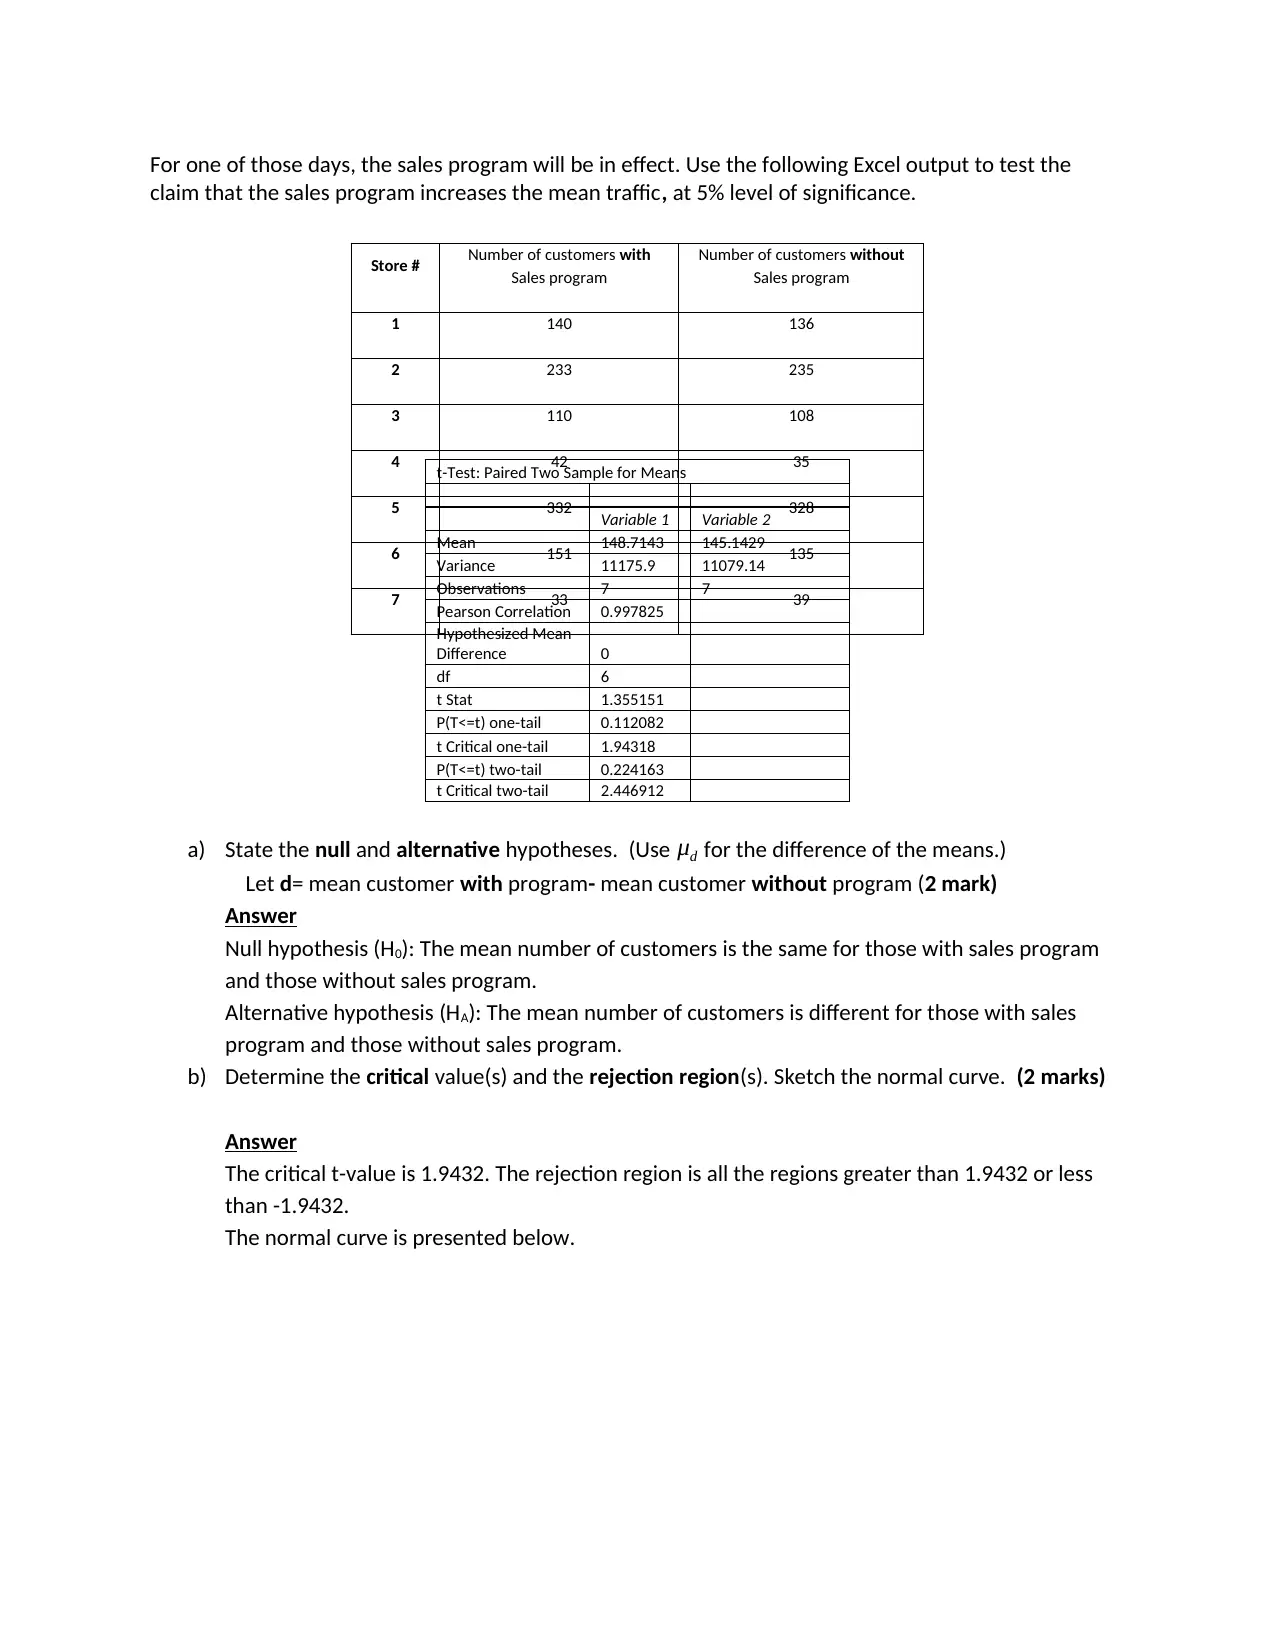
For one of those days, the sales program will be in effect. Use the following Excel output to test the
claim that the sales program increases the mean traffic, at 5% level of significance.
t-Test: Paired Two Sample for Means
Variable 1 Variable 2
Mean 148.7143 145.1429
Variance 11175.9 11079.14
Observations 7 7
Pearson Correlation 0.997825
Hypothesized Mean
Difference 0
df 6
t Stat 1.355151
P(T<=t) one-tail 0.112082
t Critical one-tail 1.94318
P(T<=t) two-tail 0.224163
t Critical two-tail 2.446912
a) State the null and alternative hypotheses. (Use μd for the difference of the means.)
Let d= mean customer with program- mean customer without program (2 mark)
Answer
Null hypothesis (H0): The mean number of customers is the same for those with sales program
and those without sales program.
Alternative hypothesis (HA): The mean number of customers is different for those with sales
program and those without sales program.
b) Determine the critical value(s) and the rejection region(s). Sketch the normal curve. (2 marks)
Answer
The critical t-value is 1.9432. The rejection region is all the regions greater than 1.9432 or less
than -1.9432.
The normal curve is presented below.
Store # Number of customers with
Sales program
Number of customers without
Sales program
1 140 136
2 233 235
3 110 108
4 42 35
5 332 328
6 151 135
7 33 39
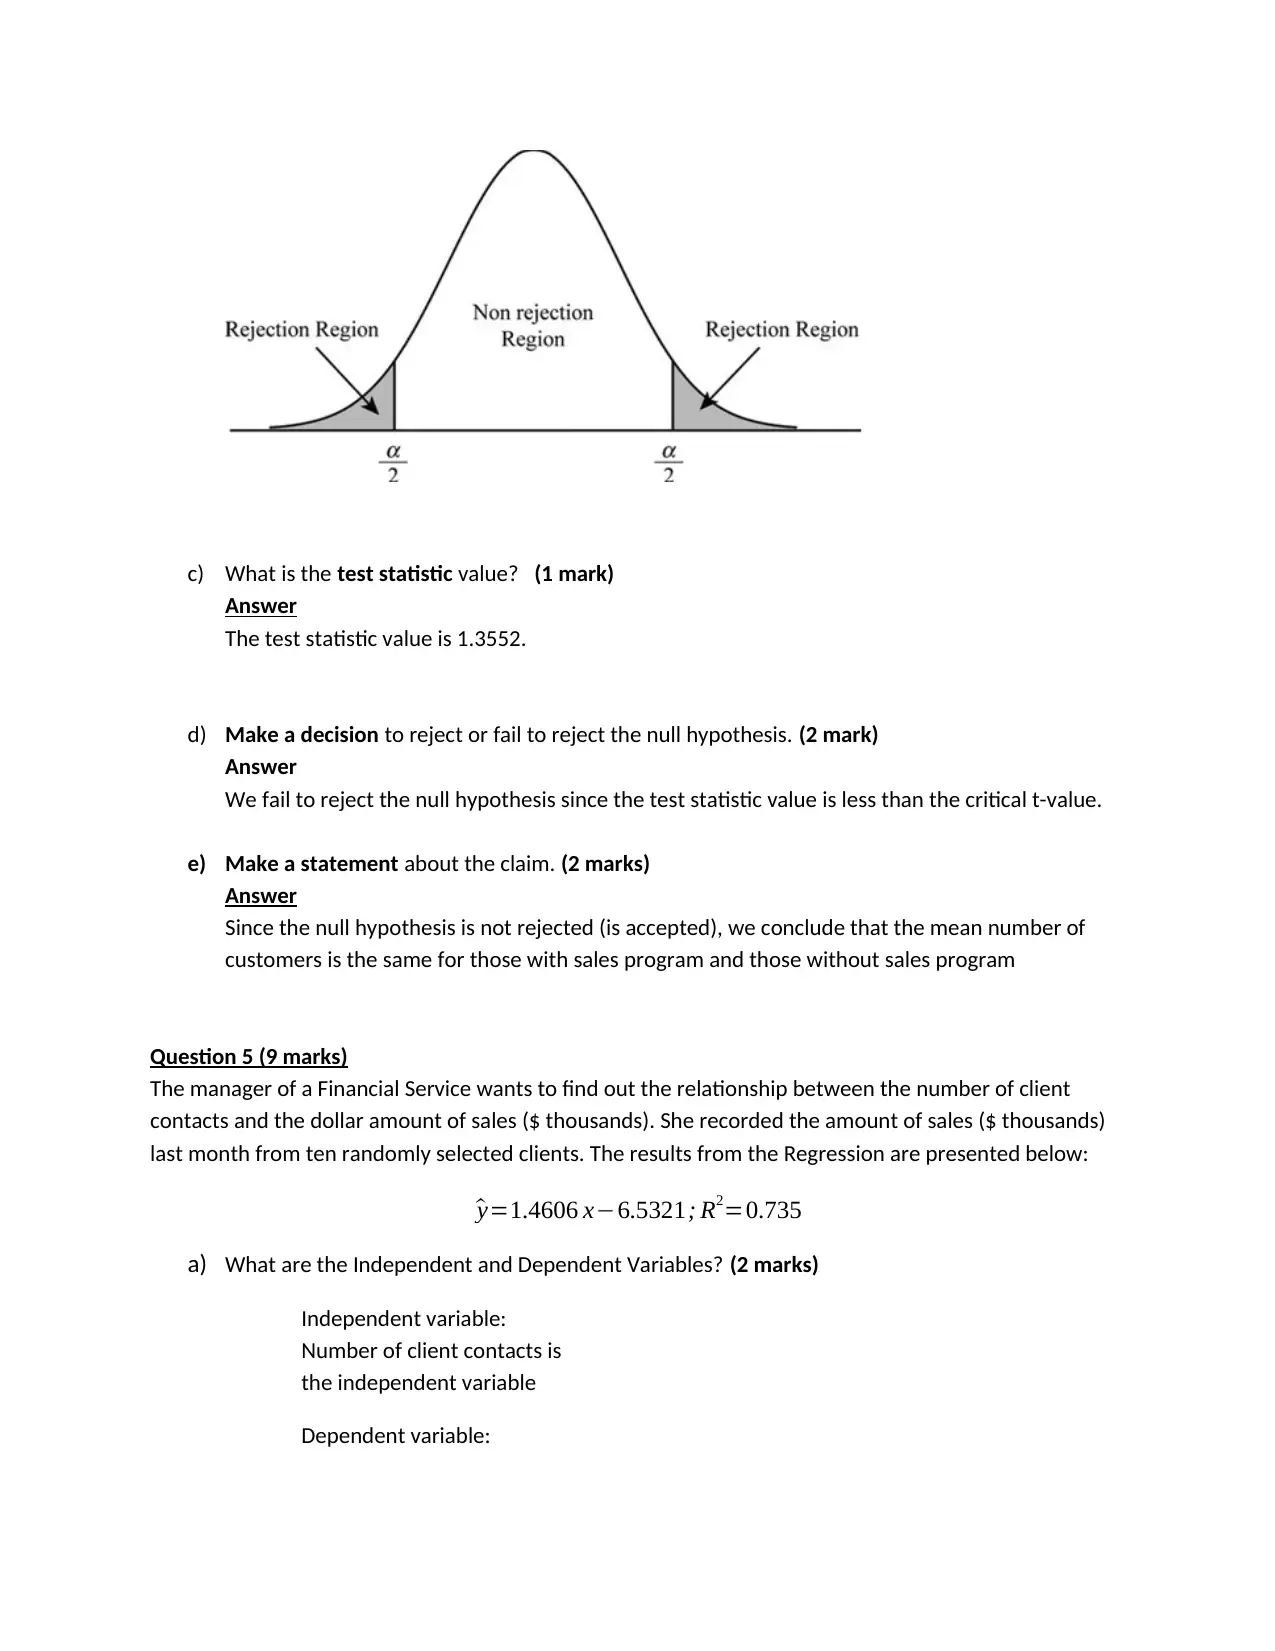
c) What is the test statistic value? (1 mark)
Answer
The test statistic value is 1.3552.
d) Make a decision to reject or fail to reject the null hypothesis. (2 mark)
Answer
We fail to reject the null hypothesis since the test statistic value is less than the critical t-value.
e) Make a statement about the claim. (2 marks)
Answer
Since the null hypothesis is not rejected (is accepted), we conclude that the mean number of
customers is the same for those with sales program and those without sales program
Question 5 (9 marks)
The manager of a Financial Service wants to find out the relationship between the number of client
contacts and the dollar amount of sales ($ thousands). She recorded the amount of sales ($ thousands)
last month from ten randomly selected clients. The results from the Regression are presented below:
^y=1.4606 x−6.5321; R2=0.735
a) What are the Independent and Dependent Variables? (2 marks)
Independent variable:
Number of client contacts is
the independent variable
Dependent variable:
Answer
The test statistic value is 1.3552.
d) Make a decision to reject or fail to reject the null hypothesis. (2 mark)
Answer
We fail to reject the null hypothesis since the test statistic value is less than the critical t-value.
e) Make a statement about the claim. (2 marks)
Answer
Since the null hypothesis is not rejected (is accepted), we conclude that the mean number of
customers is the same for those with sales program and those without sales program
Question 5 (9 marks)
The manager of a Financial Service wants to find out the relationship between the number of client
contacts and the dollar amount of sales ($ thousands). She recorded the amount of sales ($ thousands)
last month from ten randomly selected clients. The results from the Regression are presented below:
^y=1.4606 x−6.5321; R2=0.735
a) What are the Independent and Dependent Variables? (2 marks)
Independent variable:
Number of client contacts is
the independent variable
Dependent variable:
⊘ This is a preview!⊘
Do you want full access?
Subscribe today to unlock all pages.
Trusted by 1+ million students worldwide
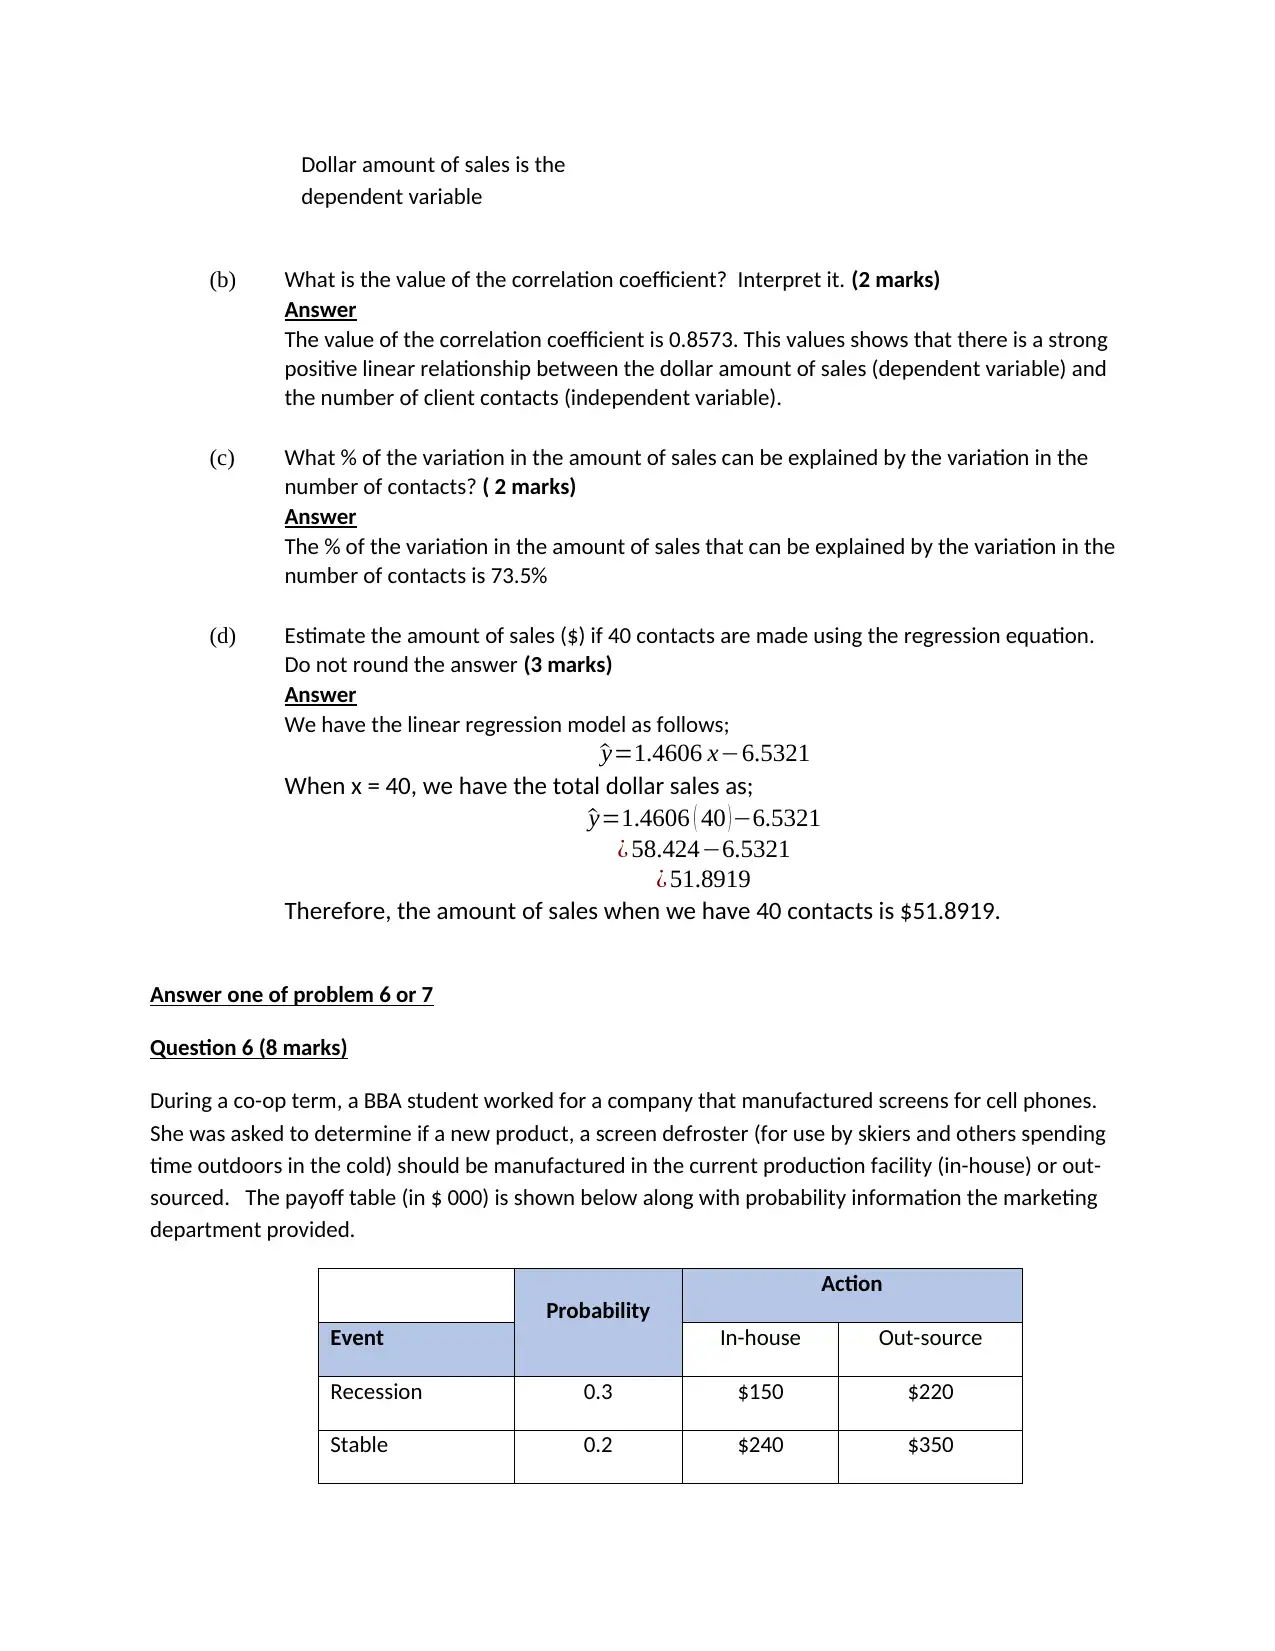
Dollar amount of sales is the
dependent variable
(b) What is the value of the correlation coefficient? Interpret it. (2 marks)
Answer
The value of the correlation coefficient is 0.8573. This values shows that there is a strong
positive linear relationship between the dollar amount of sales (dependent variable) and
the number of client contacts (independent variable).
(c) What % of the variation in the amount of sales can be explained by the variation in the
number of contacts? ( 2 marks)
Answer
The % of the variation in the amount of sales that can be explained by the variation in the
number of contacts is 73.5%
(d) Estimate the amount of sales ($) if 40 contacts are made using the regression equation.
Do not round the answer (3 marks)
Answer
We have the linear regression model as follows;
^y=1.4606 x−6.5321
When x = 40, we have the total dollar sales as;
^y=1.4606 ( 40 ) −6.5321
¿ 58.424−6.5321
¿ 51.8919
Therefore, the amount of sales when we have 40 contacts is $51.8919.
Answer one of problem 6 or 7
Question 6 (8 marks)
During a co-op term, a BBA student worked for a company that manufactured screens for cell phones.
She was asked to determine if a new product, a screen defroster (for use by skiers and others spending
time outdoors in the cold) should be manufactured in the current production facility (in-house) or out-
sourced. The payoff table (in $ 000) is shown below along with probability information the marketing
department provided.
Probability
Action
Event In-house Out-source
Recession 0.3 $150 $220
Stable 0.2 $240 $350
Paraphrase This Document
Need a fresh take? Get an instant paraphrase of this document with our AI Paraphraser
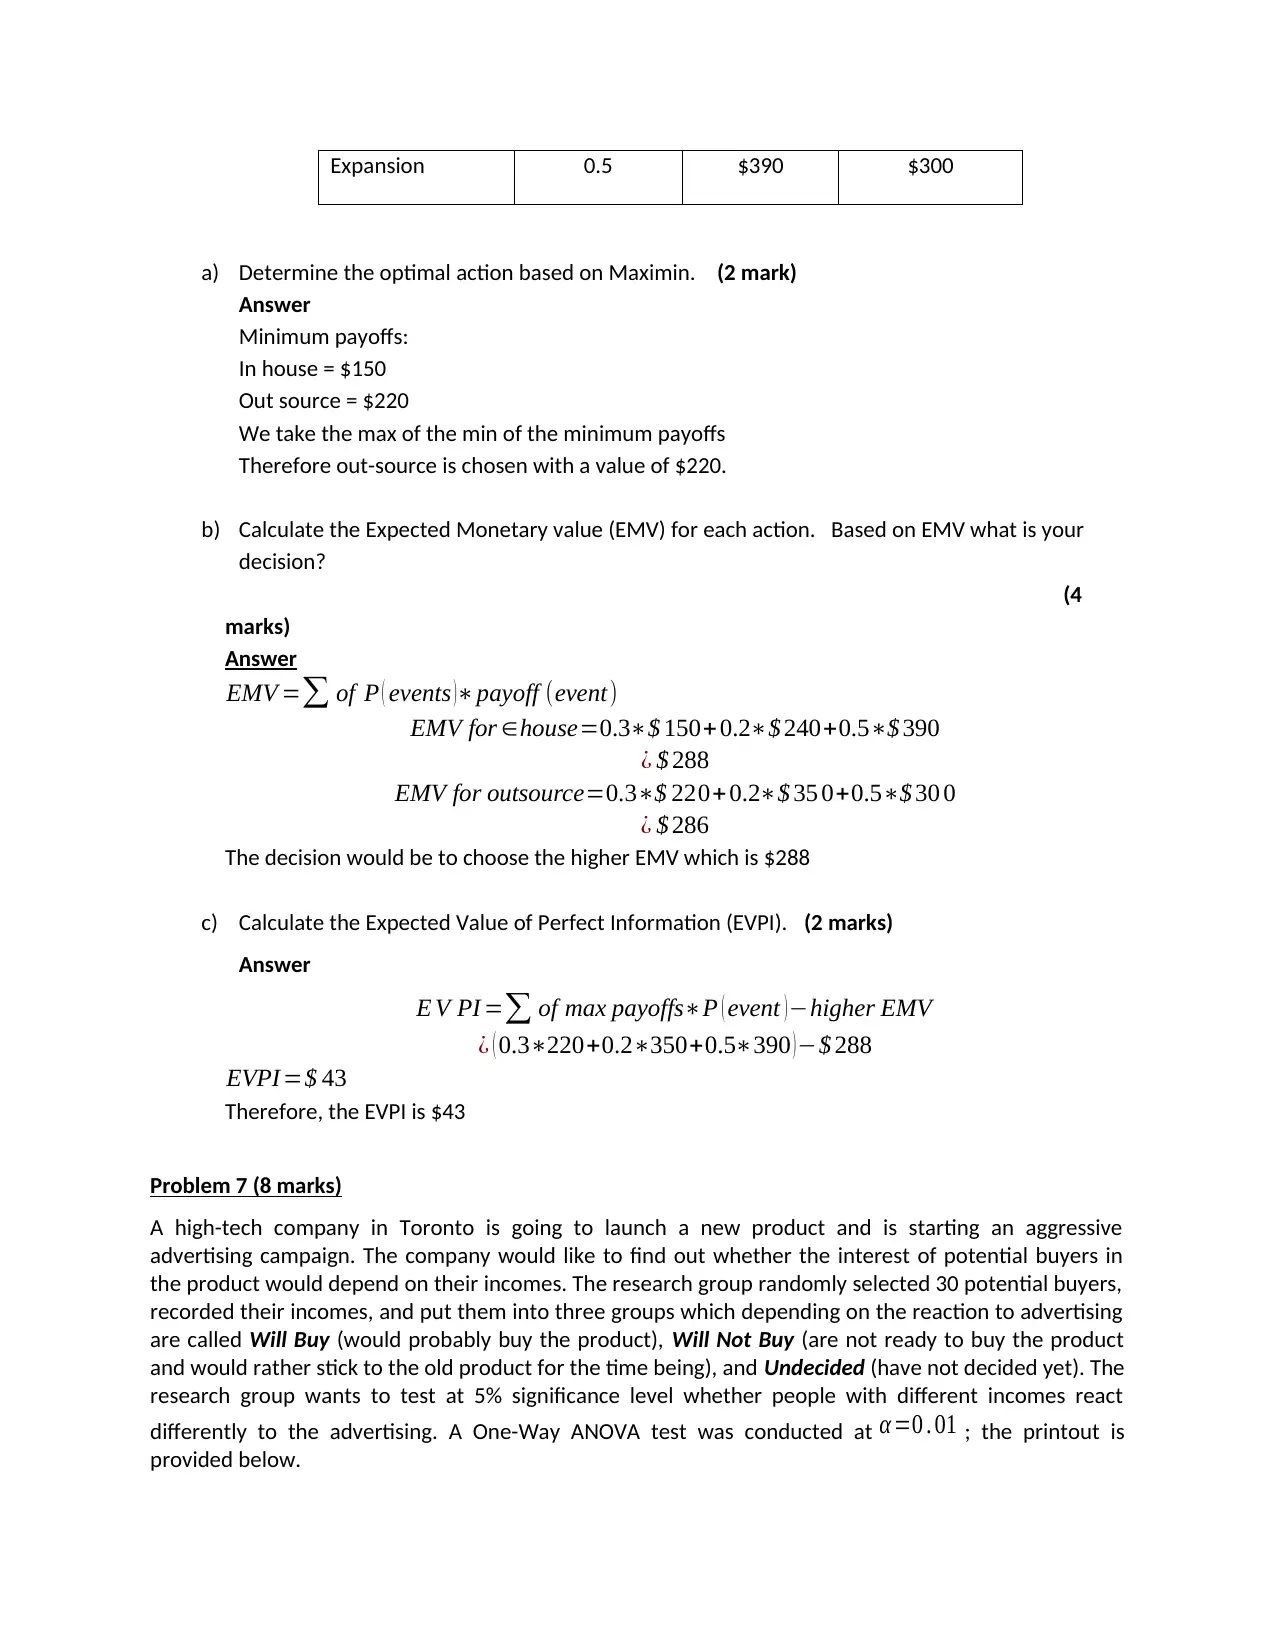
Expansion 0.5 $390 $300
a) Determine the optimal action based on Maximin. (2 mark)
Answer
Minimum payoffs:
In house = $150
Out source = $220
We take the max of the min of the minimum payoffs
Therefore out-source is chosen with a value of $220.
b) Calculate the Expected Monetary value (EMV) for each action. Based on EMV what is your
decision?
(4
marks)
Answer
EMV =∑ of P ( events )∗payoff (event)
EMV for ∈house=0.3∗$ 150+0.2∗$ 240+0.5∗$ 390
¿ $ 288
EMV for outsource=0.3∗$ 220+ 0.2∗$ 35 0+0.5∗$ 30 0
¿ $ 286
The decision would be to choose the higher EMV which is $288
c) Calculate the Expected Value of Perfect Information (EVPI). (2 marks)
Answer
E V PI =∑ of max payoffs∗P ( event )−higher EMV
¿ ( 0.3∗220+0.2∗350+0.5∗390 ) −$ 288
EVPI =$ 43
Therefore, the EVPI is $43
Problem 7 (8 marks)
A high-tech company in Toronto is going to launch a new product and is starting an aggressive
advertising campaign. The company would like to find out whether the interest of potential buyers in
the product would depend on their incomes. The research group randomly selected 30 potential buyers,
recorded their incomes, and put them into three groups which depending on the reaction to advertising
are called Will Buy (would probably buy the product), Will Not Buy (are not ready to buy the product
and would rather stick to the old product for the time being), and Undecided (have not decided yet). The
research group wants to test at 5% significance level whether people with different incomes react
differently to the advertising. A One-Way ANOVA test was conducted at α =0 . 01 ; the printout is
provided below.
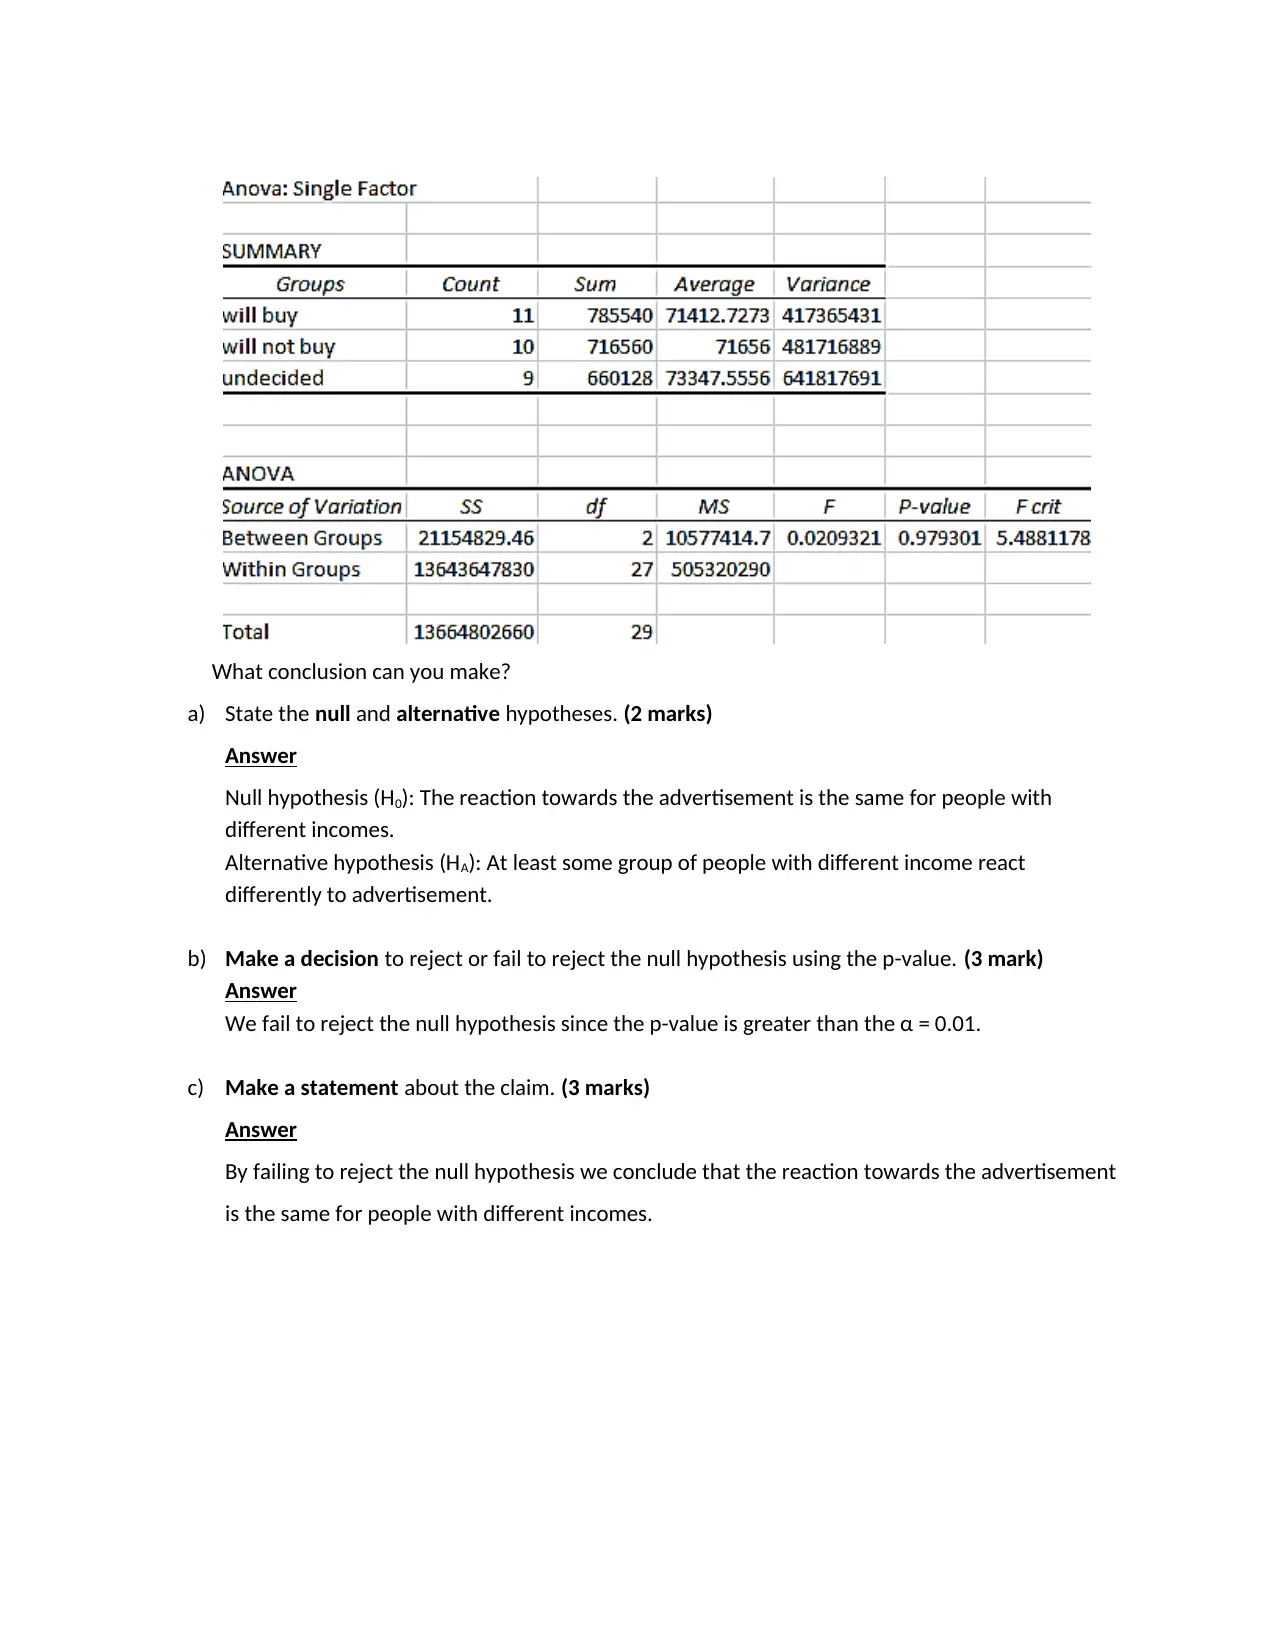
What conclusion can you make?
a) State the null and alternative hypotheses. (2 marks)
Answer
Null hypothesis (H0): The reaction towards the advertisement is the same for people with
different incomes.
Alternative hypothesis (HA): At least some group of people with different income react
differently to advertisement.
b) Make a decision to reject or fail to reject the null hypothesis using the p-value. (3 mark)
Answer
We fail to reject the null hypothesis since the p-value is greater than the α = 0.01.
c) Make a statement about the claim. (3 marks)
Answer
By failing to reject the null hypothesis we conclude that the reaction towards the advertisement
is the same for people with different incomes.
⊘ This is a preview!⊘
Do you want full access?
Subscribe today to unlock all pages.
Trusted by 1+ million students worldwide
1 out of 12
Related Documents


Your All-in-One AI-Powered Toolkit for Academic Success.
+13062052269
info@desklib.com
Available 24*7 on WhatsApp / Email
![[object Object]](/_next/static/media/star-bottom.7253800d.svg)
Unlock your academic potential
Copyright © 2020–2026 A2Z Services. All Rights Reserved. Developed and managed by ZUCOL.