Detailed Regression Model Analysis for Business Statistics Assignment

Verified

Added on  2021/02/19

|19
|2073
|110
Homework Assignment
AI Summary
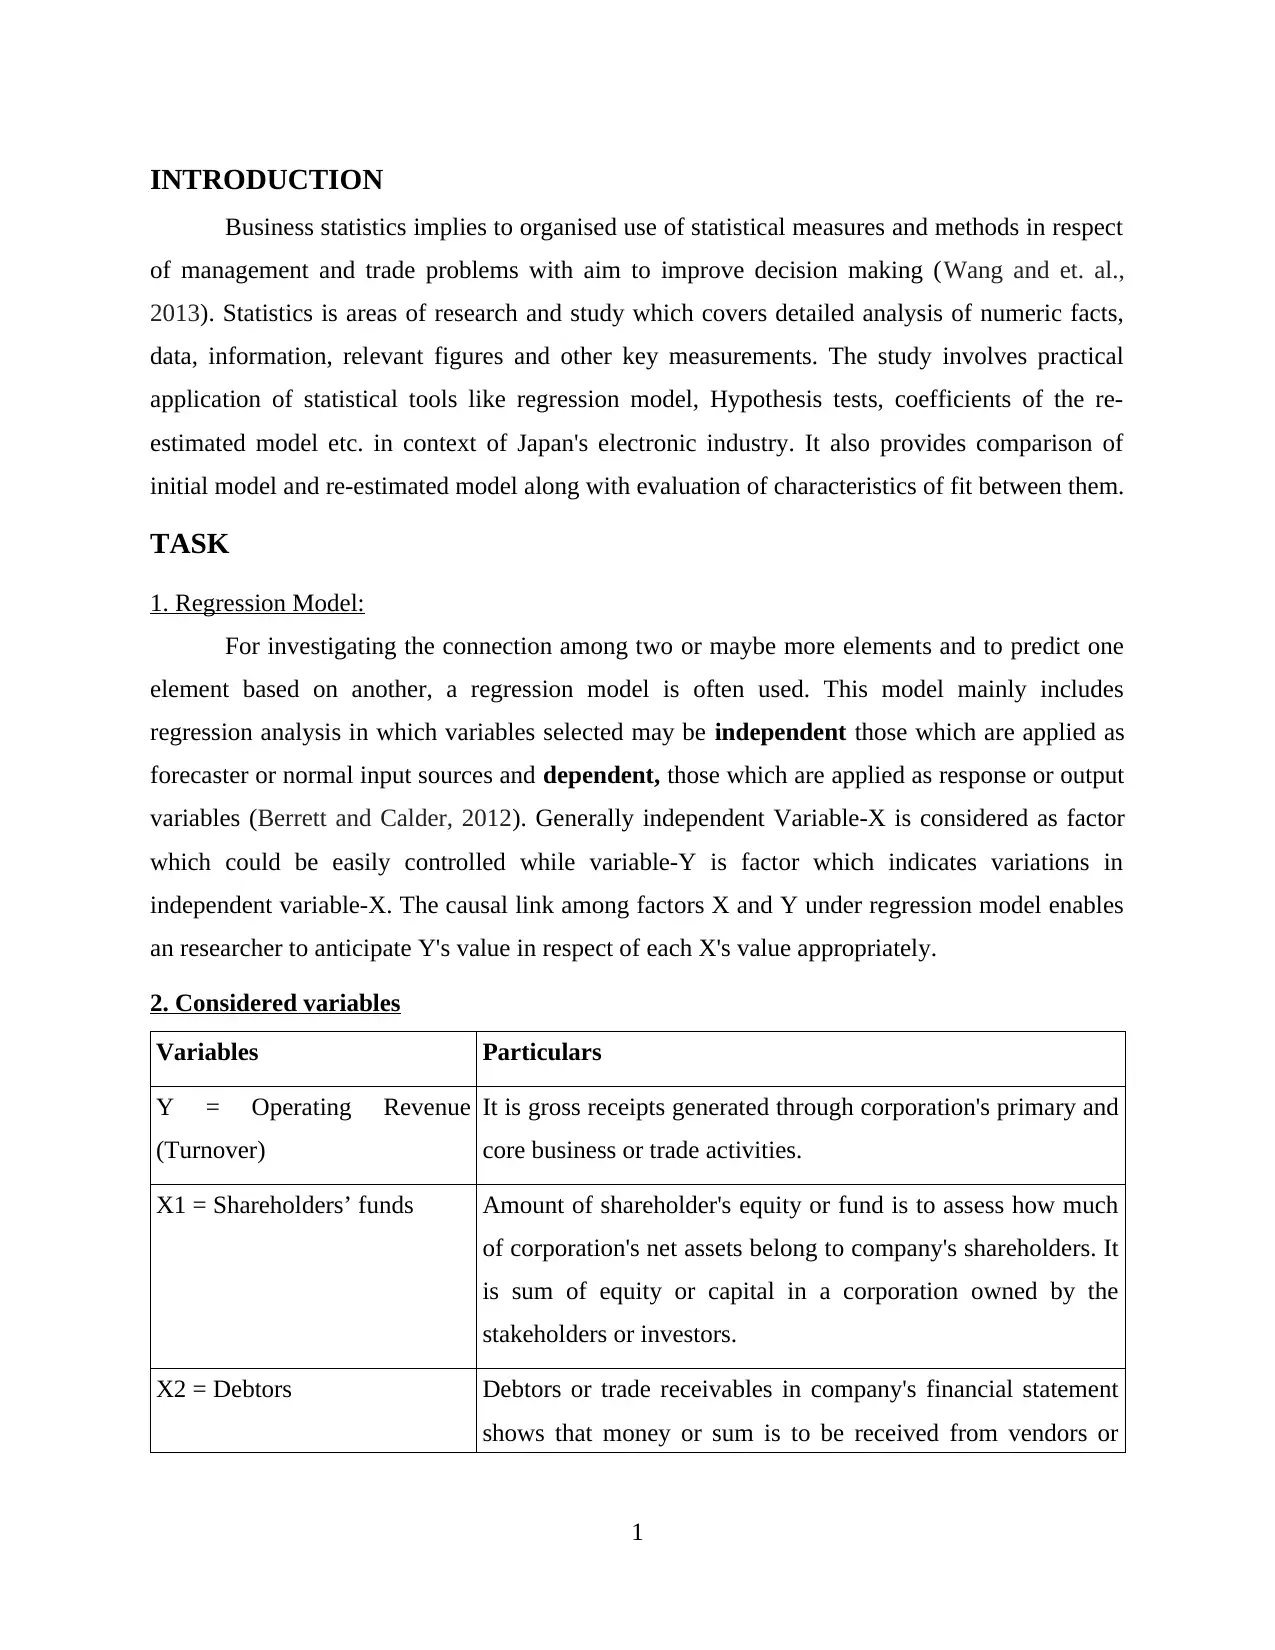
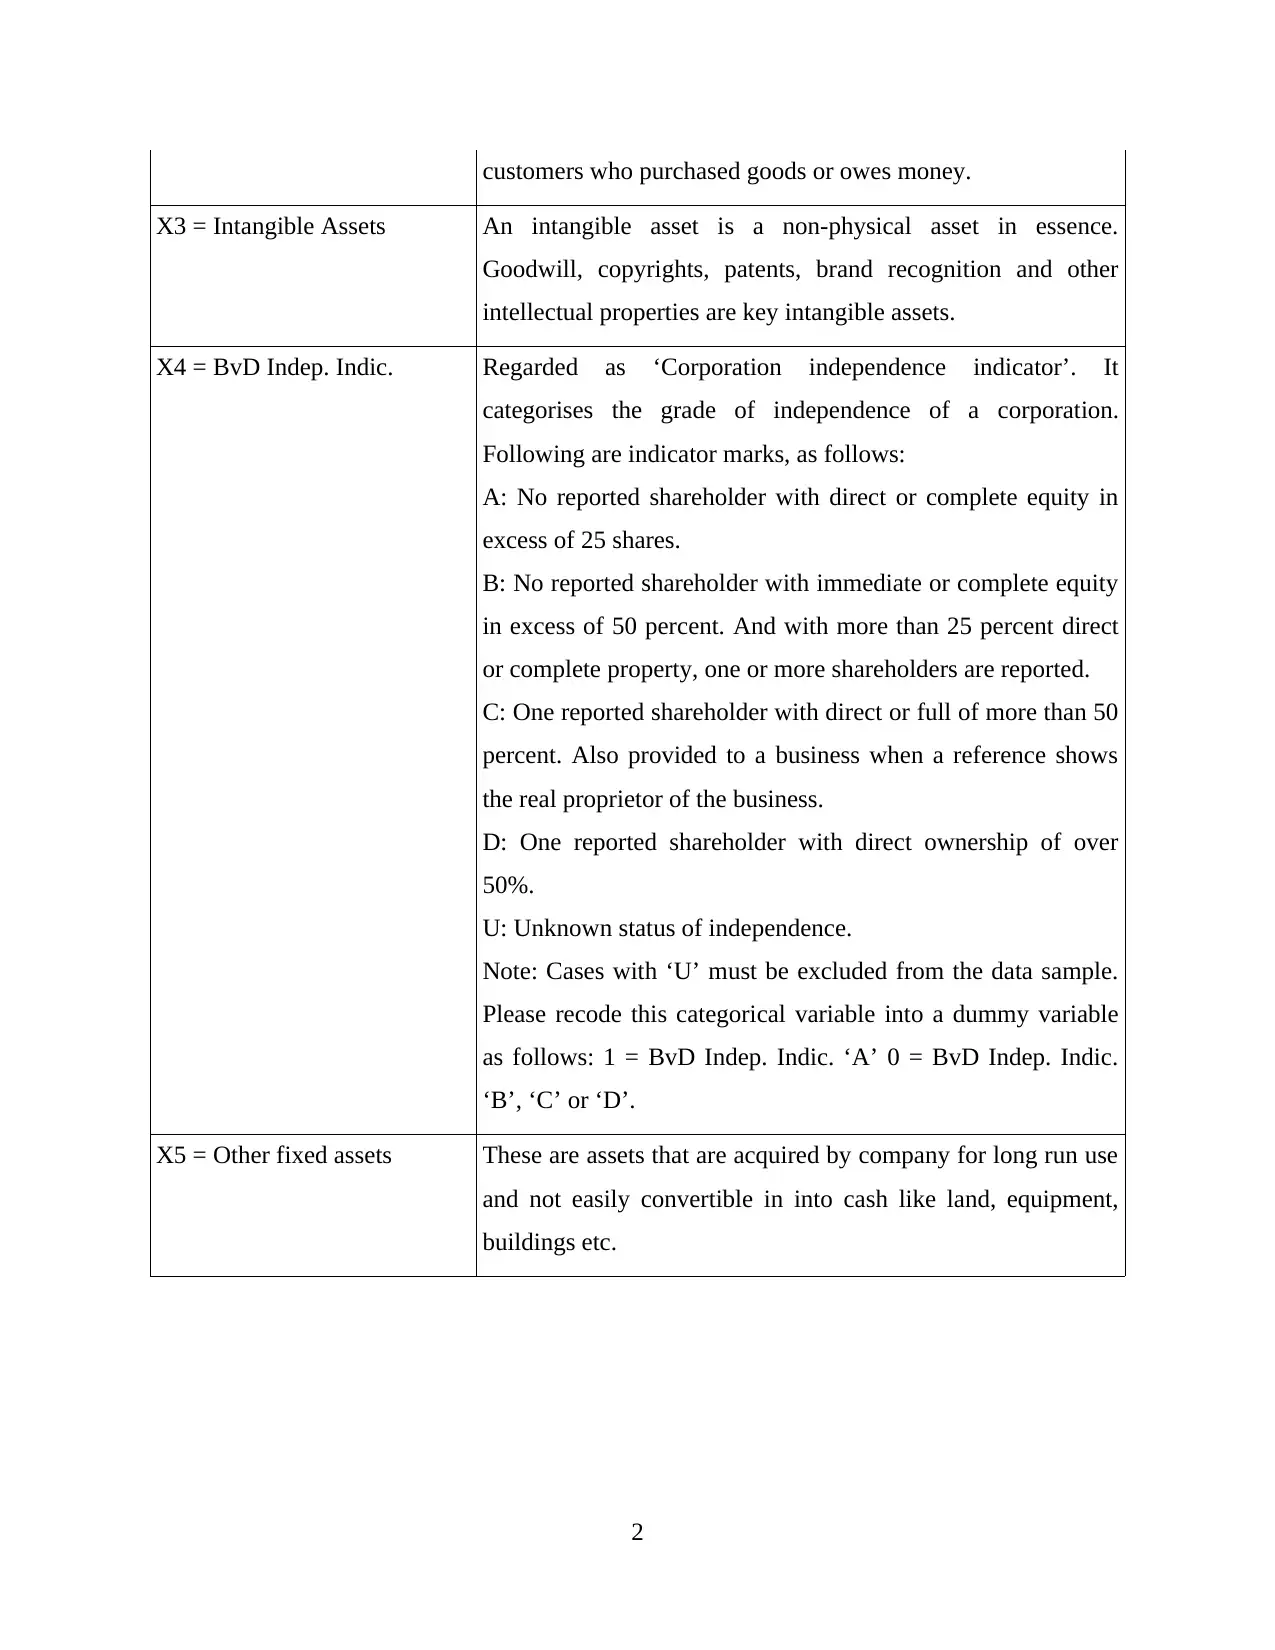
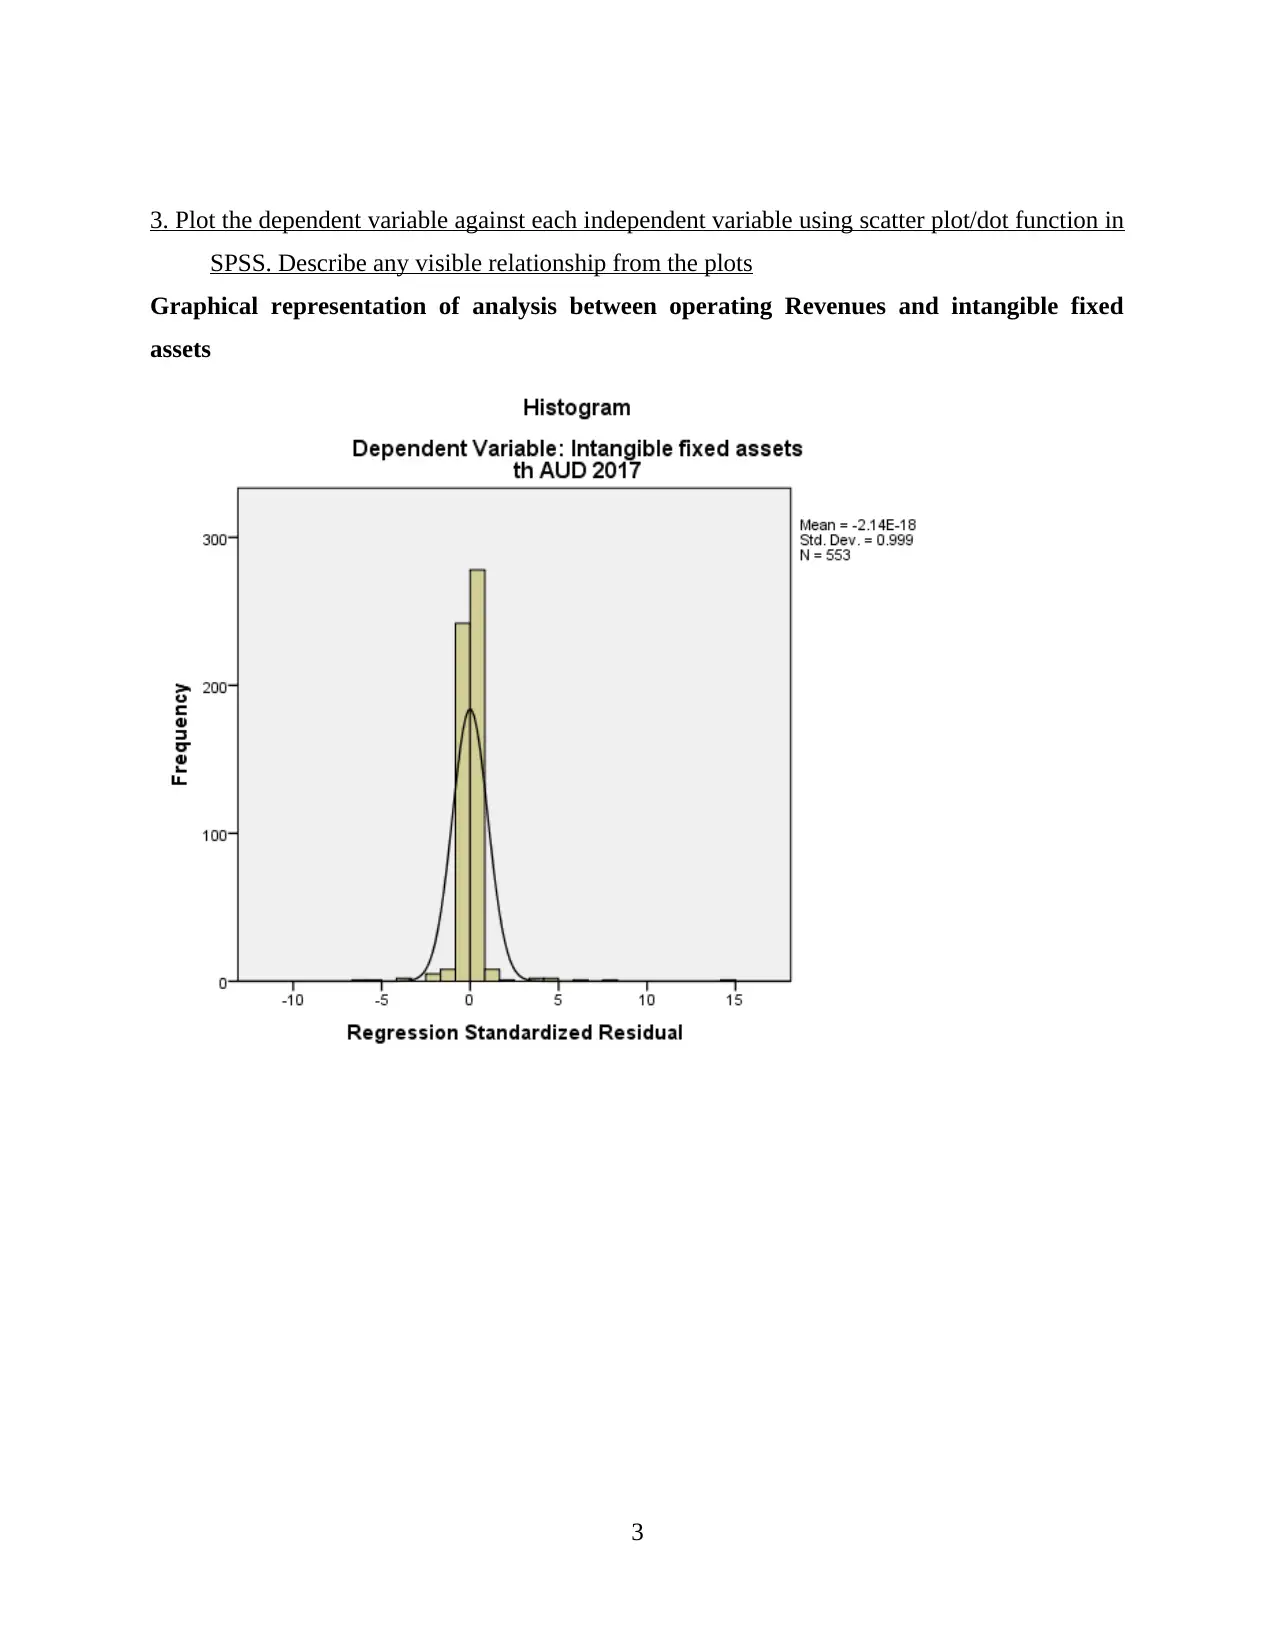
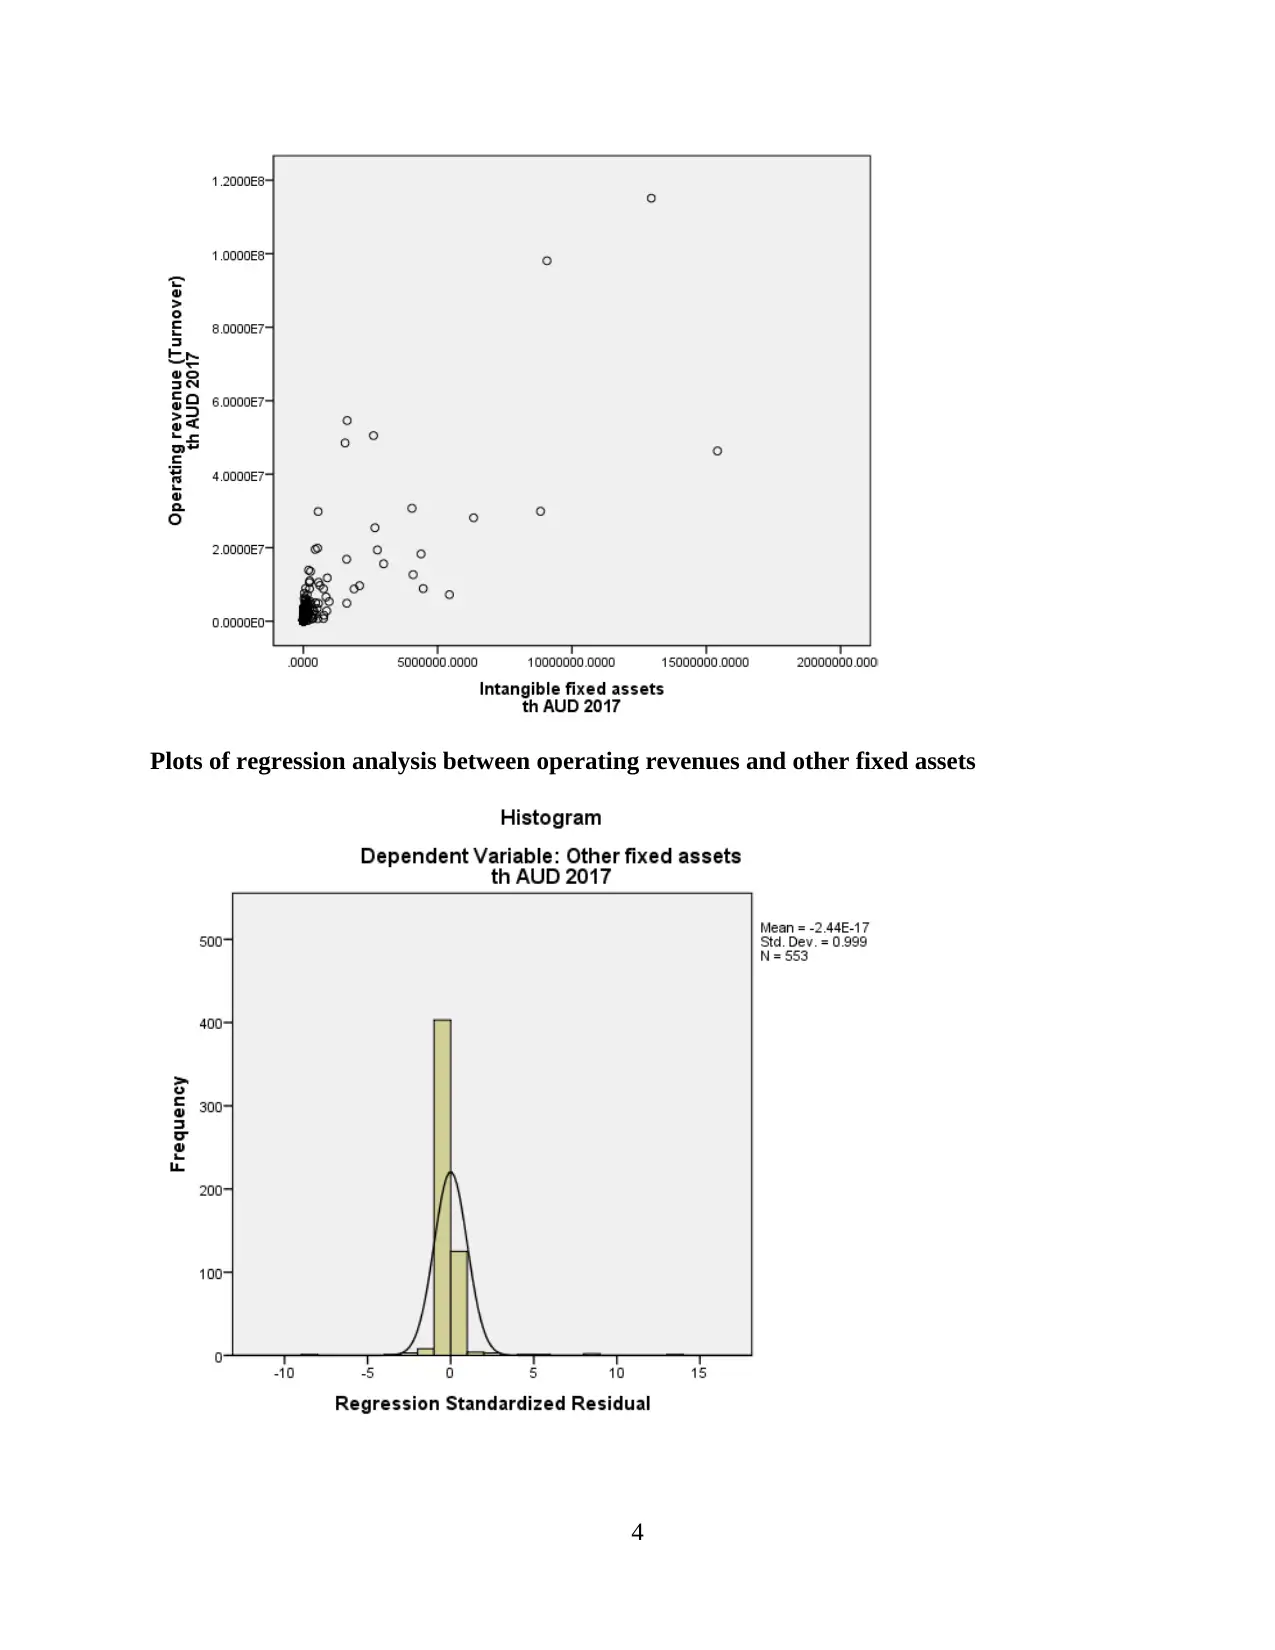
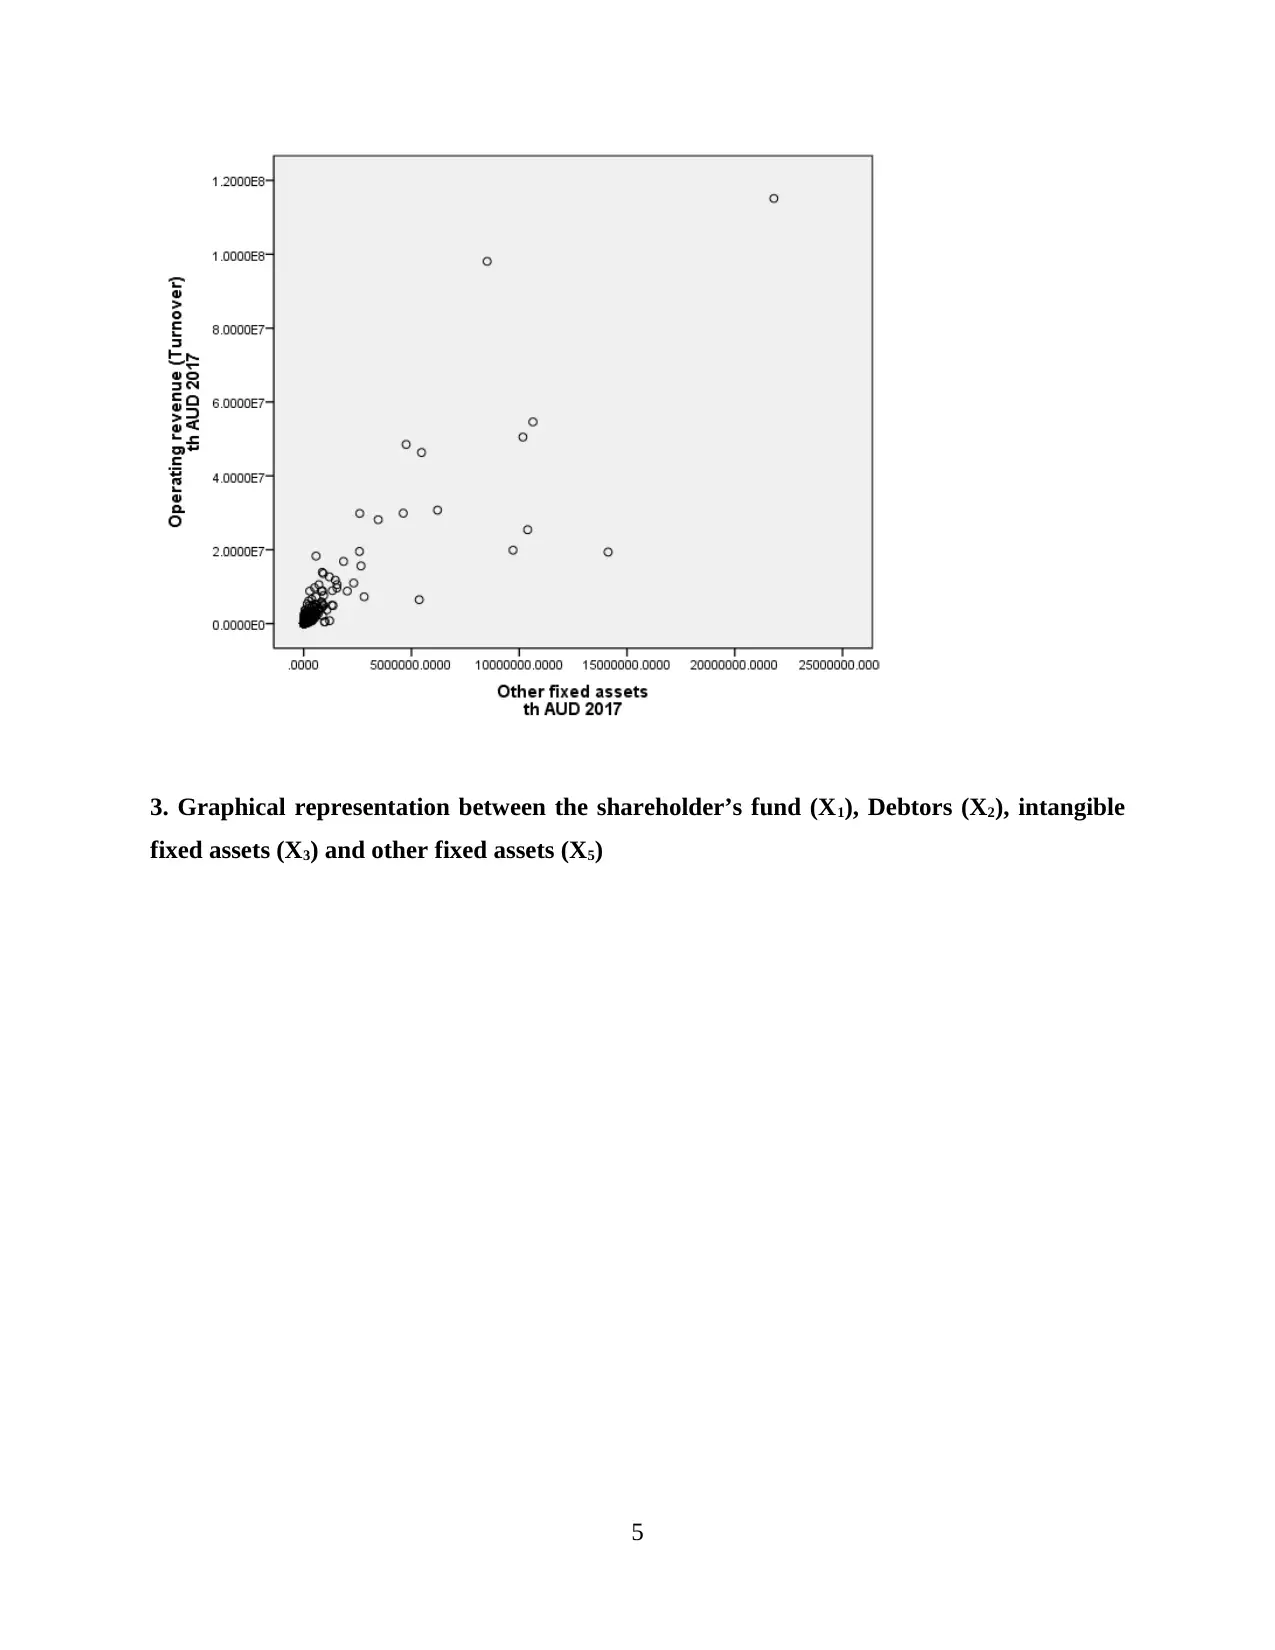
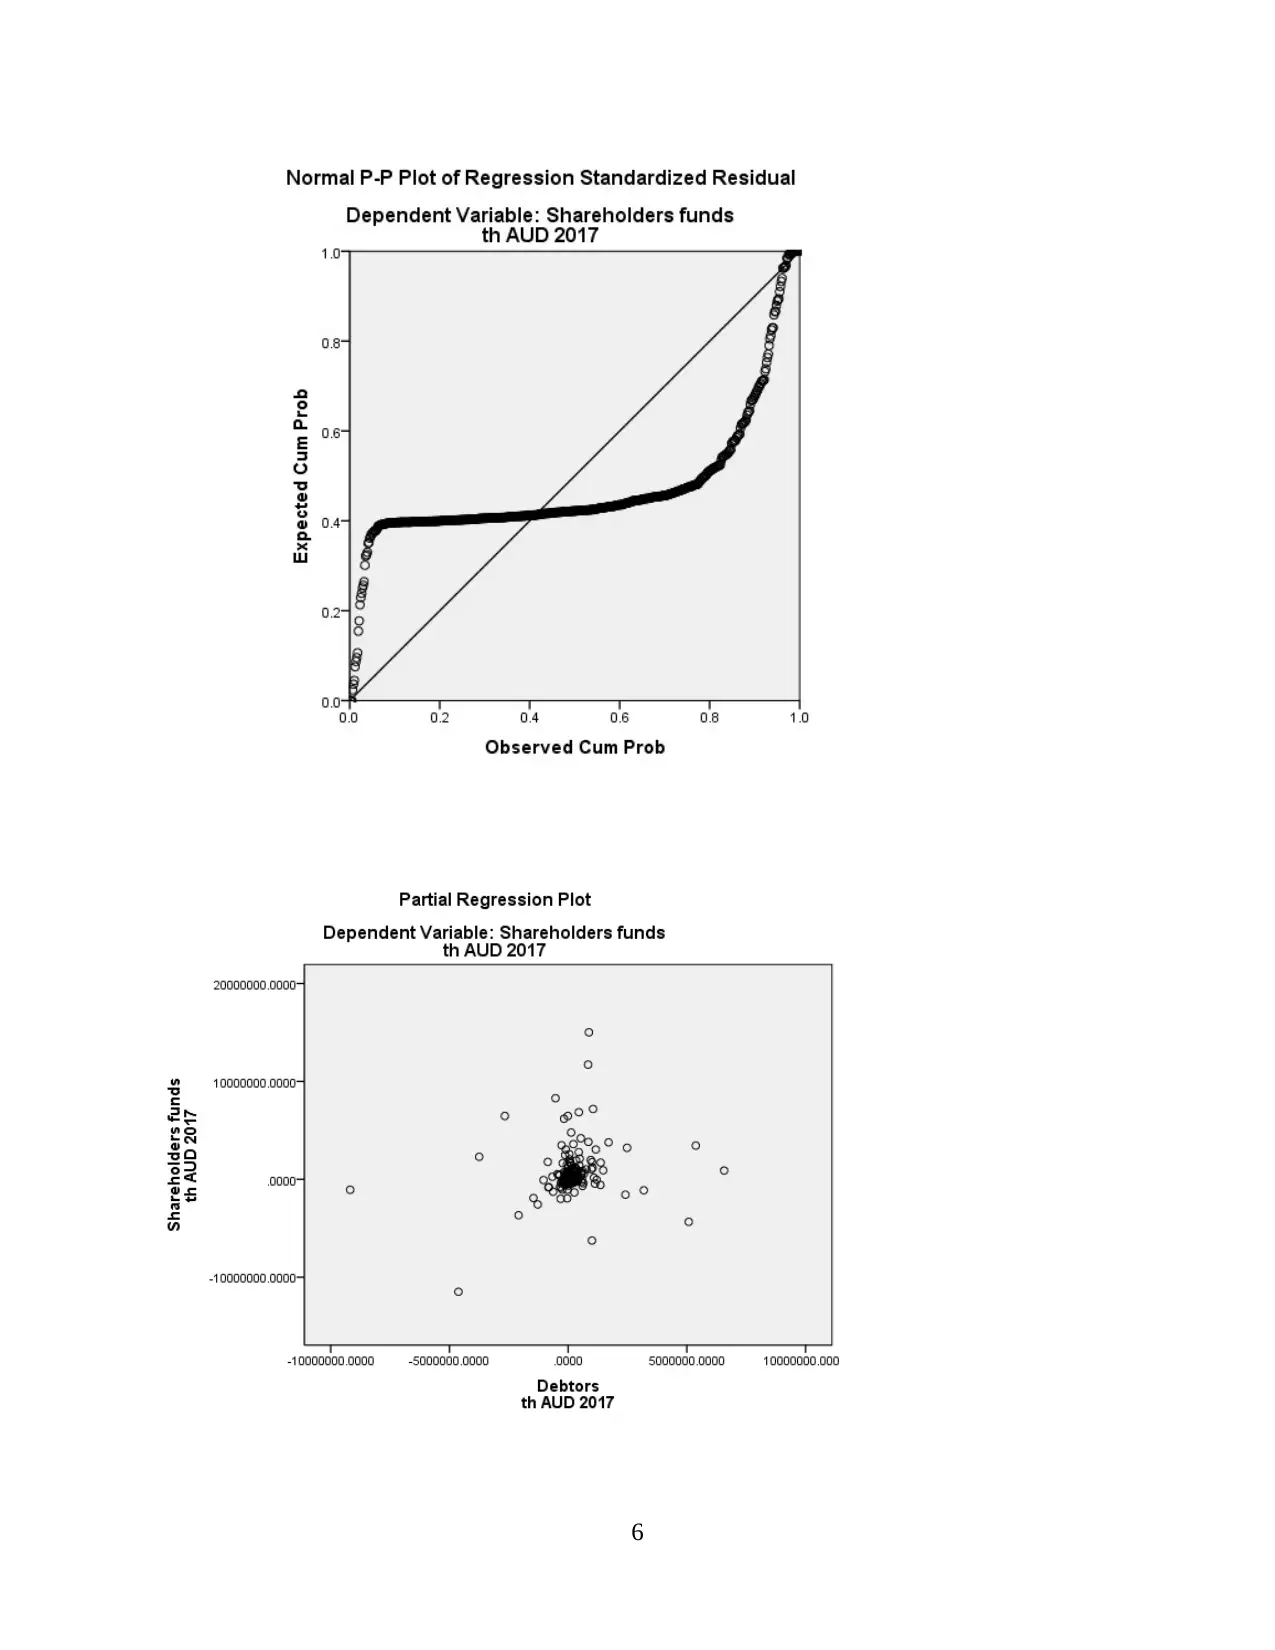
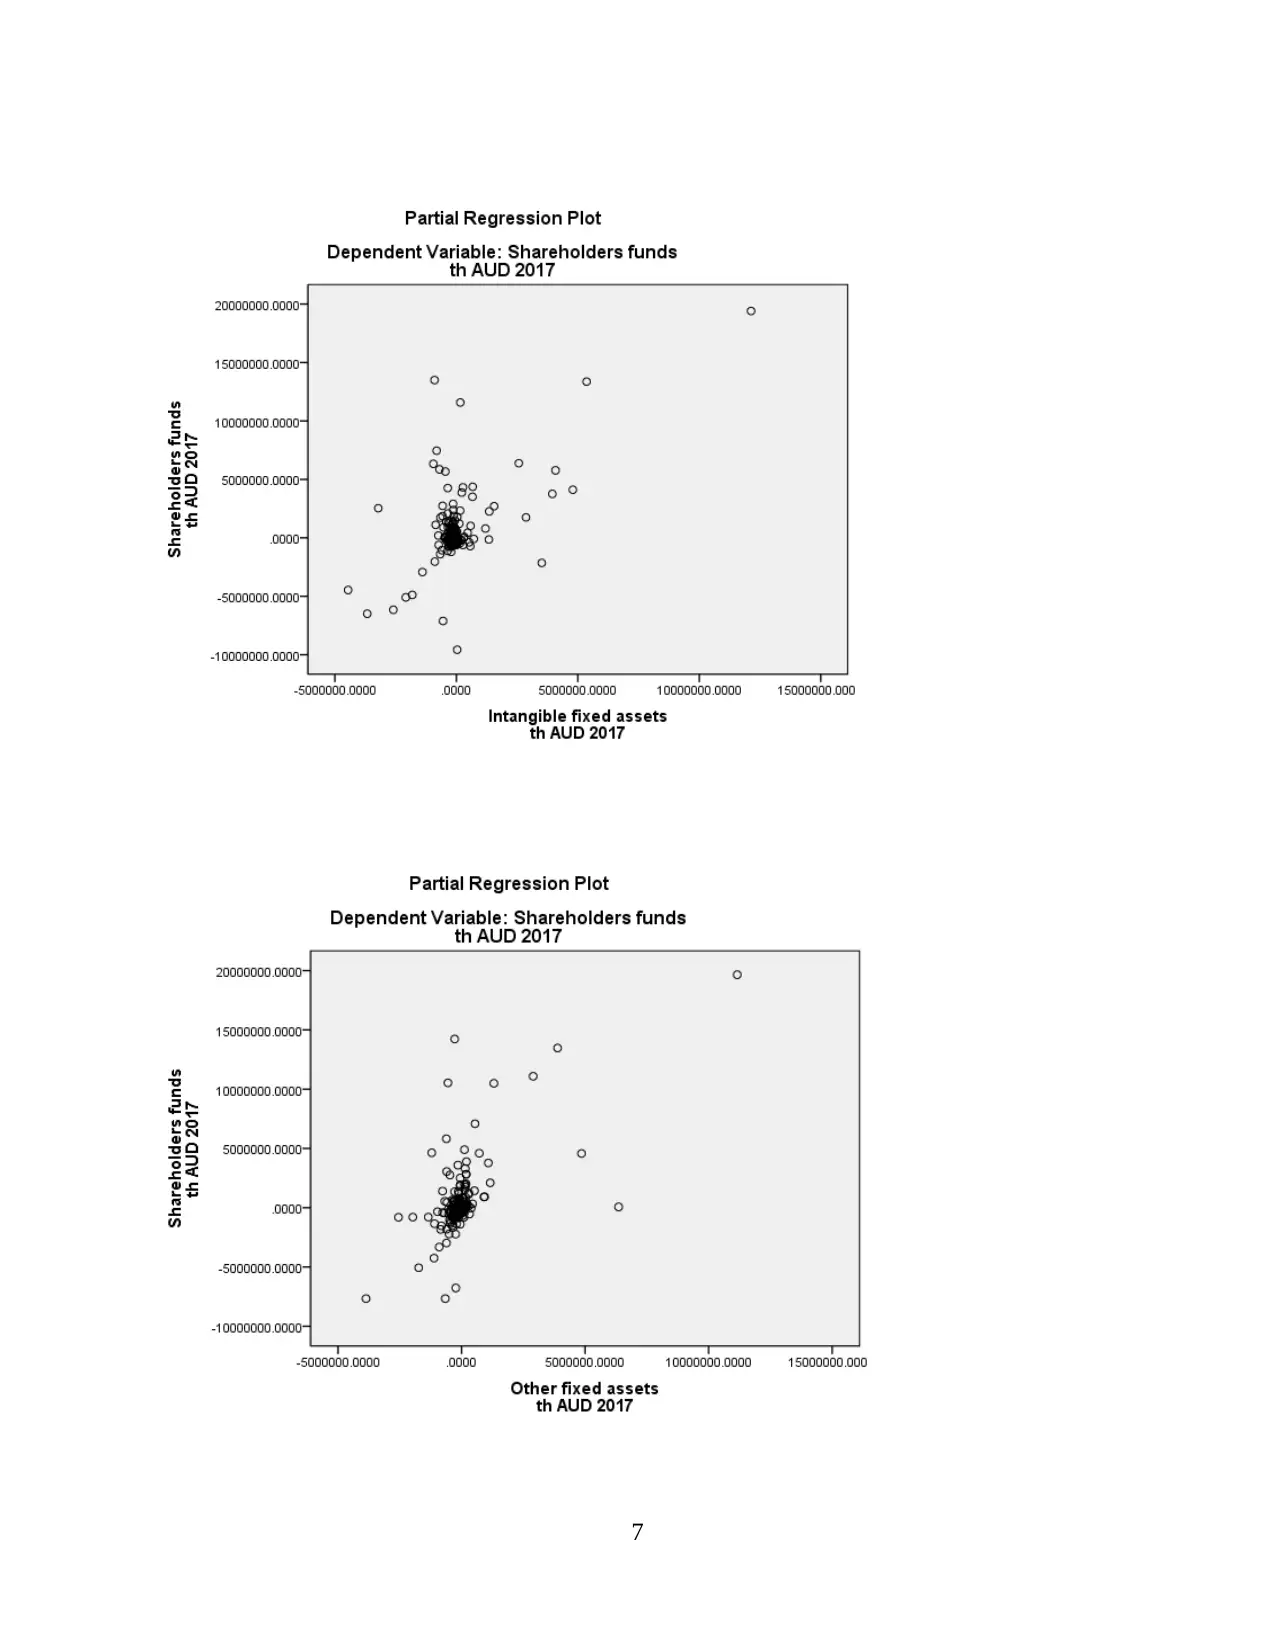
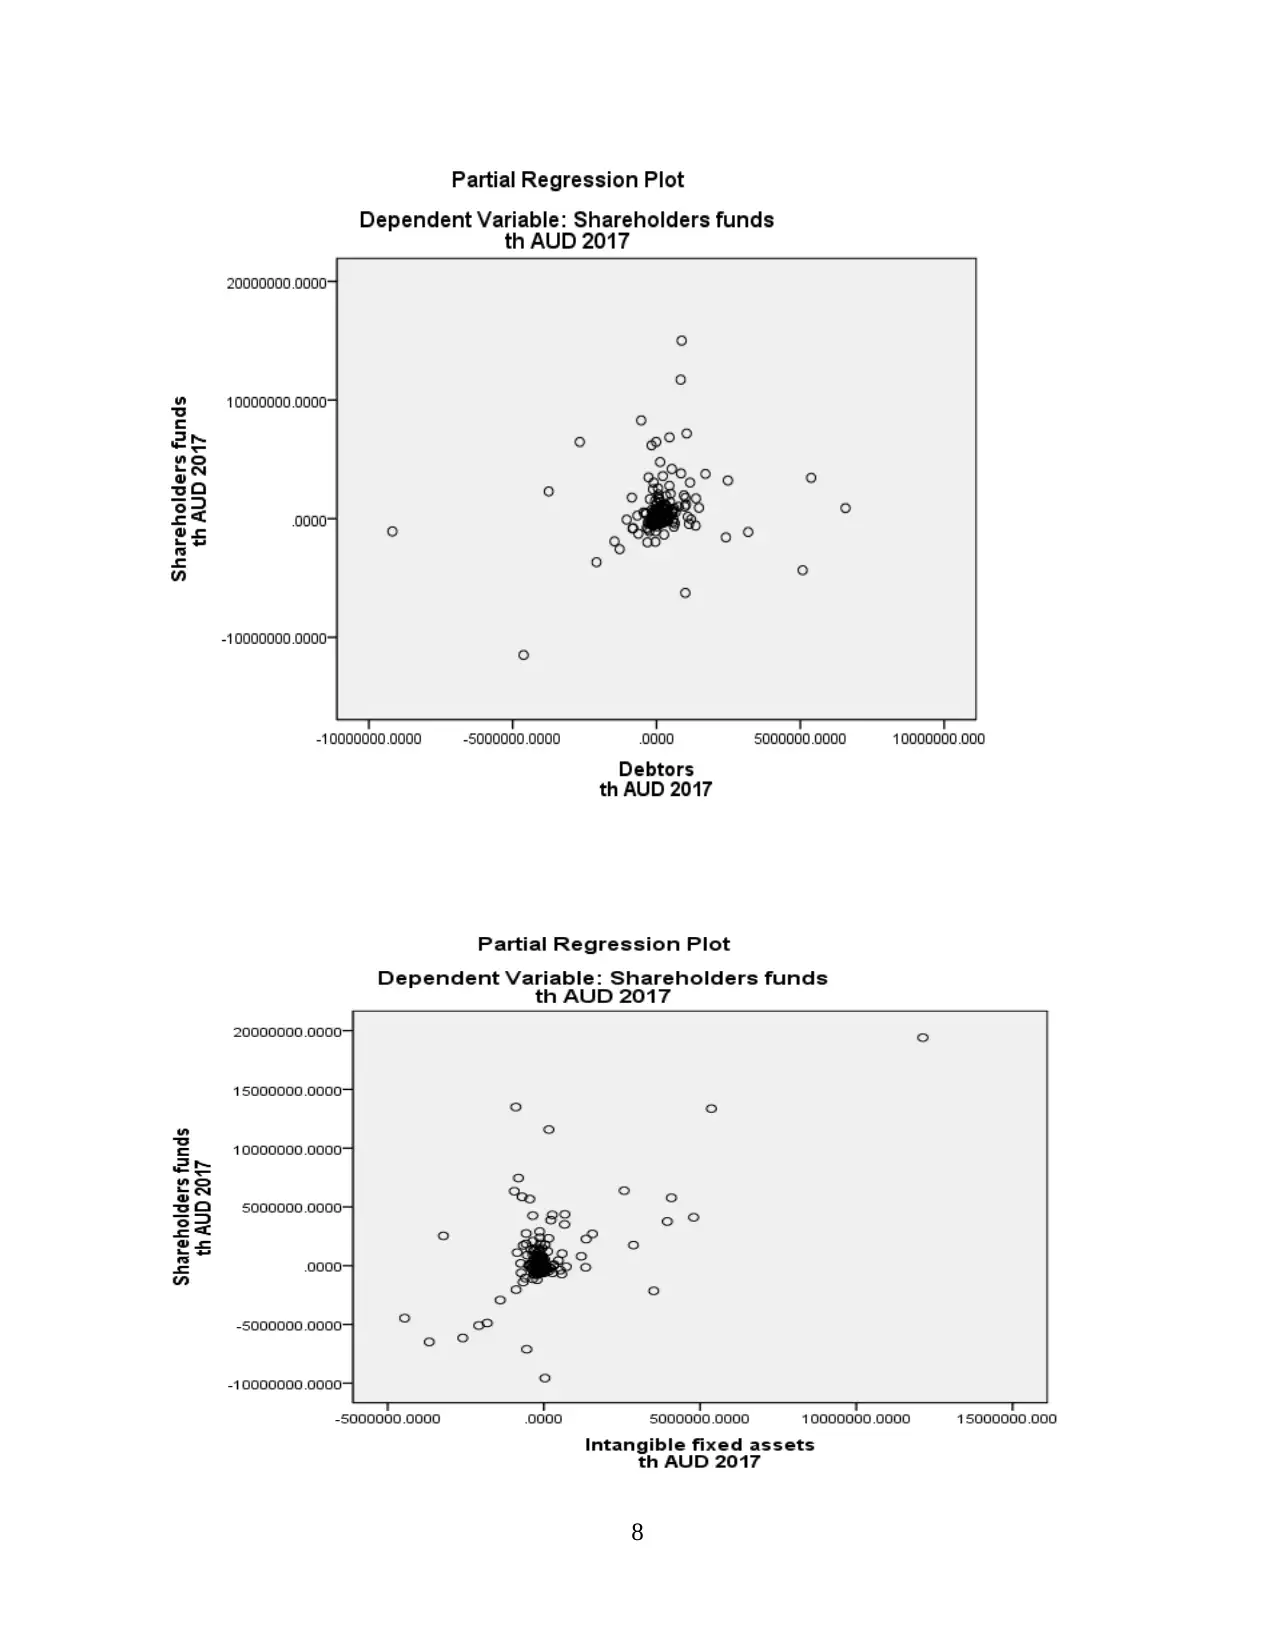
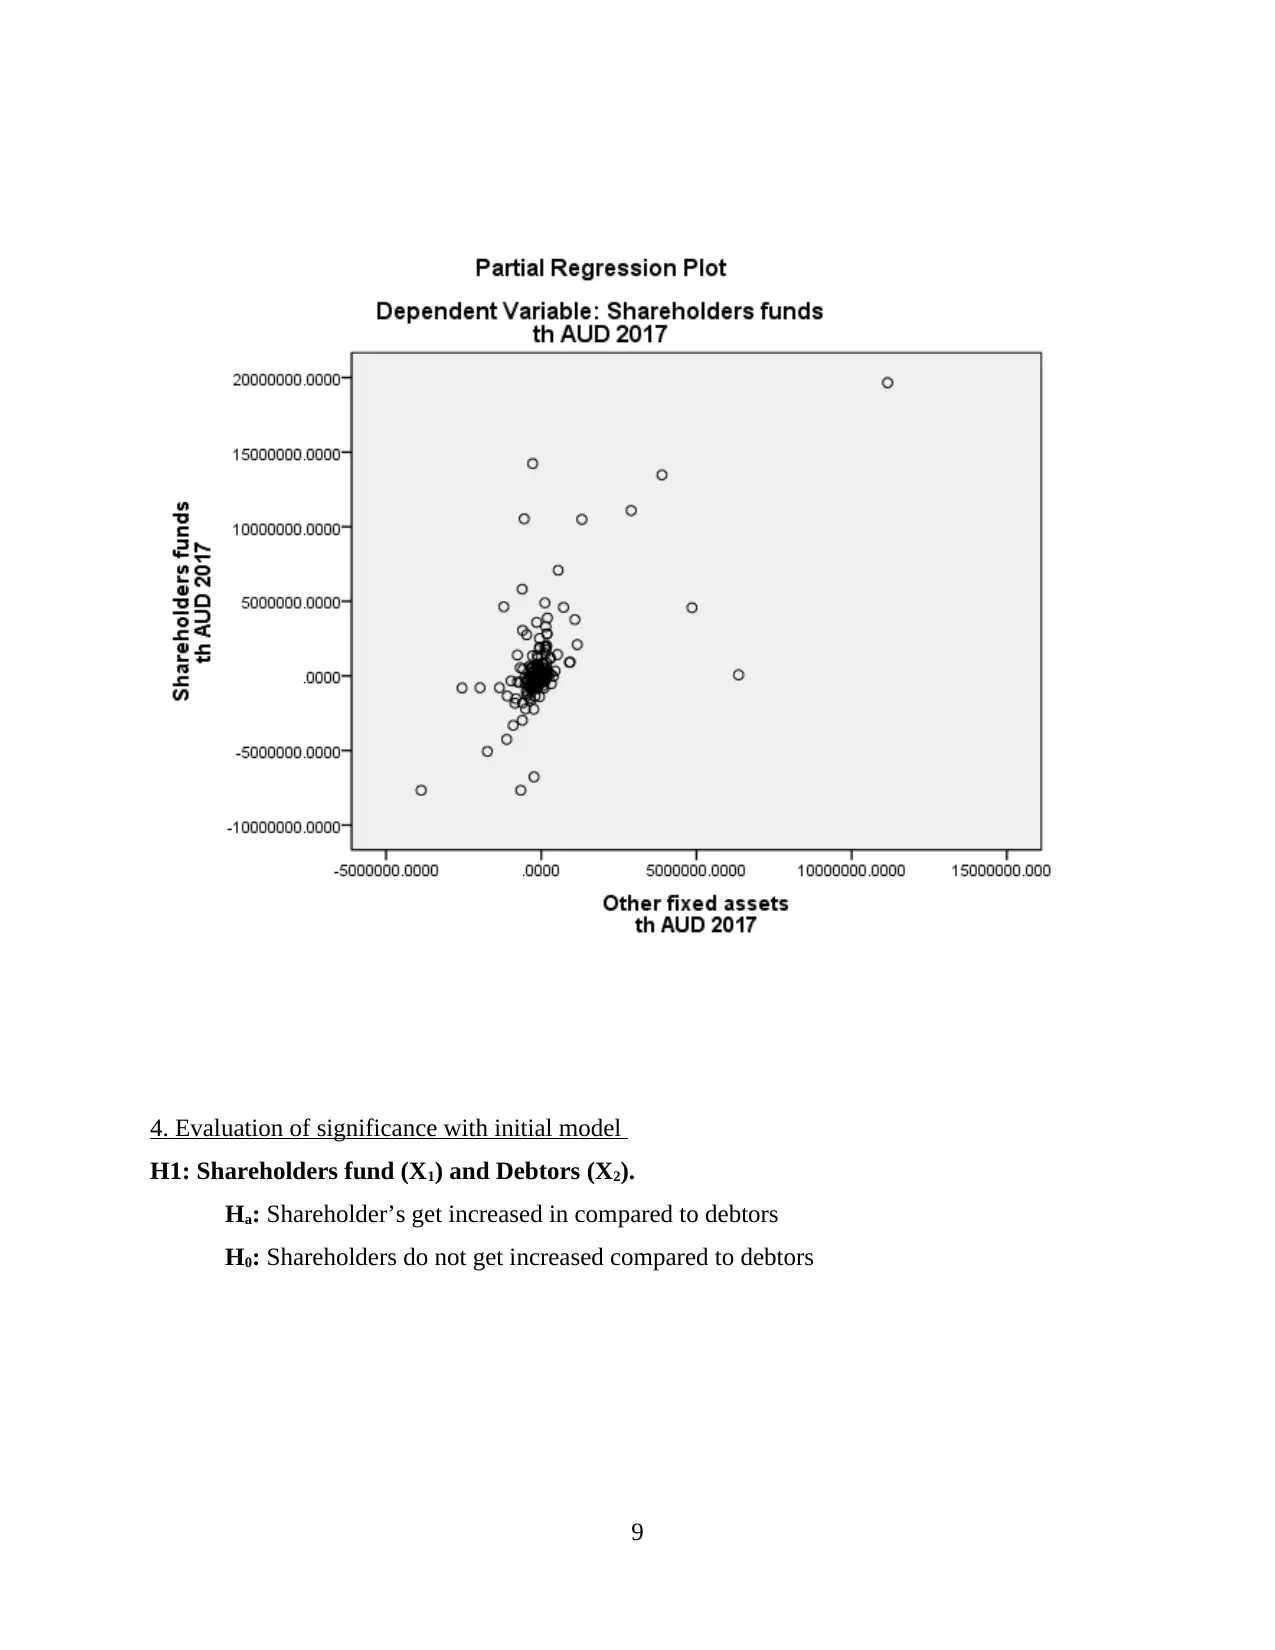
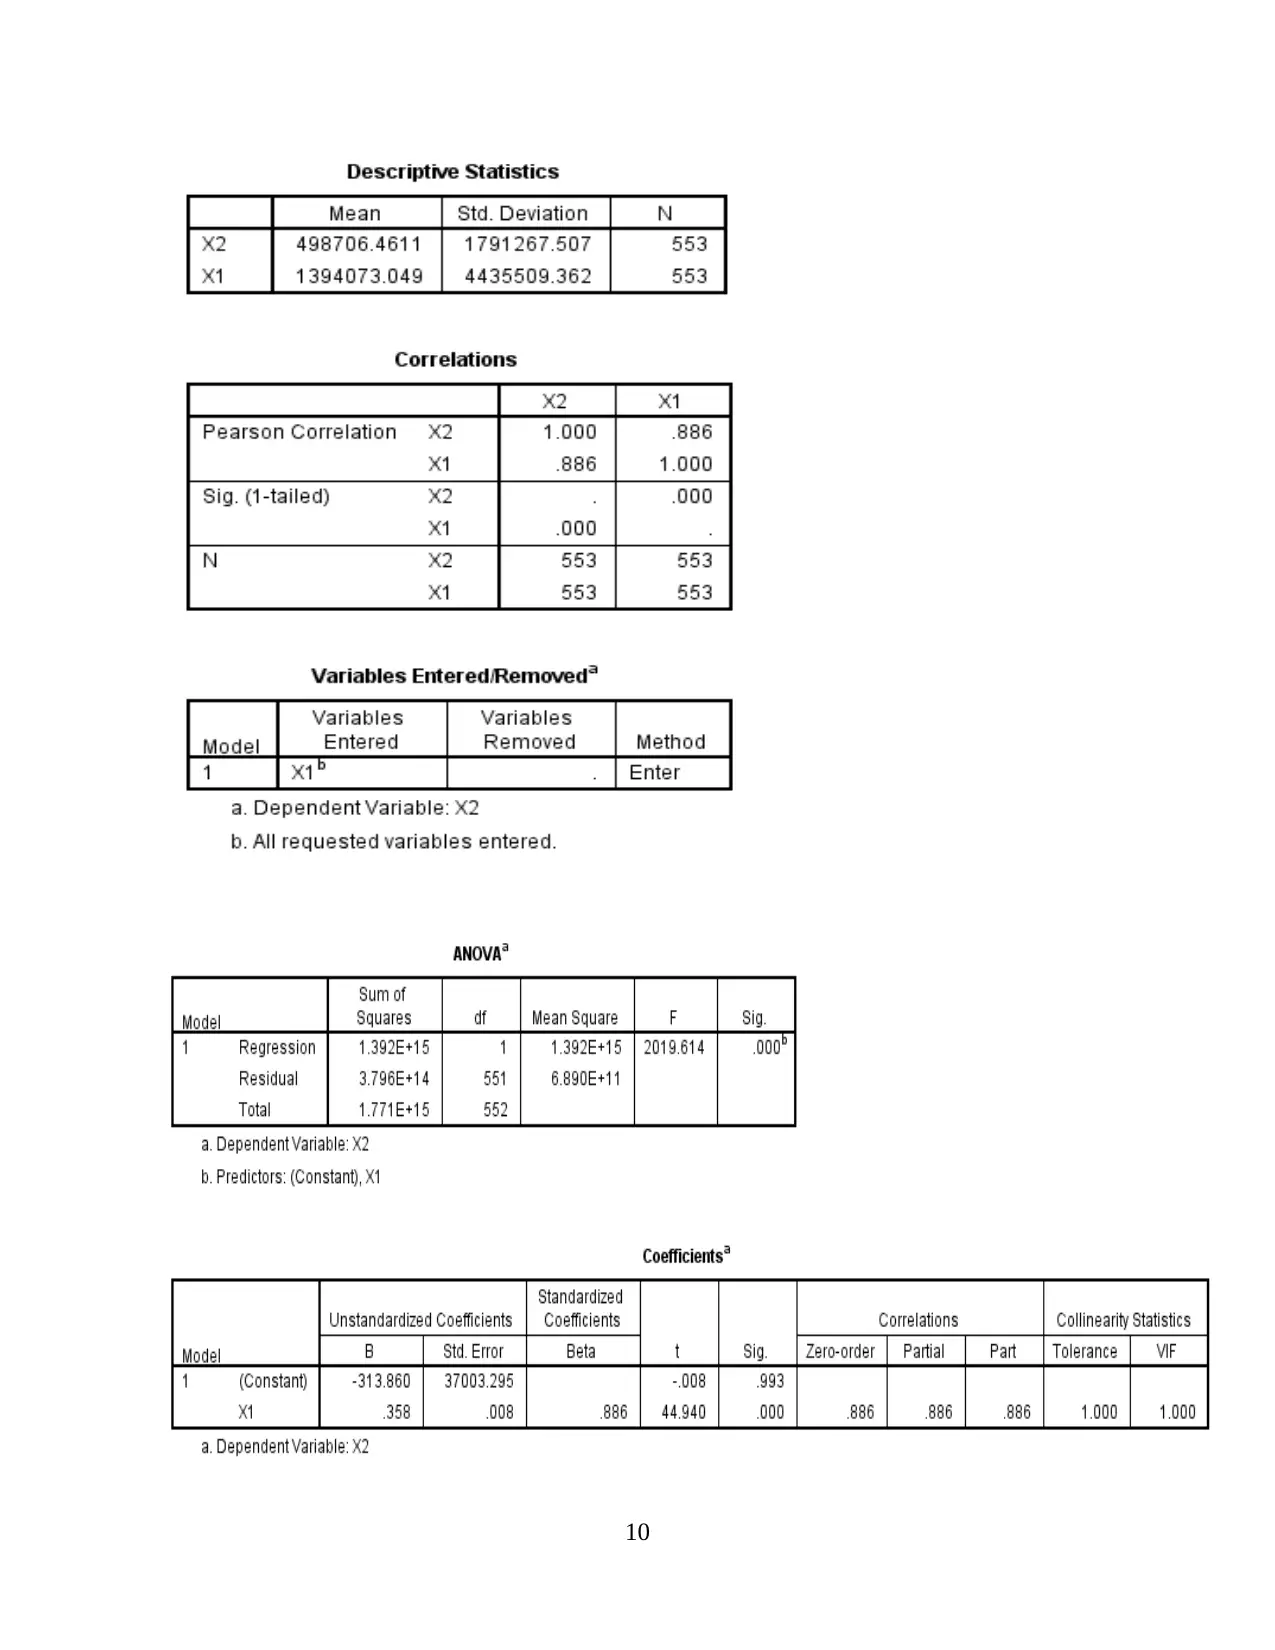
This assignment delves into the application of regression models within the context of business statistics, specifically focusing on the Japanese electronic industry. The analysis begins with an introduction to the regression model, explaining its use in investigating relationships between variables, such as operating revenue, shareholders' funds, debtors, intangible assets, and other fixed assets. The assignment utilizes SPSS for data analysis, including the creation of scatter plots to visualize relationships between variables. It then proceeds to evaluate the significance of the initial model through ANOVA analysis, rejecting or accepting null hypotheses based on p-values. The document also includes a re-estimated model, comparing the initial and re-estimated models and interpreting the estimated coefficients. The study concludes by emphasizing the importance of business statistics in decision-making, highlighting the effective use of statistical tools and techniques in areas like finance and research.
Document Page
Business statistics
tabler-icon-diamond-filled.svg

Paraphrase This Document

Need a fresh take? Get an instant paraphrase of this document with our AI Paraphraser
Document Page
Table of Contents
INTRODUCTION...........................................................................................................................1
TASK...............................................................................................................................................1
1. Regression Model:...................................................................................................................1
2. Considered variables................................................................................................................1
3. Plot the dependent variable against each independent variable using scatter plot/dot function
in SPSS. Describe any visible relationship from the plots..........................................................2
4. Evaluation of significance with initial model..........................................................................9
5. Re - estimated model.............................................................................................................13
CONCLUSION..............................................................................................................................15
REFERENCES..............................................................................................................................16
Document Page
INTRODUCTION
Business statistics implies to organised use of statistical measures and methods in respect
of management and trade problems with aim to improve decision making (Wang and et. al.,
2013). Statistics is areas of research and study which covers detailed analysis of numeric facts,
data, information, relevant figures and other key measurements. The study involves practical
application of statistical tools like regression model, Hypothesis tests, coefficients of the re-
estimated model etc. in context of Japan's electronic industry. It also provides comparison of
initial model and re-estimated model along with evaluation of characteristics of fit between them.
TASK
1. Regression Model:
For investigating the connection among two or maybe more elements and to predict one
element based on another, a regression model is often used. This model mainly includes
regression analysis in which variables selected may be independent those which are applied as
forecaster or normal input sources and dependent, those which are applied as response or output
variables (Berrett and Calder, 2012). Generally independent Variable-X is considered as factor
which could be easily controlled while variable-Y is factor which indicates variations in
independent variable-X. The causal link among factors X and Y under regression model enables
an researcher to anticipate Y's value in respect of each X's value appropriately.
2. Considered variables
Variables Particulars
Y = Operating Revenue
(Turnover)
It is gross receipts generated through corporation's primary and
core business or trade activities.
X1 = Shareholders’ funds Amount of shareholder's equity or fund is to assess how much
of corporation's net assets belong to company's shareholders. It
is sum of equity or capital in a corporation owned by the
stakeholders or investors.
X2 = Debtors Debtors or trade receivables in company's financial statement
shows that money or sum is to be received from vendors or
1
Document Page
customers who purchased goods or owes money.
X3 = Intangible Assets An intangible asset is a non-physical asset in essence.
Goodwill, copyrights, patents, brand recognition and other
intellectual properties are key intangible assets.
X4 = BvD Indep. Indic. Regarded as ‘Corporation independence indicator’. It
categorises the grade of independence of a corporation.
Following are indicator marks, as follows:
A: No reported shareholder with direct or complete equity in
excess of 25 shares.
B: No reported shareholder with immediate or complete equity
in excess of 50 percent. And with more than 25 percent direct
or complete property, one or more shareholders are reported.
C: One reported shareholder with direct or full of more than 50
percent. Also provided to a business when a reference shows
the real proprietor of the business.
D: One reported shareholder with direct ownership of over
50%.
U: Unknown status of independence.
Note: Cases with ‘U’ must be excluded from the data sample.
Please recode this categorical variable into a dummy variable
as follows: 1 = BvD Indep. Indic. ‘A’ 0 = BvD Indep. Indic.
‘B’, ‘C’ or ‘D’.
X5 = Other fixed assets These are assets that are acquired by company for long run use
and not easily convertible in into cash like land, equipment,
buildings etc.
2
tabler-icon-diamond-filled.svg

Paraphrase This Document

Need a fresh take? Get an instant paraphrase of this document with our AI Paraphraser
Document Page
3. Plot the dependent variable against each independent variable using scatter plot/dot function in
SPSS. Describe any visible relationship from the plots
Graphical representation of analysis between operating Revenues and intangible fixed
assets
3
Document Page
Plots of regression analysis between operating revenues and other fixed assets
4
Document Page
3. Graphical representation between the shareholder’s fund (X1), Debtors (X2), intangible
fixed assets (X3) and other fixed assets (X5)
5
tabler-icon-diamond-filled.svg

Paraphrase This Document

Need a fresh take? Get an instant paraphrase of this document with our AI Paraphraser
Document Page
6
Document Page
7
Document Page
8
tabler-icon-diamond-filled.svg

Paraphrase This Document

Need a fresh take? Get an instant paraphrase of this document with our AI Paraphraser
Document Page
4. Evaluation of significance with initial model
H1: Shareholders fund (X1) and Debtors (X2).
Ha: Shareholder’s get increased in compared to debtors
H0: Shareholders do not get increased compared to debtors
9
Document Page
10
chevron_up_icon
1 out of 19
circle_padding
hide_on_mobile
zoom_out_icon
[object Object]